

Abstract
Antibiotic resistance constitutes one of the most pressing public health concerns. Antimicrobial peptides (AMPs) of multicellular organisms are considered part of a solution to this problem, and AMPs produced by bacteria such as colistin are last-resort drugs. Importantly, AMPs differ from many antibiotics in their pharmacodynamic characteristics. Here we implement these differences within a theoretical framework to predict the evolution of resistance against AMPs and compare it to antibiotic resistance. Our analysis of resistance evolution finds that pharmacodynamic differences all combine to produce a much lower probability that resistance will evolve against AMPs. The finding can be generalized to all drugs with pharmacodynamics similar to AMPs. Pharmacodynamic concepts are familiar to most practitioners of medical microbiology, and data can be easily obtained for any drug or drug combination. Our theoretical and conceptual framework is, therefore, widely applicable and can help avoid resistance evolution if implemented in antibiotic stewardship schemes or the rational choice of new drug candidates.
Keywords: resistance evolution, antibiotics, antimicrobial peptides, pharmacodynamics
1. Introduction
Antibiotic resistance is prevalent [1] and evolves quickly. It takes only a few years from the introduction of a new antibiotic to the clinic until resistant strains emerge [2]. Prudent use and the introduction and development of novel antibiotics are currently considered to be the most effective ways to tackle resistance evolution [3]. The prediction of when and how antibiotic resistance evolves and spreads is notoriously difficult, but would be extremely informative for antibiotic stewardship and the development of new drugs.
Among the new drugs under development are antimicrobial peptides (AMPs) [4]. AMPs are peptides that have spatially explicit hydrophobic and cationic residues [5]. Note that, for example, polymixins (including colistin) are usually subsumed under antibiotics, also fall into this category as they are AMPs of bacterial origin [6,7]. One of the alleged advantages of AMPs is that bacterial resistance would evolve much more slowly than against antibiotics [5,8], a highly desirable property [9].
We have recently demonstrated that AMPs from multicellular organisms affect growing bacterial populations differently from antibiotics, i.e. they differ in the pharmacodynamics (or dose–response relationship) [10]. A similar observation has been reported for colistin, a last-resort drug to treat Pseudomonas infections [11]. Pharmacodynamic characteristics of susceptible and resistant bacterial strains can be used to illustrate the selection of resistance under treatment with a range of dosage [12]. Such application is based on the concept of the ‘mutant selection window’ (MSW, figure 1) [13,14]. The MSW has been successfully applied in animal models, demonstrating its value to understanding resistance emergence in vivo [16].
Figure 1.

The revised mutant selection window (MSW) and pharmacodynamic parameters. (a) The MSW is defined as the antimicrobial concentration range in which resistant mutants are selected [13]. Following [14], we determine the MSW using net growth curves of a susceptible strain S and a resistant strain R. Mathematically, net growth is described with the pharmacodynamic function ψ(a) ([15], see Material and methods and the electronic supplementary material, figure S3 for details). In short, the function consists of the four pharamcodynamic parameters: net growth in the absence of antibicrobials ψmax, net growth in the presence of a dose of antimicrobials, which effects the growth maximal, ψmin, the minimum inhibitory concentration (MIC) and the parameter κ, which describes the steepness of the pharamcodynamic curve. Here, the two pharmacodynamics functions ψS(a) (continuous pink line) and ψR(a) (dotted black line) describe the net growth of the S and R, respectively, in relation to the drug concentration a. Cost of resistance c is included as a reduction of the maximum growth rate of the resistant strain ψmax,R, with c = 1 − ψmax,R/ψmax,S. Note that with this definition, cost of resistance is expressed as reduction in net growth rate in the absence of antimicrobials (a = 0). The lower bound of the MSW is the concentration for which the net growth rate of the resistant strain is equal to the net growth rate of the sensitive strain and is called the minimal selective concentration (MSC) (see Material and methods for analytic solution; see the electronic supplementary material, figure S1 for how the MSC is influenced by pharamcodynamic parameters of the sensitive strain). The upper bound is given by the MIC of the resistant strain MICR. We calculate the size of the MSW as:  . (b) Following the original approach to define the MSW [13], the boundaries of the MSW can also be applied to the pharmacokinetics of the system. The black line represents the change in antimicrobial concentration over time due to input (increase) and decay (decrease). The lower and upper boundaries of the shaded area indicate the MSW.
The width of the MSW is partly determined by the steepness of the pharmacodynamic curve (figure 1). Importantly, the concentration range between no killing and maximal killing is much narrower for AMPs than antibiotics, resulting in a much steeper curve. The maximum killing rate of AMPs is much higher than of antibiotics, as reflected in quicker killing time [17]. These differences between AMPs and antibiotics with respect to their pharmacodynamic parameters determine the size of the MSW and enable us to assess the influence of the MSW on resistance evolution. Another difference relevant to the evolution of resistance is the finding that many antibiotics increase mutation rates of bacteria [18–20], but the AMPs tested so far do not show such an effect as they do not elicit bacteria DNA repair responses [18,19].
Here we use a pharmacodynamics approach that has been widely used to describe sigmoid dose–response relationships [15,21–23] to study the evolution of resistance in a homogeneous population. Our work uses the formulation of pharmacodynamic function from Regoes et al. [15]. We particularly explored how the steepness of the pharmacodynamic curve (described by the Hill coefficient κ), together with other pharmacodynamic parameters determine the probability of resistance emergence [15]. The potential importance of the Hill coefficient κ is often overlooked in many pharmacodynamic models, where it is simply set to 1 for all drugs [24]. Recent work includes the Hill coefficient [25,26], indicating the importance of this pharmacodynamic parameter.
We use this approach with different parameter values for κ, derived from empirical data [10], as this allows us to calculate the size of the MSW that generalizes over all possible resistant strains. Gullberg et al. demonstrated [14] that resistant mutants are already under positive selection below the minimum inhibitory concentration (MIC) of the susceptible strain. We, therefore, use the minimal selective concentration (MSC, figure 1a) as the lower boundary, not the MIC of the sensitive strain that was used previously [12,13]. Using empirical parameter estimates for AMPs and antibiotics, we show that the probability of resistance evolution against AMPs (or any drug with similar pharmacodynamics properties) is much lower than for antibiotics. We, therefore, provide a robust and generalizable predictive framework for studying the evolution of drug resistance. This is particularly useful to apply when new drugs are introduced, i.e. before resistance has evolved.
2. Methods
For the parametrization of the predictive models, we used two main sources. The pharmacodynamic parameters were taken from our own studies that determine pharmacodynamics for AMPs and antibiotics under standardized conditions [10]. In short, time-kill experiments with different AMP concentrations were conducted and the slopes of the linear regressions were used to calculate the parameters of the pharmacodynamic function. Here, we only took into account the initial kill rates and assumed a homogeneous population structure. The estimates of mutation rates again are from our own comparative study on mutagenesis under AMP and antibiotic treatment [18].
(a). Calculation of the size of the mutant selection window
The size of the MSW depends on the lower and upper bound of the MSW and is calculated as ratio, due to the logarithmic scale that is used to plot dose–response relationships (figures 1a and 2a):
| 2.1 |
The lower bound of the MSW is the concentration for which the net growth rate of the resistant strain is equal to the net growth rate sensitive strain and is called the MSC. The upper bound of the MSW is the MIC of the resistant strain (MICR) (figure 1a).
Figure 2.

The mutant selection window (MSW) for arbitrary mutant strains. The two boundaries of the MSW, MSC and MICR, are influenced differently by the pharmacodynamic parameters of the sensitive strain S and the resistant strain R. (a) The lower boundary of the MSW (MSC) depends primarily on the pharmacodynamic parameters of the sensitive strain, assuming that the net growth rate of the resistant strain below the MSC is approximately at the same level as without antimicrobials: ψR(a) ≈ ψmax,S(1 − c) = ψR,approx, for 0 < a < MSC (ψR: dotted black line; ψR,approx: continuous black line) (see Material and methods for details). The effect of each of the four pharamcodynamic parameters and of the cost of resistance on the MSC is depicted in the electronic supplementary material, figure S1. We plotted the pharmacodynamic function ψS(a) of two sensitive strains with varying κ values: ψS,1(a) representative for antibiotics with a small κ (κ = 1.5, pink) and ψS,2(a) representative for AMPs with a large κ (κ = 5, blue). Increasing the κ value results in increasing the MSC (MSC1 (pink) <MSC2 (blue)). (b) The upper boundary of the MSW is per definition the MICR, which is linked to its fitness cost, i.e. the upper boundary MICR increases with costs c (data from [27]). Here, the log-linear regression and the 95% confidence interval (CI) are plotted. See Materials and methods for details of the statistics. (c) The relationship between the cost of resistance, other pharmacodynamic parameters and the size of the MSW is complex. We show that because both boundaries of the MSW—the MSC and the MICR—are influenced by costs of resistance c, the lowest MSW window size is achieved at intermediate cost of resistance c. Note that although the data plotted in (b) shows that resistance mutation can also be advantageous in terms of fitness (c < 0), the size of the MSW can only be determined for 0 ≤ c ≤ 1, because 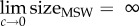 .We plotted the size of the MSW (line) and the 95% CIs for both AMP-like and antibiotic (AB)-like pharmacodynamics, with ψmax,S = 1, MICS = 1, ψmin,S,AB = −5, ψmin,S,AMP = −50, κS,AB = 1.5 and κS,AMP = 5. ψmax,R was calculated using the relationship log10(MICR/MICS) = 2.59c + 1.65.
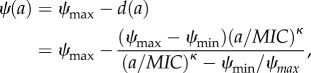
To analytically describe the MSW, we use the pharmacodynamic function ψ(a), which mathematically describes the net growth rate with a Hill function:
 |
2.2 |
[10,15,21]. Here, a is the antimicrobial drug concentration. The net growth rate in the absence of drugs ψ(a = 0) is equal to ψmax (ψmax ≤ 0), d(a) is the effect of the antimicrobial with the dose a, and ψ(a → ∞) = ψmin. Therefore, the maximal effect Emax is Emax
= ψmax − ψmin. The parameter MIC denotes the concentration that results in zero net growth (this definition differs from the ‘official’ MIC definition by Mouton et al. [28]). The Hill coefficient κ describes the steepness of the curve; functions with higher κ describe steeper curves (figure 2a). For illustration of the pharamcodynamic parameters, see the electronic supplementary material, figure S3. Cost of resistance c is included as a reduction of the maximum growth rate of the resistant strain in the absence of antimicrobials with c = 1 − ψmax,R/ψmax,S (figures 1a and 2a). The pharamcodynamic function can be described for both a drug susceptible strain S and a drug-resistant strain R, with ψS(a) and ψR(a), respectively. The MSC is calculated as ψS(a) = ψR(a). We assume that the net growth rate of the resistant strain below the MSC is, for any given concentration a, with 0 < a < MSC, approximately at the same level as without antimicrobials and, therefore, we set ψR(a) ≈ ψR,approx (illustrated in figure 2a). With ψR,approx= ψmax,R= ψmax,S (1 − c), we are able to describe the net growth rate of the resistant strain with the net growth rate of the sensitive strain ψmax,S and the costs of resistance c: ψR(a) ≈ ψR,approx = ψmax,S (1 − c). This is valid because  and assuming κR > ≈κS. The analytic solution of the MSC is
 |
2.3 |
After our publication [29] another paper reported the same solution [30].
(b). Analysis of the relationship between cost of resistance c and MICR
Data [27] determining relationship between fitness of resistant strains and MICR/MICS were re-analysed. The dataset contained information about increase of MIC due to resistance and fitness of the resistant strain and summarizes cases of bacterial resistance to antibiotics. Similar data for AMPs have been compiled recently [31] but are yet too scarce to include in the following analysis. We, therefore, assumed similar relationships for both antibiotics and AMPs.
Fitness and MICR/MICS are significantly correlated (p = 5.716 × 10−09, Spearman's ρ = 0.4866908, figure 2b). We then calculated cost of resistance c as c = 1 – fitness, using n = 128 observations compiled in the mentioned dataset. Fitting a log10 transformed linear regression to the data resulted in the parametrized function log10 (MICR/MICS) = 2.59c + 1.65. We use the coefficient of determination R2 = 0.22 (p = 1.518 × 10−08) as the measure of goodness of fit.
The data were then resampled with using bootstrapping to: (i) determine the 95% confidence interval (CI) of log-linear regression of the data as interval. This was done by determining in which interval 95% of the bootstrapped regressions fall into (figure 2b); and (ii) to include the variance of the data when determining the size of the MSW (figure 2c). For the latter, the given dataset was fitted to the mentioned log-linear regression 200 times, resulting in 200 parameter sets for the regression. Each parameter set was then used to calculate the size of the MSW depending on the cost of resistance. The 95% CI was then calculated as the interval, in which 95% of the calculated size of the MSW are in for a given cost.
(c). Model of evolution and prediction of resistance
To study resistance evolution, we used a mathematical model that incorporates pharmacodynamics and pharmacokinetics and captures population dynamics of bacterial populations under treatment with antimicrobial drugs [15]. We ran stochastic simulations to calculate the probability of resistance emergence, the probability of takeover by a resistant strain, the time to resistance emergence and the risk of resistance (the resistance hazard [32]).
To simulate treatment, we consider a patient harbouring 106 susceptible bacteria. We assume a homogeneous population and a uniform environment. Bacterial mutation rates are assumed to depend on the antimicrobial used for treatment (antibiotics or AMPs). When a resistant strain arises, it is assumed to have an MIC that is correlated with its fitness cost (figure 2c). For simplicity, we only consider one type of mutant. Antimicrobials are administered every day (see the electronic supplementary material, figure S2) and treatment lasts one week.
The population dynamics of the susceptible and resistant strains is captured in the following system of differential equations:
 |
2.4 |
where S represents the wild-type strain and R represents the resistant strain. The maximum net growth rate ψmax is the difference between the replication rate r and the intrinsic death rate dn: ψmax = r − dn. μ is the mutation rate. Note that we only consider one-step de novo resistance evolution.
To include the change of antimicrobial concentrations over time (pharmacokinetics) into our model, we define the death rate to be dependent on the time-dependent antimicrobial concentration a(t):
| 2.5 |
We assume a time-dependent pharmacokinetic function a(t) of the following form (see also the electronic supplementary material, figure S2):
| 2.6 |
Here, ka is the absorption rate and ke is the decay rate. D is the dose given each time, n is the number of doses and τ is the dosing frequency. We define the treatment dose as the average concentration during the course of treatment:
| 2.7 |
We implemented the model in equation (2.4) stochastically using the Gillespie algorithm [33], which allowed us to monitor how frequently mutants arise. Parameters were selected based on empirical data as stated above. The net growth rate of wild-type in the absence of antimicrobials was set as 1. Mutants suffer resistant-level related costs (figure 2c). κ of AMPs and antibiotics were set as 5 and 1.5, respectively [10]. ψmin for AMPs is fixed as −50 h−1; and for antibiotics is fixed as −5 h−1. Mutation rates in AMPs are assumed to be three times lower than in antibiotics, in accordance with our empirical estimates [18]. All the parameters and their values are listed in the electronic supplementary material, table S1. All the pharmacokinetic parameters are the same in different simulations (see the electronic supplementary material, figure S2). For each set of parameters, cohorts of 500 infected individuals were simulated. Successful treatment is defined as complete clearance of both sensitive and resistant strains at the end of the one-week treatment. For each cohort, we calculate the probability of treatment success as the proportion of individuals in whom treatment was successful, i.e. a complete clearance of both resistant and sensitive strains. In each individual, we score the time of emergence of resistance strains, and estimate the resistance hazard based on the average probability of treatment success and the population size of bacteria over time. The hazard function can be written as
| 2.8 |
where K is the capacity, S denotes population size of sensitive strain and pS→R is probability of a treatment developing resistance, which is calculated from the results of simulations, ψR is the growth rate of resistant strain. Our hazard function calculates the average proportion of resistant population under certain treatment dose and duration.
The analysis was performed in R (v. 3.1.3 and v. 3.2.2) [34] using Rstudio (v. 0.98.1103 and 0.99.903). The code is available upon request.
3. Results
The MSW (figure 1) shows the concentration of an antimicrobial under which susceptible strains are suppressed, but resistant strains can still grow in the framework of pharmacodynamics (figure 1a) [14] and pharmacokinetics (figure 1b) [13]. We show that the lower bound of the MSW can be calculated based solely on the pharmacodynamics of the susceptible strains and the costs of resistance (figures 1a and 2a, equation (2.3)). The cost is defined here as the reduction of growth rate in a drug-free environment.
The pharmacodynamics of AMPs and antibiotics differ significantly [10]: the pharmacodynamic curves of AMPs are much steeper as captured by a higher Hill coefficient κ (figure 2a); the step from a concentration with no effect to a killing concentration is, therefore, much smaller. This feature is probably owing to a higher number of ‘hits’ that AMPs need to deliver to bacteria to kill them and perhaps cooperative binding of AMP molecules to the cell membrane [35]. This results in a narrower MSW for AMPs than antibiotics. The MSW opens at lower concentrations when the costs of resistance are low. Our re-analysis of data on antibiotic resistance against a variety of antibiotics in a number of different bacterial species (data from [27]) shows that the upper bound of the MSW correlates with the cost of resistance (figure 2b). Taken together we are now in a position to estimate the size of the MSW for any drug, if estimates of pharmacodynamic parameters based on the sensitive strains, including the MIC, the maximum effect and the steepness of the pharmacodynamics curve are available (figures 1a and 2c).
Next, we wanted to explore if the differences between AMPs and antibiotics in the width of the MSW correlated with different probabilities of drug resistance evolution within a host. A further difference between AMPs and antibiotics is that some antibiotics increase mutagenesis but AMPs do not [18,19]. We incorporated this difference in addition to the difference in the steepness of the pharmacodynamics relationship into a stochastic model describing bacterial replication and evolution under selection pressure from AMPs. We consider two cases here: (i) do resistant mutants emerge, and (ii) do resistant mutants drive the susceptible strains to extinction?
To answer these questions, we ran stochastic simulations varying the pharmacokinetic and pharmacodynamic parameter values at a given average antimicrobial concentration (e.g. runs, figure 3a). Stochastic models allow assessment of resistance evolution for a given MSW under temporally varying antimicrobial dosage. We find that resistance emerges with a much higher probability for the parameter settings of antibiotics (figure 3b, top row) than for AMPs in our simulations (figure 3b, bottom row). All intermediate cases, where we simulated changes in one or two of the parameters κ mutation rate and maximum effect, also reduce the probability of resistance emergence compared to ‘pure’ antibiotics. These differences are also robust under very low fitness costs (electronic supplementary material, figure S4).
Figure 3.

Evolution of drug resistance determined by pharmacodynamics. (a) At high dose (D = 400; all other parameters see below (AB)) antimicrobials achieve maximal effects and rapidly kill most of the population, preventing resistance evolution (right). At medium dose (D = 45), the sensitive strain will not be eliminated immediately, and resistant mutants emerge (central). At low dose (D = 5), the sensitive strain will not be removed, the mutants also emerge, but will not quickly reach equilibrium owing to substantial fitness costs (left, resistant: pink, susceptible: blue). (b) Simulations comparing the range from ‘pure’ antimicrobial peptides (AMP) to ‘pure’ antibiotics (AB) by altering μ, ψmin and κ. We find that the probabilities of treatment failure (left), of failure caused by resistant strains (middle) and of resistance emergence are always higher under the AB-scenario than the AMP-scenario. A successful treatment requires less AMP than AB. (c) Following [32], we calculate the resistance hazard as the time-averaged proportion of mutants in a patient under a particular treatment dose. We find that AMPs are much less likely to select for resistance across concentrations than antibiotics (inset graph: a log-scale view). (d) Time to resistance is much longer under AMP than AB treatment when the average concentration is below MIC, but shorter around MIC and equal in higher concentrations (inset graph). The parameters for all simulations of this figure are: ψmax,S = 1, ψmax,R = 0.8, κAB = 1.5, κAMP = 5, ψmin,AB = −5, ψmin,AMP = −50, MICS = 10,
 μAMP = 3 × 10⁻⁷, ka = 0.5, ke = 0.2, dn = 0.01, τ = 1/24.
We also find that resistant mutants are much more likely to drive the susceptible bacterial populations to extinction under antibiotic than under AMP treatment (figure 3b). Again, this result also holds when we study intermediate cases. In summary, our results show that the application of drugs with low κ, mutation elevation and low maximum effect, i.e. characteristics found in most common antibiotics, inherently bears a high risk of causing the evolution of resistance.
We have shown before [10] that combinations of AMPs have higher κ and lower MICs than individual AMPs. This also results in differences in resistance selection and the extinction of susceptible strains, consistent with the results above.
Day et al. [32] provided an approach to calculate a resistance hazard: a measure that combines the time of resistance emergence and its selection within a host. We calculated similar resistance hazard for AMPs in comparison to antibiotics. The simulation results show (figure 3c) that the hazard is much higher and the concentration range much wider under antibiotic treatment than under AMP treatment. Also, when resistance evolves, it emerges earlier in the antibiotic scenario than in the AMP scenario at low concentrations (figure 3d). In certain concentrations (e.g. around MIC in our simulation), resistance emerges earlier in AMPs than in antibiotics (figure 3d). While the time of emergence is mostly independent of cost of resistance, MIC of the resistant strain and the maximum effect Emax, it is strongly affected by κ and mutation rate: higher κ and lower mutation rate, the latter more important when population sizes are small, confer delayed resistance emergence (electronic supplementary material, figure S5).
4. Discussion
Our predictions suggest that AMPs, or in fact any antimicrobial drug with similar pharmacodynamics, are much less likely to select drug-resistant mutants than antimicrobials with antibiotic-like characteristics. Our theory is blind to the molecular mechanism of action but captures the dynamically relevant aspects of action.
We assume that pharmacodynamics and mutagenic properties of AMPs are significantly different from antibiotics. This assumption is based on limited data of AMPs in the literature [10,18]. More experiments with a variety of AMPs are needed to determine if AMP-like characteristics can be indeed generalized and if these characteristics are significantly different from antibiotics.
In the light of our results, increasing κ and/or the maximum effect are desirable for any drug as well as advantageous to hosts managing their microbiota using AMPs. Our model, therefore, provides useful information for the development of new antimicrobial drugs: higher κ and maximum effect will impose much weaker selection on the bacteria to evolve resistance in lower concentrations, and clear the bacterial population more quickly in higher concentration which will, in turn, reduce the probability of resistance emergence. Currently, mostly AMPs display these properties, but it is likely that new antibiotics that target the cell membrane or wall display similar pharmacodynamics.
The smaller MSW under AMPs is a direct consequence of the steeper pharmacodynamic functions [10]. It is important to note that this relationship hinges on the realization that the window opens at the concentration at which the resistant strains have a higher growth rate than the sensitive strain, well below the MIC of the sensitive strain [14]. Thus, a high Hill coefficient (κ) would constitute a promising characteristic of new antimicrobials. The other characteristics in which AMPs differ from antibiotics—mutagenesis and maximum effect—affect mostly the time until resistance emerges, but not the size of the MSW. Because this time becomes shorter with higher population sizes, these characteristics may have less significance for clinical infections [31]. Very few experimental evolution studies investigate selection for drug resistance in the context of the pharmacodynamic MSW. But work by Firsov and co-workers in Staphylococcus aureus shows that the size of the MSW correlates positively with selection for resistance in fluoroquinolones [36] and also in a comparison between the last-resort drugs vancomycin and daptomycin [37]. These findings are highly consistent with our predictions. In E. coli, all else being equal resistance evolves against a panel of antibiotics but not against the AMP colistin [38].
We find that time to resistance emergence in AMPs is longer than in antibiotics when the concentration is low (subMIC) (figure 3d). Around MIC resistance against AMPs seems to emerge quicker than against antibiotics (figure 3d, inset). This result is explained by the fast removal of sensitive strains due to AMPs' high κ and low ψmin. Overall, the probability of resistance emergence is lower for AMPs as higher concentrations quickly remove the sensitive population. Chevereau et al. [39] reached a different conclusion using a different modelling approach regarding the steepness of the pharmacodynamic curve. In contrast to our approach, that captures the whole pharmacodynamics curve, they modelled the pharmacodynamics only for positive growth. Also, they continuously adjusted the drug concentration to maintain the overall growth rate at half of the maximal in the simulation. In this scenario, drugs with sensitive dose–response would facilitate evolution owing to the wide distribution of fitness, a scenario that seems unlikely in real antimicrobial treatment with fluctuating pharmacokinetics and as implemented here.
One recommendation derived from our modelling approach is that drugs which show pharmacodynamics resembling AMPs should be good candidates for slowing the evolution of resistance. It is often argued that combination therapy reduces resistance evolution (but also, see [40]), as it is supposedly more difficult to evolve resistance against more than one mechanism at a time. We speculate that combination therapy might even prove effective, as combinations of AMPs result in increased κ, which our model predicts to bear lower risks of evolution of resistance [10].
It has been proposed that bacterial resistance evolution against AMPs is highly unlikely [5,8]. Yet, in vitro experimental evolution has demonstrated that resistance to AMPs can arise [41–43] and AMP-resistance mechanisms have been characterized [44]. Against antibiotics, resistance can increase the MIC by 2–3 orders of magnitude in a relatively small bacterial population [45], a range that has not been observed for AMPs. Though AMPs provide promising leads for drug development [4], their conserved killing mechanisms also argue for caution. In their paper ‘arming the enemy’, Bell & Gouyon [46] discussed the high likelihood of cross-resistance against, for example, human AMPs. This problem has hardly been studied. Our analysis suggests how one could reap the benefits of AMPs without arming the enemy: we should rely on agents with AMP-like pharmacodynamics. This, in principle, can be adopted without using AMPs themselves.
Pharmacodynamic estimates can be easily and routinely obtained from time-kill curves. This can also be achieved for drug combinations [10]. A report by the Leopoldina, the German National Academy of Sciences, recently recommended use of new drugs only in combination to avoid fast resistance evolution [47]. The scientific support for this notion is limited and controversial [40,48,49]. In clinical situations, pharmacodynamic approaches can provide a first informed guess. Also, the risk of resistance evolution based on the pharmacodynamics of drug candidates will be a useful additional criterion to develop new drugs. We also note that the concept of the MSW has been applied to understand antiviral-resistance evolution [50], and hence our approach has the potential to inform antiviral-resistance research and also ultimately treatment.
In order to generate predictions on resistance evolution based on pharmacodynamics, one of our main goals of the project, we made a number of simplifying assumptions.
The pharmacodynamics are based on data of initial killing only. Moreover, we assume homogeneous populations over time and space. We implemented costs of resistance, without considering whether resistance mutations per se are costly or mitigated by compensatory mutations. Our simulations (electronic supplementary material, figures S4 and S5) suggest though that costs or resistance are of limited importance in predicting resistance evolution based on pharmacodynamics. Expanding the framework to integrate tolerance and resistance is possible but would require pharmacodynamic estimates and additional functions. Another possible extension of our work would be to include pharmacodynamic estimates of resistant strains that change over time owing to compensatory mutations and to cross-resistance or collateral sensitivity when exposed to combinations of antimicrobials. Finally, we assumed the same pharmacokinetics for all cases in our study. As AMPs are currently rarely used (colistin being the notable exception), future empirical work will inform realistic parameter estimates for pharmacokinetics. In all cases, however, the basis of any analysis concerning resistance evolution is the influence of individual pharmacodynamic parameters, for which we provide a framework.
Supplementary Material
Acknowledgements
We are grateful to Olivia Judson and Sebastian Bonhoeffer for comments on the manuscript. We also thank three anonymous reviewers for comments that greatly improved our manuscript.
Data accessibility
The model will be made available as an R markdown document for use.
Authors' contributions
All authors participated in the design and interpretation of the results. G.Y. was primarily responsible for the predictive modelling, D.Y.B. for the pharmacodynamics work. All authors contributed to the writing of the paper. J.R. wrote the first draft and R.R.R. led the mathematical work.
Competing interests
We declare we do not have competing interests.
Funding
G.Y. was funded by the China Scholarship Council, D.Y.B. was funded by ETH grant (ETH-41 15-2) to R.R.R. J.R. was supported by the European Research Council (EVORESIN 260986). R.R.R. was also supported by the CIC (FU Berlin).
References
- 1.Laxminarayan R, Sridhar D, Blaser M, Wang M, Woolhouse M. 2016. Achieving global targets for antimicrobial resistance. Science 9286, 1–4. ( 10.1126/science.aaf9286) [DOI] [PubMed] [Google Scholar]
- 2.McClure NS, Day T.. 2014. A theoretical examination of the relative importance of evolution management and drug development for managing resistance. Proc. R. Soc. B 281, 20141861 ( 10.1098/rspb.2014.1861) [DOI] [PMC free article] [PubMed] [Google Scholar]
- 3.World Health Organization. 2014. The evolving threat of antimicrobial resistance: options for action. Geneva, Switzerland: WHO. [Google Scholar]
- 4.Czaplewski L, et al. 2016. Alternatives to antibiotics: a pipeline portfolio review. Lancet Infect. Dis. 16, 1–13. ( 10.1016/S1473-3099(15)00466-1) [DOI] [PubMed] [Google Scholar]
- 5.Zasloff M. 2002. Antimicrobial peptides of multicellular organisms. Nature 415, 389–395. ( 10.1038/415389a) [DOI] [PubMed] [Google Scholar]
- 6.Hancock REW, Sahl H-G. 2006. Antimicrobial and host-defense peptides as new anti-infective therapeutic strategies. Nat. Biotechnol. 24, 1551–1557. ( 10.1038/nbt1267) [DOI] [PubMed] [Google Scholar]
- 7.Jochumsen N, Marvig RL, Damkiær S, Jensen RL, Paulander W, Molin S, Jelsbak L, Folkesson A. et al. 2016. The evolution of antimicrobial peptide resistance in Pseudomonas aeruginosa is shaped by strong epistatic interactions. Nat. Commun. 7, 13002 ( 10.1038/ncomms13002) [DOI] [PMC free article] [PubMed] [Google Scholar]
- 8.Fjell CD, Hiss JA, Hancock REW, Schneider G. 2012. Designing antimicrobial peptides: form follows function. Nat. Rev. Drug Discov. 11, 37–51. ( 10.1038/nrd3591) [DOI] [PubMed] [Google Scholar]
- 9.Ling LL, et al. 2015. A new antibiotic kills pathogens without detectable resistance. Nature 520, 388 ( 10.1038/nature14303) [DOI] [PubMed] [Google Scholar]
- 10.Yu G, Baeder DY, Regoes RR, Rolff J.. 2016. Combination effects of antimicrobial peptides. Antimicrob. Agents Chemother. 60, AAC.02434-15. [DOI] [PMC free article] [PubMed] [Google Scholar]
- 11.Mohamed AF, Cars O, Friberg LE. 2014. A pharmacokinetic/pharmacodynamic model developed for the effect of colistin on Pseudomonas aeruginosa in vitro with evaluation of population pharmacokinetic variability on simulated bacterial killing. J. Antimicrob. Chemother. 69, 1350–1361. ( 10.1093/jac/dkt520) [DOI] [PubMed] [Google Scholar]
- 12.Firsov AA, et al. 2013. Bacterial resistance studies using in vitro dynamic models: the predictive power of the mutant prevention and minimum inhibitory antibiotic concentrations. Antimicrob. Agents Chemother. 57, 4956–4962. ( 10.1128/AAC.00578-13) [DOI] [PMC free article] [PubMed] [Google Scholar]
- 13.Drlica K, Zhao X. 2007. Mutant selection window hypothesis updated. Clin. Infect. Dis. 44, 681–688. ( 10.1086/511642) [DOI] [PubMed] [Google Scholar]
- 14.Gullberg E, Cao S, Berg OG, Ilbäck C, Sandegren L, Hughes D, Andersson DI. 2011. Selection of resistant bacteria at very low antibiotic concentrations. PLoS Pathog. 7, e1002158 ( 10.1371/journal.ppat.1002158) [DOI] [PMC free article] [PubMed] [Google Scholar]
- 15.Regoes RR, Wiuff C, Zappala RM, Garner KN, Baquero F, Levin BR. 2004. Pharmacodynamic functions : a multiparameter approach to the design of antibiotic treatment regimens. Antimicrob. Agents Chemother. 48, 3670–3676. ( 10.1128/AAC.48.10.3670-3676.2004) [DOI] [PMC free article] [PubMed] [Google Scholar]
- 16.Cui J, Liu Y, Wang R, Tong W, Drlica K, Zhao X. 2006. The mutant selection window in rabbits infected with Staphylococcus aureus. J. Infect. Dis. 194, 1601–1608. ( 10.1086/508752) [DOI] [PubMed] [Google Scholar]
- 17.Fantner GE, Barbero RJ, Gray DS, Belcher AM. 2010. Kinetics of antimicrobial peptide activity measured on individual bacterial cells using high-speed atomic force microscopy. Nat. Nanotechnol. 5, 280–285. ( 10.1038/nnano.2010.29) [DOI] [PMC free article] [PubMed] [Google Scholar]
- 18.Rodríguez-Rojas A, Makarova O, Rolff J.. 2014. Antimicrobials, stress and mutagenesis. PLoS Pathog. 10, e1004445 ( 10.1371/journal.ppat.1004445) [DOI] [PMC free article] [PubMed] [Google Scholar]
- 19.Rodríguez-Rojas A, Makarova O, Müller U, Rolff J.. 2015. Cationic peptides facilitate iron-induced mutagenesis in bacteria. PLoS Genet. 11, e1005546 ( 10.1371/journal.pgen.1005546) [DOI] [PMC free article] [PubMed] [Google Scholar]
- 20.Kohanski MA, DePristo MA, Collins JJ. 2010. Sublethal antibiotic treatment leads to multidrug resistance via radical-induced mutagenesis. Mol. Cell 37, 311–320. ( 10.1016/j.molcel.2010.01.003) [DOI] [PMC free article] [PubMed] [Google Scholar]
- 21.Shen L, et al. 2008. Dose-response curve slope sets class-specific limits on inhibitory potential of anti-HIV drugs. Nat. Med. 14, 762–766. ( 10.1038/nm1777) [DOI] [PMC free article] [PubMed] [Google Scholar]
- 22.Bonapace CR, Friedrich LV., Bosso JA, White RL. 2002. Determination of antibiotic effect in an in vitro pharmacodynamic model: comparison with an established animal model of infection. Antimicrob. Agents Chemother. 46, 3574–3579. ( 10.1128/AAC.46.11.3574-3579.2002) [DOI] [PMC free article] [PubMed] [Google Scholar]
- 23.Corvaisier S, Maire PH, Bouvier d'Yvoire MY, Barbaut X, Bleyzac N, Jelliffe RW. 1998. Comparisons between antimicrobial pharmacodynamic indices and bacterial killing as described by using the Zhi model. Antimicrob. Agents Chemother. 42, 1731–1737. [DOI] [PMC free article] [PubMed] [Google Scholar]
- 24.Craig WA. 1998. Pharmacokinetic/pharmacodynamic parameters : rationale for antibacterial dosing of mice and men author. Clin. Infect. Dis. 26, 1–10. ( 10.1086/516284) [DOI] [PubMed] [Google Scholar]
- 25.Nielsen EI, Friberg LE.. 2013. Pharmacokinetic-pharmacodynamic modeling of antibacterial drugs. Pharmacol. Rev. 65, 1053–1090. ( 10.1124/pr.111.005769) [DOI] [PubMed] [Google Scholar]
- 26.Sy SKB, Derendorf H.. 2014. Pharmacometrics in bacterial infections. In Applied pharmacometrics (eds Schmidt S, Derendorf H), pp. 229–257. American Association of Pharmaceutical Scientists; New York, NY: Springer; See http://link.springer.com/10.1007/978-1-4939-1304-6. [Google Scholar]
- 27.Melnyk AH, Wong A, Kassen R. 2014. The fitness costs of antibiotic resistance mutations. Evol. Appl. 8, 273–283. ( 10.1111/eva.12196) [DOI] [PMC free article] [PubMed] [Google Scholar]
- 28.Mouton JW, Dudley MN, Cars O, Derendorf H, Drusano GL. 2005. Standardization of pharmacokinetic/pharmacodynamic (PK/PD) terminology for anti-infective drugs: an update. J. Antimicrob. Chemother. 55, 601–607. ( 10.1093/jac/dki079) [DOI] [PubMed] [Google Scholar]
- 29.Yu G, Baeder DY, Regoes RR, Rolff J.. 2017. Predicting drug resistance evolution: insights from antimicrobial peptides and antibiotics. bioRxiv ( 10.1101/138107) [DOI]
- 30.Greenfield BK, et al. 2018. Modeling the emergence of antibiotic resistance in the environment: an analytical solution for the minimum selection concentration. Antimicrob. Agents Chemother. 62, e01686-17. ( 10.1128/AAC.01686-17) [DOI] [PMC free article] [PubMed] [Google Scholar]
- 31.Andersson DI, Hughes D, Kubicek-Sutherland JZ. 2016. Mechanisms and consequences of bacterial resistance to antimicrobial peptides. Drug Resist. Updat. 26, 43–57. ( 10.1016/j.drup.2016.04.002) [DOI] [PubMed] [Google Scholar]
- 32.Day T, Read AF. 2016. Does high-dose antimicrobial chemotherapy prevent the evolution of resistance? PLoS Comput. Biol. 12, e1004689 ( 10.1371/journal.pcbi.1004689) [DOI] [PMC free article] [PubMed] [Google Scholar]
- 33.Pineda-Krch M. 2008. GillespieSSA: implementing the stochastic simulation algorithm in R. J. Stat. Softw. 25, 1–18. ( 10.18637/jss.v025.i12) [DOI] [Google Scholar]
- 34.R Core Team. 2015. R: a language and for statistical computing. Vienna, Austria: R Foundation for Statistical Computing. [Google Scholar]
- 35.Hill AV. 1910. The possible effects of the aggregation of the molecules of hæmoglobin on its dissociation curves. J. Physiol. 40, 4–7. [Google Scholar]
- 36.Firsov AA, Vostrov SN, Lubenko IY, Drlica K, Portnoy YA, Zinner SH. 2003. In vitro pharmacodynamic evaluation of the mutant selection window hypothesis using four fluoroquinolones against Staphylococcus aureus. Antimicrob. Agents Chemother. 47, 1604–1613. ( 10.1128/AAC.47.5.1604-1613.2003) [DOI] [PMC free article] [PubMed] [Google Scholar]
- 37.Firsov AA, Smirnova MV, Lubenko IY, Vostrov SN, Portnoy YA, Zinner SH. 2006. Testing the mutant selection window hypothesis with Staphylococcus aureus exposed to daptomycin and vancomycin in an in vitro dynamic model. J. Antimicrob. Chemother. 58, 1185–1192. ( 10.1093/jac/dkl387) [DOI] [PubMed] [Google Scholar]
- 38.Suzuki S, Horinouchi T, Furusawa C.. 2014. Prediction of antibiotic resistance by gene expression profiles. Nat. Commun. 5, 5792 ( 10.1038/ncomms6792) [DOI] [PMC free article] [PubMed] [Google Scholar]
- 39.Chevereau G, Dravecká M, Batur T, Guvenek A, Ayhan DH, Toprak E, Bollenbach T. 2015. Quantifying the determinants of evolutionary dynamics leading to drug resistance. PLoS Biol. 13, e1002299 ( 10.1371/journal.pbio.1002299) [DOI] [PMC free article] [PubMed] [Google Scholar]
- 40.Pena-Miller R, Laehnemann D, Jansen G, Fuentes-Hernandez A, Rosenstiel P, Schulenburg H, Beardmore R. 2013. When the most potent combination of antibiotics selects for the greatest bacterial load : the smile-frown transition. PLoS Biol. 11, e1001540 ( 10.1371/journal.pbio.1001540) [DOI] [PMC free article] [PubMed] [Google Scholar]
- 41.Perron GG, Zasloff M, Bell G. 2006. Experimental evolution of resistance to an antimicrobial peptide. Proc. Biol. Sci. 273, 251–256. ( 10.1098/rspb.2005.3301) [DOI] [PMC free article] [PubMed] [Google Scholar]
- 42.Habets MGJL, Brockhurst M . 2012. Therapeutic antimicrobial peptides may compromise natural immunity. Biol. Lett. 8, 416–418. ( 10.1098/rsbl.2011.1203) [DOI] [PMC free article] [PubMed] [Google Scholar]
- 43.Dobson AJ, Purves J, Kamysz W, Rolff J.. 2013. Comparing selection on S. aureus between antimicrobial peptides and common antibiotics. PLoS ONE 8, e76521 ( 10.1371/journal.pone.0076521) [DOI] [PMC free article] [PubMed] [Google Scholar]
- 44.Joo H-S, Fu C, Otto M. 2016. Bacterial strategies of resistance to antimicrobial peptides. Phil. Trans. R. Soc. B 371, 20150291 ( 10.1098/rstb.2015.0291) [DOI] [PMC free article] [PubMed] [Google Scholar]
- 45.Barbosa C, Trebosc V, Kemmer C, Rosenstiel P, Beardmore R, Schulenburg H, Jansen G. 2017. Alternative evolutionary paths to bacterial antibiotic resistance cause distinct collateral effects. Mol. Biol. Evol. 34, 2229–2244. ( 10.1093/molbev/msx158) [DOI] [PMC free article] [PubMed] [Google Scholar]
- 46.Bell G. 2003. Arming the enemy: the evolution of resistance to self-proteins. Microbiology 149, 1367–1375. ( 10.1099/mic.0.26265-0) [DOI] [PubMed] [Google Scholar]
- 47.Akademie der Wissenschaften Hamburg. 2013. Antibiotika-Forschung: probleme und perspektiven. Berlin, Germany: Walter de Gruyter. [Google Scholar]
- 48.Imamovic L, Sommer MOA. 2013. Use of collateral sensitivity networks to design drug cycling protocols that avoid resistance development. Sci. Transl. Med. 5, 204ra132 ( 10.1126/scitranslmed.3006609) [DOI] [PubMed] [Google Scholar]
- 49.Holmes AH, Moore LSP, Sundsfjord A, Steinbakk M, Regmi S, Karkey A, Guerin PJ, Piddock LJV. 2016. Understanding the mechanisms and drivers of antimicrobial resistance. Lancet 387, 176–187. ( 10.1016/S0140-6736(15)00473-0) [DOI] [PubMed] [Google Scholar]
- 50.Rosenbloom DIS, Hill AL, Rabi SA, Siliciano RF, Nowak MA. 2012. Antiretroviral dynamics determines HIV evolution and predicts therapy outcome. Nat. Med. 18, 1378–1385. ( 10.1038/nm.2892) [DOI] [PMC free article] [PubMed] [Google Scholar]
Associated Data
This section collects any data citations, data availability statements, or supplementary materials included in this article.
Supplementary Materials
Data Availability Statement
The model will be made available as an R markdown document for use.