Abstract
A series of Eu3+ and Dy3+ DOTA-tetraamide complexes with four appended primary amine groups were prepared and their CEST and T1/T2 relaxation properties measured as a function of pH. The CEST signals in the Eu3+ complexes show a surprisingly strong CEST signal after the pH was reduced from 8 to 5. The opposite trend was observed for the Dy3+ complexes where the r2ex of bulk water protons increased dramatically from ~1.5 mM−1s−1 to ~13 mM−1s−1 between pH 5 and 9 while r1 remained unchanged. A fit of the CEST data (Eu3+ complexes) to Bloch theory and the T2 data (Dy3+ complexes) to Swift-Connick theory provided the proton exchange rates as a function of pH. These data showed that the four amine groups contribute significantly to proton catalyzed exchange of the Ln3+-bound water protons even though their pKa’s are much higher than the observed CEST or T2ex effects. This demonstrated the utility of using appended acidic/basic groups to catalyze prototropic exchange for imaging tissue pH by MRI.
Keywords: pH responsive MRI contrast agents, chemical exchange saturation transfer, T2ex
Table of Contents

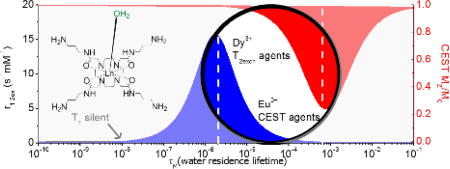
The NMR properties of lanthanide ion complexes formed with DOTA-tetraamide ligands having four pendant primary amine groups were examined by relaxometry and CEST. The CEST signal of the Eu(III) complexes increased dramatically at low pH while the impact of the Dy(III) complexes on water proton T2 values showed the opposite behaviour by increasing dramatically at high pH. The results provide new insights into the design of pH sensors for MRI.
Magnetic resonance imaging (MRI) contrast agents (CAs) are widely used in clinical medicine to enhance the contrast between normal and diseased tissues by shortening the T1 and T2 of tissue water protons. The most commonly used clinical agents are low molecular weight chelated forms of gadolinium(III) that distribute into all extracellular tissue spaces before rapid kidney excretion. Dynamic contrast enhancement (DCE) measurements during agent clearance are widely used as an index of tissue perfusion. Numerous “responsive” contrast agent designs have been reported that alter image contrast in response to changes in pH[1–4], common biological cations (Cu2+, Ca2+, Zn2+),[5–8] O2 tension,[9] temperature,[10] glucose[11] or enzyme activity[12] but none have been approved for clinical use. A new class of contrast agent based on chemical exchange saturation transfer (CEST) that uses frequency selective radio frequency pulses to initiate image contrast is rapidly gaining in popularity.[13] CEST imaging has been used to image the tissue distribution of a variety of endogenous molecules containing exchangeable –NH or –OH protons such as protein amides, glucose, glutamate, creatine, and others[14–16]. A variety of diamagnetic (diaCEST) and paramagnetic CEST (paraCEST) agents have also been reported for specific applications.[17,18]
An attractive feature of CEST is that chemical exchange of protons is a pH-dependent process. Consequently, there have been many reports of CEST agents as pH sensors. The best example is the use of the clinically approved CT agents such as Iopamidol[19,20] for mapping the pH gradient in kidneys in vivo.[3,21] Other ratiometric methods have been used to quantify amide proton CEST amplitudes to determine pH without knowing the local concentration of contrast agent.[1,20] Although this technique could potentially be applied in vivo, the background signal arising from solid-like tissue water referred to as the magnetization transfer (MT) signal can be problematical for in vivo studies.[17] paraCEST agents offer the advantage of a much wider chemical shift range over typical diaCEST agents. For example, Wang et al. reported a Tb3+-based macrocyclic complex with CEST activatable water signal at ~650 ppm, well-beyond the MT window. This complex also displayed an excellent pH response between pH 5–8 suitable for ratiometric imaging.[22] Similar Eu3+ complexes have been applied in vivo despite their lower than expected sensitivity.[1,23] Paramagnetic complexes that act as T2ex agents have also been used as responsive MRI agents.[24] Like paraCEST, the magnitude of the T2ex effect is also heavily dependent on the rate of water exchange in a paramagnetic complex but the optimal exchange rates for paraCEST (~103 s−1) and T2ex (~106 s−1) agents differ by about 3 orders of magnitude depending upon which lanthanide is used.[25–27]
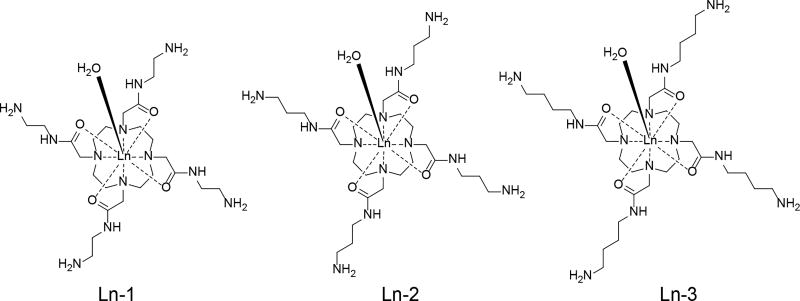
In this study, we examined the CEST and T2ex properties of Eu3+ and Dy3+ complexes of the ligands shown in Scheme 1. The ligands were designed to have primary amine groups positioned at variable distances (variable # of CH2 carbons) from the amide coordinating groups to evaluate the impact of protonation at these distant sites on the CEST and T2ex signals arising from the single exchanging lanthanide-coordinated water molecule. Although the four appended primary amine groups have pKa values well above pH 7, the CEST and T2ex signals were found to be remarkably sensitive to pH in the range 5–7.
Scheme 1.
The Ln3+-complexes studied in this work
The CEST spectra of the three Eu3+ complexes recorded at various pH values are shown in Fig. 1. A rather significant increase in CEST intensity was detected in the readily-recognized Eu3+-water exchange peak near 50 ppm as the pH was reduced from ~7 to ~4 in all three complexes. The CEST spectra of the CBZ-amine protected version of Eu-2 is also shown for comparison. The observation that the protected amine version shows a strong CEST exchange peak near 50 ppm at both pH 7.1 and 3.0 shows that the amide protons are not the origin of the pH-dependent effects seen in the CEST spectra of the non-protected amine complexes. One may conclude that the unusual CEST features of these complexes must originate with the exchanging primary amine protons on the extended side-chains. It also indicates that the bound water protons are not affected by general acid-base catalysis over this pH range since the bound water CEST signal was unaffected by pH changes between 3 and 7 in the CBZ-amine protected derivative.
Figure 1.

pH dependence of CEST spectra of the three EuDOTAM-amine complexes shown in Scheme 1 (A,B and C) plus the CBZ-amine protected version of Eu-2 (D). The CEST spectra were collected on 20 mM unbuffered samples in H2O using a 2 s pre-saturation pulse (B1 = 1000 Hz) at 298 K. The lines represent a fit of the experimental data to a 3-site exchange Bloch model.
To investigate the mechanism by which the appended amine groups alter the CEST signal from the single Eu-bound water molecule, the pKa’s of the amines in Eu-1, Eu-2 and Eu-3 were measured by PH-potentiometric titration (Table 1). These data show that the four amines on the pendant arms have pKa values well above the pH-dependent CEST effects shown in Fig. 1. The potentiometric titrations also revealed that the pKa of the bound water molecule or the amide pendant group (log KMH-1) in these complexes is also too high to have a direct impact on the CEST signal between pH 5–7. Using the pKa values reported in Table 1, one can calculate the percent deprotonation of the four primary amine groups at each pH value. This sum is shown as dark blue lines in Fig. 2 plotted along with the CEST versus pH data. The pH where the CEST signal begins to be quenched lies in the order, Eu-1 (lowest pH) < Eu-2 < Eu-3 (highest pH) which parallels the log KMH4L values in these complexes. The blue curves show that as little as 2–4% deprotonation of the amine groups results in greater than 90% quenching of the CEST signal. This demonstrates the important impact of neighboring nucleophiles on the CEST signal from a Eu-bound water molecule.
Table 1.
Protonation constants for the Eu3+ complexes formed with ligands 1–3.
| Eu-1 | Eu-2 | Eu-3 | |
|---|---|---|---|
| log KMHL | 9.22(3) | 9.78(2) | 10.68(2) |
| log KMH2L | 8.56(3) | 9.57(2) | 9.85(3) |
| log KMH3L | 8.05(3) | 9.03(2) | 9.86(2) |
| log KMH4L | 7.22(2) | 8.50(2) | 8.82(2) |
| log KMH-1 | 11.35(1) | 11.63(1) | 12.06(2) |
Figure 2.

Plots of CEST versus pH and % deprotonated amine versus pH for Eu-1, Eu-2, Eu-3. Data poiunts were connnected with guidelines.
In an attempt to obtain quantitative rate constants for these pH dependent effects, the proton exchange rates were estimated by fitting the CEST data of Fig. 1 to Bloch theory.[28] Unfortunately, kex values could only be obtained from these data below pH ~5–6 because the CEST signal is not clearly defined as a resolved peak at higher pH values. As summarized in Table S3, the average kex for all three complexes below pH 6 was 8000 to 12,000 s−1, consistent with previously published exchange rates for similar Eu-based CEST agents.[29,30] These data were further fit to a base-catalyzed exchange model described by eqn. 1 for a conjugate-base catalyzed mechanism.[31,32] Here, c is the contribution from general acid-base catalysis, kci is rate constant for conjugate-base catalysis, and [NH2] represents the total concentration of conjugate base, assumed in this case to be limited to the deprotonated forms of the four amine groups.
| [1] |
Given the reasonable assumption that conjugate-base catalysis occurs by nucleophile attack of a deprotonated amine groups on the protons of the single inner-sphere water molecule or through second-sphere water interactions, the proton exchange rates as measured by CEST (Table S4) were fit to eqn. 1 to yield values for c and kci for each complex (Table S5). The agreement between the experimental proton exchange rates (Table S4) and the rates estimated by eqn. 1 were satisfactory (Table S5) although the error in kci was large because CEST data could not be obtained at higher pH values where the second term of eqn. 1 begins to dominate the measured proton exchange rates.
The observation that the water linewidth broadens significantly in the CEST spectra of Fig. 1 at higher pH values suggests that these complexes may also act as pH-dependent T2ex exchange agents.25 This effect is greatly magnified in lanthanide complexes that produce much larger paramagnetic shifts over those shown here for the Eu3+ complexes.[27] To evaluate this further, the Dy3+ complexes of the same three ligands were prepared and the water proton T1 and T2 relaxation rates were measured as a function of pH. The r1 and r2 values shown in Fig. 3 were corrected for water proton relaxation induced by the paramagnetic Dy3+ itself by subtracting the relaxation rate (T1−1 and T2−1) of DyTETA, a complex without an exchanging water molecule,[26] at an equivalent concentration. The resulting corrected r1 values were small and essentially pH-independent while the corrected r2ex values increase dramatically above pH ~6 much like the CEST response seen for Eu-1, Eu-2, and Eu-3. Plots of T1 and T2 versus concentration are presented in Figures S1, S2 and S3. The observation that r2ex was higher at 310 K than at 298 K for all three complexes (Fig. 4) demonstrates that the proton exchange rates in these complexes fall in the slow-exchange regime side of the theoretical Swift-Connick curves (Fig. 4) similar to that observed previously for other DyDOTA-amide complexes.[26] These data show that the increase in r2ex at higher pH values (Fig. 3) reflect more rapid proton exchange, essentially paralleling the CEST profiles for the Eu3+ complexes. To quantify these effects, the T2ex data were fit to the Swift-Connick theory (eqn. 3). Here, PB is the mole fraction of each complex in solution and Δω is the chemical shift of the single metal ion-bound water molecule (assumed to be −730 ppm as reported for other DyDOTA-amide complexes of similar structure).[26]
| [3] |
Figure 3.

pH dependence of r1 and r2ex for the Dy3+ complexes measured at 400 MHz and 298 K.
Figure 4.

Swift-Connick plot for Dy 2–4 at 9.4 T using Δω value equal to −730 ppm. Red data points reflect measurements at 298 K and blue points reflect data collected at 310 K for comparison. The green circles highlight the pH 7 r2ex values at 298 K and 310 K.
Those experimental kex values were then fit to eqn. 1 to obtain c and kci for the Dy3+ complexes (Table S). A comparison of the catalytic rate constants for the Eu3+ and Dy3+ complexes shows that proton exchange is about one order of magnitude faster in the Dy3+ complexes (compare “c” values in Tables S4 and S5), consistent with earlier reports.[26] The conjugate base catalytic rate constants, kci, also appear to be larger for the Dy3+ complexes but this may reflect the larger uncertainty in kex values determined by CEST compared to T2ex.
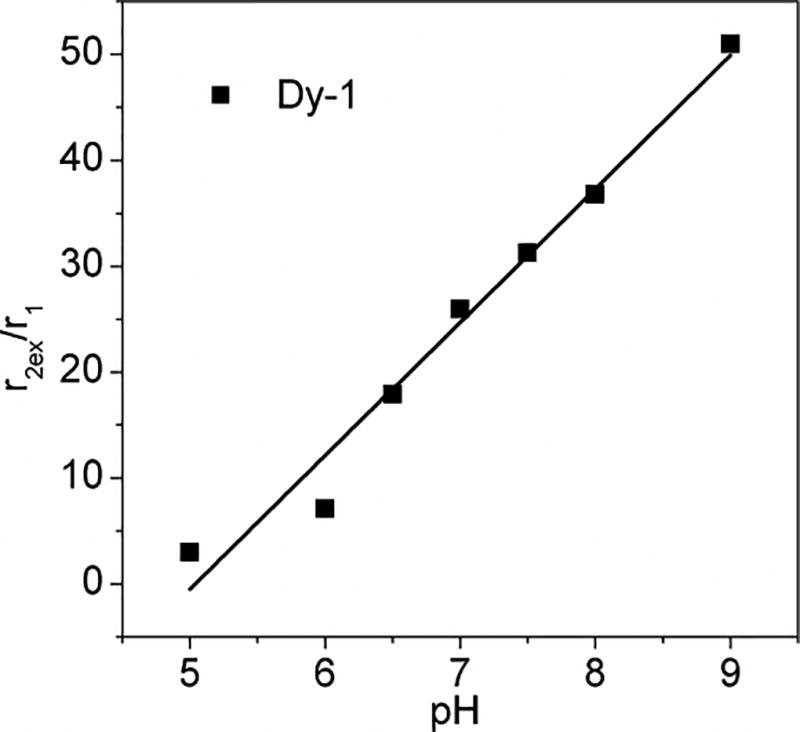
MRI maps of the extracellular pH (pHe) of solid tumors have been obtained previously using a single injection cocktail of a pH-sensitive T1 agent (Gd) plus a pH insensitive T2 agent (Dy).[33] A plot of r2ex/r1 versus pH for Dy-1 is shown in Fig. 5. The linearity of this curve makes this complex a potentially attractive sensor for imaging tissue pH using a single agent and T2/T1 tissue maps. Alternatively, a cocktail of Eu3+ and Dy3+ complexes such as these could potentially be used to map the CEST and T2ex effects simultaneously using newer types of imaging sequences such as MR fingerprinting.[34] Given that the pH response of these two types of agents is opposite, this may prove to be an advantage in delineating small differences in pH across tissue regions such as the kidney.
Figure 5.

Plot of r2ex/r1 for Dy-1 as a function of pH.
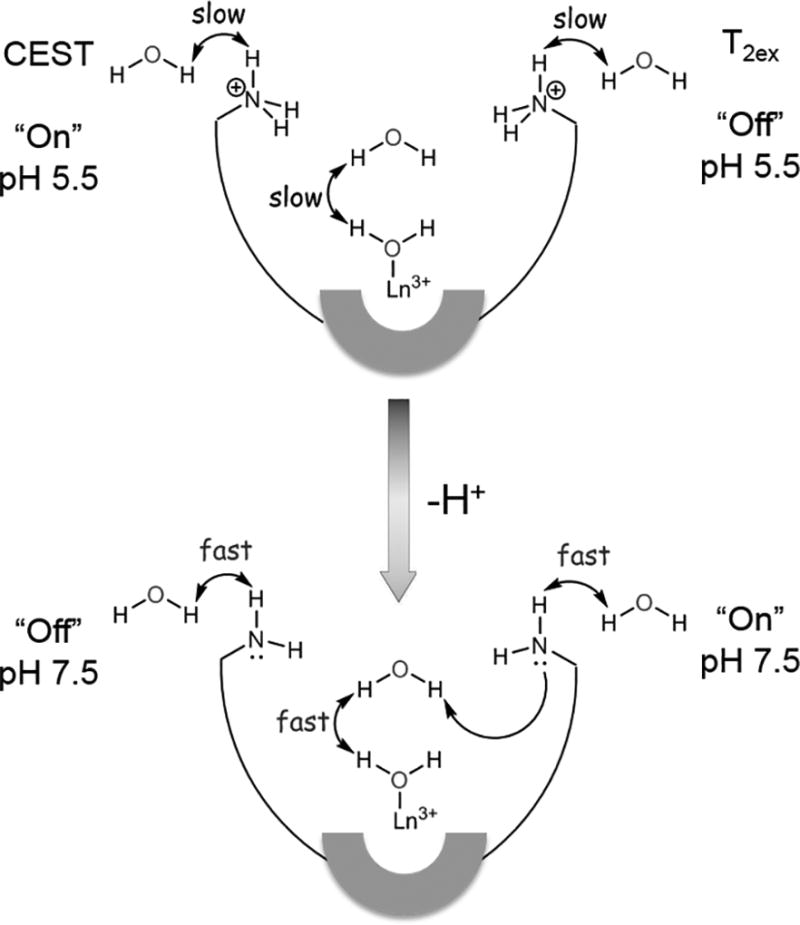
In summary, a series of Eu3+- and Dy3+-DOTA-(amide)4 complexes with four appended primary amine groups display rather unexpected pH-dependent CEST and T2ex/T1 relaxation properties. Of particular interest was the unusual off-on response that occurs between pH ~7 and pH ~4 where the CEST signal is completely silent at high pH and completely “on” at lower pH. This feature makes complexes of this type attractive as model pH indicators for detecting only acidic microenvironments such as those found in the extracellular spaces of most tumors. The analogous Dy3+ complexes show a similar trend in r2ex/r1 ratio where r2ex increases dramatically between pH 5 and 9. Although the protonation constants of the primary amine groups in these complexes are higher than the pH responsive range of these agents, only a small amount of deprotonated amine (2–4%) can act as a powerful catalyst to accelerate the proton exchange from the single Ln-bound water molecule. The schematic model shown in Fig. 6 illustrates the importance of a strong hydrogen bonding network involving the single water molecule bound to the Eu3+ or Dy3+ ion, one or perhaps two second-sphere water molecules, and the amine groups that act as conjugate base catalysts.[3,35,36] This serves as a useful model for the development of new types of responsive MRI probes that turn “on” at very specific pH values analogous to the micelle-based optical probes reported by Gao, et al.[37,38] For example, one new design might be based on tetraamide ligands having amide side-chains with variable numbers of carboxylate and amine groups in combination to allow fine-tuning of the pKa values of the amine groups. Given that appended deprotonated carboxylate groups do not catalyze proton exchange from a Eu3+-bound water molecule while protonated amine groups do not catalyze proton exchange,[39] one should be able to identify a combination of side-chain groups that turn on the CEST and T2ex signals at very specific pH values.
Figure 6.

Schematic illustration showing how appended conjugate-base amine groups can catalyze exchange of protons at a single metal ion-bound water molecule perhaps through one of more second coordination sphere water molecules.
Supplementary Material
Acknowledgments
Financial support from the National Institutes of Health (P41-EB015908, R01-DK095416, and in part by the Harold C. Simmons Cancer Center through an NCI Cancer Center Support Grant, 1P30-CA142543), and the Robert A. Welch Foundation (AT-584) is gratefully acknowledged. The research was also supported by the EU, co-financed by the European Regional Development Fund under the project GINOP-2.3.2-15-2016-00008 and the Hungarian Scientific Research Fund (OTKA K-120224 project). The Hungarian Academy of Sciences (János Bolyai Research Scholarship) is also acknowledged.
Footnotes
Supporting information for this article is given via a link at the end of the document.
References
- 1.Wu Y, Soesbe TC, Kiefer GE, Zhao P, Sherry AD. J. Am. Chem. Soc. 2010;132:14002–14003. doi: 10.1021/ja106018n. [DOI] [PMC free article] [PubMed] [Google Scholar]
- 2.Aime S, Delli Castelli D, Terreno E. Angew. Chem. Int. Ed. 2002;41:4334–4336. doi: 10.1002/1521-3773(20021115)41:22<4334::AID-ANIE4334>3.0.CO;2-1. [DOI] [PubMed] [Google Scholar]
- 3.Kálmán FK, Woods M, Caravan P, Jurek P, Spiller M, Tircsó G, Király R, Brücher E, Sherry AD. Inorg. Chem. 2007;46:5260–5270. doi: 10.1021/ic0702926. [DOI] [PMC free article] [PubMed] [Google Scholar]
- 4.Tsitovich PB, Cox JM, Spernyak JA, Morrow JR. Inorg. Chem. 2016;55:12001–12010. doi: 10.1021/acs.inorgchem.6b02159. [DOI] [PMC free article] [PubMed] [Google Scholar]
- 5.Ramos-Torres KM, Kolemen S, Chang CJ. Isr. J. Chem. 2016;56:724–737. doi: 10.1002/ijch.201600023. [DOI] [PMC free article] [PubMed] [Google Scholar]
- 6.Joseph J, Cotruvo A, Aron AT, Ramos-Torres KM, Chang CJ. Chem. Soc. Rev. 2015;44:4400–4414. doi: 10.1039/c4cs00346b. [DOI] [PMC free article] [PubMed] [Google Scholar]
- 7.Dhingra K, Fousková P, Angelovski G, Maier ME, Logothetis NK, Tóth É. JBIC J. Biol. Inorg. Chem. 2008;13:35–46. doi: 10.1007/s00775-007-0296-9. [DOI] [PMC free article] [PubMed] [Google Scholar]
- 8.Esqueda AC, López JA, Andreu-de-Riquer G, Alvarado-Monzón JC, Ratnakar J, Lubag AJM, Sherry AD, De León-Rodríguez LM. J. Am. Chem. Soc. 2009;131:11387–11391. doi: 10.1021/ja901875v. [DOI] [PMC free article] [PubMed] [Google Scholar]
- 9.Gulaka PK, Rojas-Quijano F, Kovacs Z, Mason RP, Sherry AD, Kodibagkar VD. JBIC J. Biol. Inorg. Chem. 2014;19:271–279. doi: 10.1007/s00775-013-1058-5. [DOI] [PMC free article] [PubMed] [Google Scholar]
- 10.Zhang S, Malloy CR, Sherry AD. J. Am. Chem. Soc. 2005;127:17572–17573. doi: 10.1021/ja053799t. [DOI] [PMC free article] [PubMed] [Google Scholar]
- 11.Zhang S, Trokowski R, Sherry AD. J. Am. Chem. Soc. 2003;125:15288–15289. doi: 10.1021/ja038345f. [DOI] [PubMed] [Google Scholar]
- 12.Yoo B, Pagel MD. J. Am. Chem. Soc. 2006;128:14032–14033. doi: 10.1021/ja063874f. [DOI] [PubMed] [Google Scholar]
- 13.Ward KM, Aletras AH, Balaban RS. J. Magn. Reson. 2000;143:79–87. doi: 10.1006/jmre.1999.1956. [DOI] [PubMed] [Google Scholar]
- 14.van Zijl PCM, Jones CK, Ren J, Malloy CR, Sherry AD. Proc. Natl. Acad. Sci. 2007;104:4359–4364. doi: 10.1073/pnas.0700281104. [DOI] [PMC free article] [PubMed] [Google Scholar]
- 15.Walker-Samuel S, Ramasawmy R, Torrealdea F, Rega M, Rajkumar V, Johnson SP, Richardson S, Gonçalves M, Parkes HG, Årstad E, et al. Nat. Med. 2013;19:1067–1072. doi: 10.1038/nm.3252. [DOI] [PMC free article] [PubMed] [Google Scholar]
- 16.Cai K, Haris M, Singh A, Kogan F, Greenberg JH, Hariharan H, Detre JA, Reddy R. Nat. Med. 2012;18:302–306. doi: 10.1038/nm.2615. [DOI] [PMC free article] [PubMed] [Google Scholar]
- 17.Viswanathan S, Kovacs Z, Green KN, Ratnakar SJ, Sherry AD. Chem. Rev. 2010;110:2960–3018. doi: 10.1021/cr900284a. [DOI] [PMC free article] [PubMed] [Google Scholar]
- 18.Evbuomwan OM, Terreno E, Aime S, Sherry AD. In: Chem. Mol. Imaging. Long N, Wong W-T, editors. John Wiley & Sons, Inc; 2014. pp. 225–243. [Google Scholar]
- 19.Longo DL, Dastrù W, Digilio G, Keupp J, Langereis S, Lanzardo S, Prestigio S, Steinbach O, Terreno E, Uggeri F, et al. Magn. Reson. Med. 2011;65:202–211. doi: 10.1002/mrm.22608. [DOI] [PubMed] [Google Scholar]
- 20.Longo DL, Sun PZ, Consolino L, Michelotti FC, Uggeri F, Aime S. J. Am. Chem. Soc. 2014;136:14333–14336. doi: 10.1021/ja5059313. [DOI] [PMC free article] [PubMed] [Google Scholar]
- 21.Garcia-Martin ML, Martinez GV, Raghunand N, Sherry AD, Zhang S, Gillies RJ. Magn. Reson. Med. 2006;55:309–315. doi: 10.1002/mrm.20773. [DOI] [PubMed] [Google Scholar]
- 22.Wang X, Wu Y, Soesbe TC, Yu J, Zhao P, Kiefer GE, Sherry AD. Angew. Chem. Int. Ed. 2015;54:8662–8664. doi: 10.1002/anie.201502497. [DOI] [PMC free article] [PubMed] [Google Scholar]
- 23.Wu Y, Zhang S, Soesbe TC, Yu J, Vinogradov E, Lenkinski RE, Sherry AD. Magn. Reson. Med. 2015 doi: 10.1002/mrm.25844. n/a-n/a. [DOI] [PMC free article] [PubMed] [Google Scholar]
- 24.Daryaei I, Randtke EA, Pagel MD. Magn. Reson. Med. 2017;77:1665–1670. doi: 10.1002/mrm.26250. [DOI] [PMC free article] [PubMed] [Google Scholar]
- 25.Soesbe TC, Merritt ME, Green KN, Rojas-Quijano FA, Sherry AD. Magn. Reson. Med. 2011;66:1697–1703. doi: 10.1002/mrm.22938. [DOI] [PMC free article] [PubMed] [Google Scholar]
- 26.Soesbe TC, Ratnakar SJ, Milne M, Zhang S, Do QN, Kovacs Z, Sherry AD. Magn. Reson. Med. 2014;71:1179–1185. doi: 10.1002/mrm.25091. [DOI] [PMC free article] [PubMed] [Google Scholar]
- 27.Sherry AD, Wu Y. Curr. Opin. Chem. Biol. 2013;17:167–174. doi: 10.1016/j.cbpa.2012.12.012. [DOI] [PMC free article] [PubMed] [Google Scholar]
- 28.Woessner DE, Zhang S, Merritt ME, Sherry AD. Magn. Reson. Med. 2005;53:790–799. doi: 10.1002/mrm.20408. [DOI] [PubMed] [Google Scholar]
- 29.Mani T, Tircsó G, Togao O, Zhao P, Soesbe TC, Takahashi M, Sherry AD. Contrast Media Mol. Imaging. 2009;4:183–191. doi: 10.1002/cmmi.279. [DOI] [PMC free article] [PubMed] [Google Scholar]
- 30.Fernando WS, Martins AF, Zhao P, Wu Y, Kiefer GE, Platas-Iglesias C, Sherry AD. Inorg. Chem. 2016;55:3007–3014. doi: 10.1021/acs.inorgchem.5b02850. [DOI] [PubMed] [Google Scholar]
- 31.Liepinsh E, Otting G. Magn. Reson. Med. 1996;35:30–42. doi: 10.1002/mrm.1910350106. [DOI] [PubMed] [Google Scholar]
- 32.Mori S, Abeygunawardana C, Berg JM, van Zijl PCM. J. Am. Chem. Soc. 1997;119:6844–6852. [Google Scholar]
- 33.Martinez GV, Zhang X, García-Martín ML, Morse DL, Woods M, Sherry AD, Gillies RJ. NMR Biomed. 2011;24:1380–1391. doi: 10.1002/nbm.1701. [DOI] [PMC free article] [PubMed] [Google Scholar]
- 34.Anderson CE, Donnola SB, Jiang Y, Batesole J, Darrah R, Drumm ML, Brady-Kalnay SM, Steinmetz NF, Yu X, Griswold MA, et al. Sci. Rep. 2017;7:8431. doi: 10.1038/s41598-017-08762-9. [DOI] [PMC free article] [PubMed] [Google Scholar]
- 35.Aime S, Botta M, Fasano M, Terreno E. Acc. Chem. Res. 1999;32:941–949. [Google Scholar]
- 36.Woods M, Pasha A, Zhao P, Tircso G, Chowdhury S, Kiefer G, Woessner DE, Sherry AD. Dalton Trans. Camb. Engl. 2003. 2011;40:6759–6764. doi: 10.1039/c1dt10616c. [DOI] [PMC free article] [PubMed] [Google Scholar]
- 37.Wang Y, Zhou K, Huang G, Hensley C, Huang X, Ma X, Zhao T, Sumer BD, DeBerardinis RJ, Gao J. Nat. Mater. 2014;13:204–212. doi: 10.1038/nmat3819. [DOI] [PMC free article] [PubMed] [Google Scholar]
- 38.Zhou K, Wang Y, Huang X, Luby-Phelps K, Sumer BD, Gao J. Angew. Chem. Int. Ed. 2011;50:6109–6114. doi: 10.1002/anie.201100884. [DOI] [PMC free article] [PubMed] [Google Scholar]
- 39.Zhang L, Evbuomwan OM, Tieu M, Zhao P, Martins AF, Sherry AD. Philos. Trans. A. 2017;375 doi: 10.1098/rsta.2017.0113. [DOI] [PMC free article] [PubMed] [Google Scholar]
Associated Data
This section collects any data citations, data availability statements, or supplementary materials included in this article.


