

Abstract
The chemical link between isoprene and formaldehyde (HCHO) is a strong, non-linear function of NOx (= NO + NO2). This relationship is a linchpin for top-down isoprene emission inventory verification from orbital HCHO column observations. It is also a benchmark for overall photochemical mechanism performance with regard to VOC oxidation. Using a comprehensive suite of airborne in situ observations over the Southeast U.S., we quantify HCHO production across the urban-rural spectrum. Analysis of isoprene and its major first-generation oxidation products allows us to define both a “prompt” yield of HCHO (molecules of HCHO produced per molecule of freshly-emitted isoprene) and the background HCHO mixing ratio (from oxidation of longer-lived hydrocarbons). Over the range of observed NOx values (roughly 0.1 – 2 ppbv), the prompt yield increases by a factor of 3 (from 0.3 to 0.9 ppbv ppbv−1), while background HCHO increases by a factor of 2 (from 1.6 to 3.3 ppbv). We apply the same method to evaluate the performance of both a global chemical transport model (AM3) and a measurement-constrained 0-D steady state box model. Both models reproduce the NOx dependence of the prompt HCHO yield, illustrating that models with updated isoprene oxidation mechanisms can adequately capture the link between HCHO and recent isoprene emissions. On the other hand, both models under-estimate background HCHO mixing ratios, suggesting missing HCHO precursors, inadequate representation of later-generation isoprene degradation and/or under-estimated hydroxyl radical concentrations. Detailed process rates from the box model simulation demonstrate a 3-fold increase in HCHO production across the range of observed NOx values, driven by a 100% increase in OH and a 40% increase in branching of organic peroxy radical reactions to produce HCHO.
1 Introduction
Formaldehyde (HCHO) is a ubiquitous byproduct of volatile organic compound (VOC) oxidation. While methane is the principal HCHO precursor in remote regions, larger VOC are the main source over continents. HCHO is also directly emitted via biomass burning (Lee et al., 1997), fossil fuel combustion (Luecken et al., 2012), natural gas flaring (Knighton et al., 2012), ethanol refining (de Gouw et al., 2015), possibly vegetation (DiGangi et al., 2011) and agricultural activity (Kaiser et al., 2015a), but chemical production dominates the global budget (Fortems-Cheiney et al., 2012). Photolysis and reaction with OH destroy HCHO with a characteristic lifetime of several hours during midday, implying that the HCHO abundance reflects recent VOC oxidation.
Globally, isoprene is the main precursor of near-surface HCHO. A highly reactive diene emitted by vegetation, isoprene comprises roughly one third of all non-methane VOC emissions (Guenther et al., 2012). Oxidation of isoprene in the presence of nitrogen oxides (NOx = NO + NO2) stimulates the production of ozone (Trainer et al., 1987) and organic aerosol precursors (Xu et al., 2015), impacting air quality and climate in many continental regions. Biogenic emission inventories struggle to accurately represent the spatiotemporal variability of isoprene emissions, with model-measurement discrepancies and differences among emission inventories approaching a factor of 2 or more (Carlton and Baker, 2011; Warneke et al., 2010). Such differences directly impact predicted ozone and aerosol distributions (Hogrefe et al., 2011).
Numerous studies have applied satellite-based HCHO column observations as a top-down constraint on isoprene emissions (see Kefauver et al. (2014) for a review). Typically, a chemical transport model is employed both to supply a priori HCHO vertical distributions for satellite retrievals (González Abad et al., 2015) and to relate HCHO column concentrations to isoprene emission strength. Early studies utilized linear steady-state relationships (Palmer et al., 2003), while recent computational advances have permitted full inversions that more fully account for transport, multiple sources and varying chemical regimes (Fortems-Cheiney et al., 2012). Such techniques have informed isoprene emission inventories in North America (Abbot et al., 2003; Millet et al., 2008; Millet et al., 2006; Palmer et al., 2006; Palmer et al., 2003), South America (Barkley et al., 2013; Barkley et al., 2008), Europe (Curci et al., 2010; Dufour et al., 2009), Africa (Marais et al., 2012), Asia (Fu et al., 2007; Stavrakou et al., 2014), and globally (Fortems-Cheiney et al., 2012; Shim et al., 2005; Stavrakou et al., 2009). Future geostationary observations, such as the NASA Tropospheric Emissions: Monitoring of Pollution (TEMPO, http://science.nasa.gov/missions/tempo/) mission, will permit an even more detailed investigation of the spatial and temporal variability of isoprene emissions and other VOC sources.
Chemistry dictates the relationship between HCHO columns and underlying isoprene emissions. Many of the above-listed studies apply 0-D box model calculations to evaluate the yield of HCHO from isoprene as a function of oxidation time, NOx regime and chemical mechanism. In all cases, it is found that NOx enhances both the production rate and ultimate yield of HCHO. Slower production at lower NOx can lead to “smearing,” whereby HCHO production is displaced relative to the isoprene source. Palmer et al. (2003) define a characteristic smearing length scale, which can range from 10 to 100 km or more. Furthermore, accumulation of oxygenated VOC over multiple generations of isoprene degradation can contribute to substantial background HCHO production, which is not directly linked with fresh isoprene emissions. Long-lived primary anthropogenic or biogenic emissions, like methane and methanol, can also contribute to this background. Background column concentrations are typically on the order of 5 × 1015 cm−2, equal to 20% or more of the isoprene-driven HCHO column enhancement (Barkley et al., 2013; Millet et al., 2006). A wave of recent theoretical (Peeters et al., 2014; Peeters and Müller, 2010; Peeters et al., 1999), laboratory (Crounse et al., 2012; Crounse et al., 2011; Paulot et al., 2009a; Paulot et al., 2009b) and field (Mao et al., 2012) research has highlighted shortcomings in low-NOx isoprene oxidation schemes. Such issues translate directly into top-down emission estimates; for example, Marais et al. (2012) report an uncertainty of 40% in satellite-derived African isoprene emissions at high-NOx and 40–90% at low-NOx. Coarse resolution of averaged satellite observations and model simulations (typically 1° × 1° or more) has partly mitigated these problems in prior work, as variability in NOx-dependent smearing and background production is averaged out. A more careful treatment will be needed to harness the enhanced resolution of near-future orbital observations (e.g., 8 × 4.5 km2 for TEMPO), especially since these measurements will include diurnal variability.
Here, we use a comprehensive set of in situ observations to quantify the impact of NOx on the isoprene-HCHO chemical link. Using isoprene and its unique first-generation products, we segregate HCHO into two categories. The first, defined as “prompt” HCHO, is produced from fresh isoprene emissions (on a timescale of less than a day) and retains the signature of isoprene emission source strength. The second category is “background” HCHO stemming from oxidation of longer-lived isoprene oxidation products and other VOC. We examine the NOx dependence of both quantities. Applying the same method to 0-D and global model simulations, we evaluate the ability of current chemical mechanisms to replicate the observed trends. Box model results are also used to elucidate the mechanistic underpinnings of the NOx influence on HCHO production.
2 SENEX Observations
The Southeast Nexus (SENEX) mission was an airborne campaign designed to examine the interaction of natural and anthropogenic emissions (Warneke et al., 2016). During June and July of 2013, the NOAA WP-3D aircraft logged about 120 flight hours over 20 research flights in a range of environments throughout the Southeast United States, including urban centers, power plant plumes, natural gas extraction regions, agricultural areas and forests. The payload included a suite of gas- and particle-phase instrumentation. Here we utilize observations of HCHO, isoprene, methyl vinyl ketone (MVK), methacrolein (MACR), NO and NO2. HCHO was measured at 1 Hz by the NASA In Situ Airborne Formaldehyde (ISAF) instrument, which utilizes the laser-induced fluorescence technique and has an accuracy of ±10% (Cazorla et al., 2015). Isoprene, MVK and MACR were measured by both a quadrupole proton transfer reaction mass spectrometer (PTR-MS) and the NOAA improved whole-air sampler (iWAS) with offline gas chromatography. The PTR-MS (de Gouw and Warneke, 2007) has a stated accuracy of 20% and sequentially sampled masses for isoprene (m/z +69) and the sum of MVK and MACR (m/z +71) for 1 s each with a duty cycle of 14 s. The iWAS (Lerner et al., 2016) collected 72 canister samples each flight, which were analyzed offline with gas chromatography – mass spectrometry 3–4 days post-flight. iWAS measurement uncertainty is 20% for speciated MVK and MACR and 27% for isoprene. NO and NO2 were measured at 1 Hz via chemiluminescence coupled with a photolytic NO2 converter (Pollack et al., 2010; Ryerson et al., 1999) with an accuracy of 5%. Data are filtered to include only daytime boundary layer conditions (solar zenith angle < 60°, radar altitude < 1 km). Influence from biomass burning (acetonitrile > 210 pptv and CO > 300 ppbv) is also removed. This procedure, along with the disjunct nature of the PTR-MS measurement, excludes 50% of all fast (1 Hz) data. After accounting for data gaps, we retain 8435 1 Hz data points and 81 iWAS samples.
Measurements of MVK and MACR may include a positive bias from conversion of isoprene hydroxyhydroperoxides (ISOPOOH) on hot metal surfaces in the sampling system (Liu et al., 2013; Rivera-Rios et al., 2014). ISOPOOH mixing ratios up to 2 ppbv were observed by the University of Washington Iodide high-resolution time-of-flight chemical ionization mass spectrometer during SENEX. Neither the NOAA PTR-MS nor the iWAS have been tested for this interference with an ISOPOOH standard, thus we cannot definitively rule out such artifacts or develop a correction factor. To our knowledge, it is not yet clear how the putative interference depends on instrument configuration (flow rates, electric fields, etc.). Thus, caution is warranted when comparing the SENEX systems to similar, but not identical, instruments. Theoretically, this mechanism could give rise to an analogous artifact in HCHO observations. Recent laboratory tests, however, indicate that the ISOPOOH-to-HCHO conversion efficiency in ISAF is less than 5% (St. Clair et al., 2016).
We cannot unambiguously quantify the ISOPOOH artifact using observations alone, but we can gain some insight from comparing PTR-MS and iWAS data. On average, iWAS observations of MVK+MACR are ~40% higher than those from the PTR-MS (Figs. S1 and S2), suggesting a systematic bias in one or both measurements. Both instruments were calibrated using the same gas standards, and the two techniques agree well for other species such as isoprene (Lerner et al., 2016; Warneke et al., 2016), so a calibration error is unlikely. Production of oxygenated VOC in ambient air samples collected and aged in stainless steel canisters cannot be ruled out. Enhancements in MVK and MACR (above the 20% uncertainty) have been observed in canisters after aging over ~11 days (Lerner et al., 2016), though this is significantly longer than typical turn-around times for SENEX. To evaluate the potential for ISOPOOH conversion to explain this discrepancy, we plot the ratio and difference of the PTR-MS and iWAS measurements as a function of ISOPOOH in Fig. S2. While the ratio is essentially constant (iWAS/PTR-MS ~1.43), the absolute difference exhibits a strong positive correlation with ISOPOOH (r2 = 0.43). The slope of this relationship implies that a conversion of 50% of ISOPOOH to MVK and/or MACR in the iWAS system would explain the difference in the two measurements. Correcting total iWAS MVK+MACR for such an artifact reduces the slope of the iWAS-PTR-MS correlation from 1.48 to 1.24 (Fig. S1B), bringing agreement to well with combined measurement uncertainties. In practice, we cannot apply such a correction to the speciated iWAS observations as the conversion efficiency may be different for each isomer. This result does not exclude the possibility of an artifact in the PTR-MS measurement, though it does suggest an upper limit ISOPOOH conversion efficiency of 50% for the PTR-MS (which would imply a conversion of 100% for the iWAS). The analysis presented in Sections 3 and 4 primarily relies on PTR-MS data due to its greater temporal coverage. Our key conclusions are not impacted by a 50% ISOPOOH correction to the PTR-MS data, thus we use the data without correction.
SENEX sampled a wide spectrum of chemical regimes (Figure 1). For the daytime boundary-layer observations presented here, maximum 1 Hz isoprene and NO mixing ratios respectively reach 8.1 and 95 ppbv, while minima are less than a few pptv. The distributions of both isoprene and NO observations are approximately log-normal (top and right panels of Fig. 1), peaking at 1.5 ppbv and 50 pptv, respectively. Though these distributions may be biased towards areas of urban influence, the range of environments encountered during SENEX is representative of the Southeast U.S. summertime boundary layer. The long tail at the low end of the isoprene distribution is mostly associated with regions lacking significant tree cover where isoprene emissions are lower, notably Illinois and Indiana. The NO distribution spans four orders of magnitude (< 10 to ~104 pptv), over which radical chemistry changes markedly. At NO mixing ratios of a few hundred pptv or more, organic peroxy radicals (RO2) react mostly with NO. At low NO (10’s of pptv or less), reaction with HO2, other RO2 and isomerization dominate the RO2 fate. The bulk of the NO distribution lies in a transition region for radical chemistry, making this dataset ideal for probing the anthropogenic influence on biogenic VOC oxidation.
Figure 1.
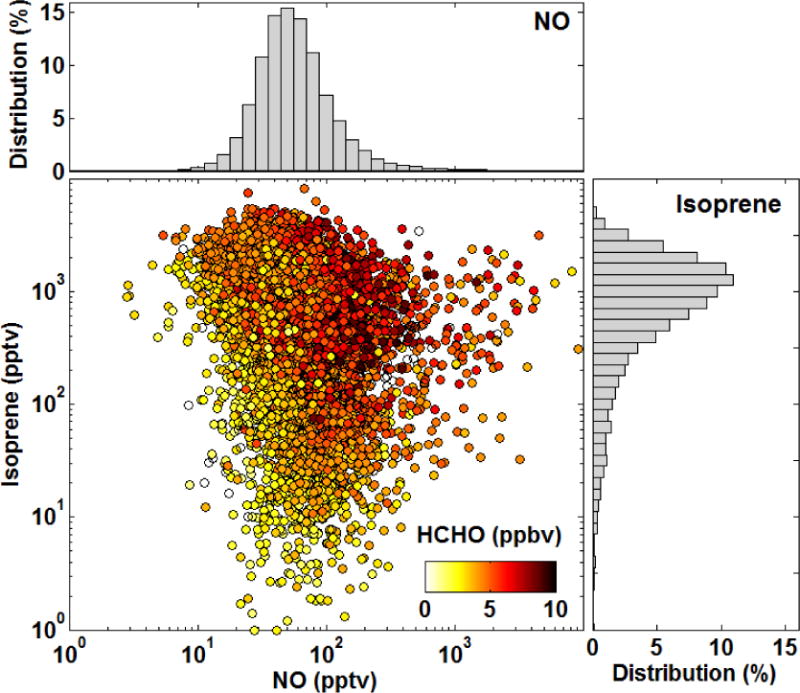
Co-variation of isoprene, NO and HCHO mixing ratios in the summertime Southeast U.S. Data are limited to daytime boundary layer observations. Histograms show the corresponding NO and isoprene distributions.
HCHO mixing ratios (color shading in Fig. 1) range from 0.8 to 14 ppbv with a mean of 4.3 ppbv. HCHO is most abundant in regions where both isoprene and NOx are elevated. High NOx is often accompanied by increased concentrations of anthropogenic VOC; however, constrained box-model calculations demonstrate that isoprene is the dominant HCHO precursor even in these cases (Sect. 5). Thus, changes in radical cycling and partitioning (and not co-variance of NOx and anthropogenic VOC) drives the observed NOx dependence of HCHO abundance.
3 Linking Observed and Emitted Isoprene
The isoprene photochemical cascade is a multi-step process. Isoprene oxidation is initiated via reaction with the hydroxyl radical (OH), ozone, or the nitrate radical (NO3). In the Southeast U.S., typical daytime levels for OH, ozone and NO3 are 4 × 106 cm−3, 50 ppbv and 0.1 pptv, respectively (OH and NO3 are estimated from median box model output, see Sect. 5). The corresponding isoprene lifetimes at 298K are 0.7 h, 17 h and 160 h, respectively. Thus, reaction with OH typically constitutes 95% or more of the total daytime isoprene sink in this environment. Addition of OH and reaction with O2 generates one of several isoprene hydroxyperoxy radicals (ISOPO2). ISOPO2 isomers interconvert rapidly due to reversible O2 addition (Peeters et al., 2009) but are eventually destroyed via reaction with NO, hydroperoxy radical (HO2), other organic peroxy radicals (RO2) or isomerization. Most branches have the potential to produce HCHO, with varying yields. The laboratory-derived first-generation HCHO yield from the NO pathway is ~0.6 (Atkinson and Arey, 2003), though this value may be less representative of the real atmosphere due to the very high isoprene concentrations (and very short RO2 lifetimes) in early chamber experiments. The first-generation yield from the HO2 pathway is ~0.06 (Liu et al., 2013). Isomerization chemistry is less well understood; the 1,5-H-shift is believed to produce HCHO with a unity yield, while the much faster 1,6-H-shift should not produce any HCHO (da Silva et al., 2010; Fuchs et al., 2013; Peeters et al., 2014; Peeters and Müller, 2010; Peeters et al., 2009). Regardless of the specific pathway, MVK or MACR are always co-produced with HCHO in the first generation. HCHO is also generated in subsequent chemistry, but on a longer timescale and from a much larger suite of precursors. For example, the OH lifetimes of MACR and MVK are respectively 3.5 and 5 times longer than that of isoprene. HCHO, MVK and MACR are also high-yield products of isoprene ozonolysis (Atkinson and Arey, 2003), but as noted above this reaction is relatively slow. Nighttime oxidation of isoprene by NO3 radical is also likely a negligible source of these carbonyls (Brown et al., 2009). Yields are small (Atkinson and Arey, 2003; Kwok et al., 1996), and the lifetimes of MVK, MACR and HCHO are sufficiently short that any nighttime production should not influence the midday observations considered here.
Boundary layer composition reflects a mixture of emissions with various degrees of photochemical processing. To isolate the impact of “fresh” isoprene emissions, we exploit the relatively simple chemistry of MVK and MACR, which are produced via isoprene (ISOP) oxidation and lost primarily via reaction with OH.
| (R1) |
| (R2) |
| (R3) |
Rate constants (k) are taken from the IUPAC database (Atkinson et al., 2006). These reactions form the basis for a photochemical clock of isoprene oxidation (de Gouw et al., 2005; Roberts et al., 2006; Stroud et al., 2001). Integration of the kinetic equations for this system shows that the product/parent ratios are a function of the rate constants, yield (y), reaction time (t) and mean OH concentration. In the case of MACR, for example:
| (1) |
An analogous expression holds for MVK. As noted by Stroud et al. (2001), this “sequential reaction model” is purely chemical and does not account for the effects of mixing and transport. Indeed, this analysis relates daughter/parent ratios to an “average” photochemical age, when in fact there is a broad distribution of ages in any mixed air mass. We also implicitly assume that direct emissions (Fares et al., 2015) and deposition (Karl et al., 2010) of MVK and MACR do not significantly influence the budget of these compounds.
Two potential issues arise when applying this model to the real atmosphere. First, the yields of MVK and MACR are dependent on ISOPO2 branching and are thus a non-linear function of NOx. Previous applications of this method (de Gouw et al., 2005; Roberts et al., 2006; Stroud et al., 2001) have assumed lab-derived high-NOx yields of 0.33 and 0.23 for MVK and MACR, respectively (Atkinson and Arey, 2003), but this may not be appropriate in the present case; furthermore, these yields are not fully consistent with current chemical mechanisms. Given the wide range of conditions sampled, we explicitly account for NOx-dependent yields for MVK and MACR. For this purpose, we conducted a series of pseudo-chamber simulations using a box model driven by the Master Chemical Mechanism (MCM) v3.3.1 (Jenkin et al., 2015). As described in the SI, model setup mimics typical daytime conditions in the Southeast U.S. (Fig. S3B), and yields are derived using a standard procedure. Resulting yield curves (Fig. S3A) are then interpolated to observed NO mixing ratios. Second, the photochemical age (t) implied by any observed daughter/parent ratio depends on the concentration of OH, which was not measured and varies as an air mass ages. Rather than assume a single “typical” value for OH, we express photochemical age in terms of “exposure,” defined here as the product of OH concentration and reaction time averaged over the photochemical lifetime of an air mass.
Figure 2 compares the observed relationship of iWAS MVK/isoprene and MACR/isoprene ratios against theoretical trends predicted by the sequential reaction model. Theoretical ratios are calculated at fixed exposures of 2, 4, 8, 12 and 16 × 106 OH cm−3 h using model derived yields for the 5th/95th percentiles of the observed NO distribution (NO = 20/200 pptv, yMVK = 0.18/0.38, yMACR = 0.11/0.20). Observed ratios of MVK/isoprene versus MACR/isoprene exhibit a tight linear correlation. Higher ratios are often associated with higher NOx, likely reflecting enhanced OH and higher product yields in these air masses. Far downwind from isoprene and NOx source regions, we would expect to see higher MVK/isoprene and MACR/isoprene ratios associated with lower NOx due to removal of the latter. The theoretical slope agrees well with observations, indicating exposures of 1 – 16 × 106 OH cm−3 h. For a typical daytime OH concentration of 4 × 106 cm−3, this corresponds to processing times of 0.25 – 4 hours.
Figure 2.
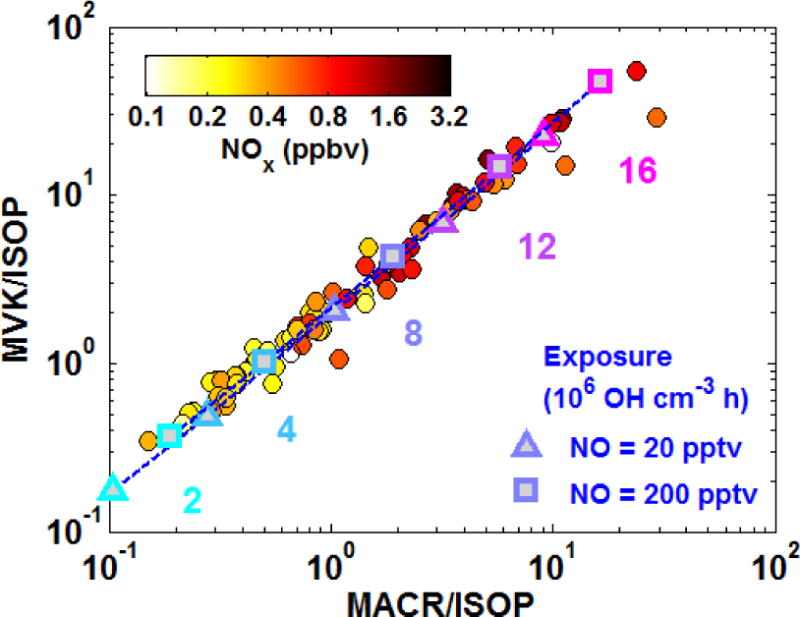
A photochemical clock of isoprene oxidation defined by the progression of daughter/parent ratios. Solid circles show the observed ratios calculated from iWAS observations, colored by NOx. Blue/purple symbols, dashed lines, and text indicate the theoretical exposures (the product of OH concentration and time) corresponding to any given daughter/parent relationship. Theoretical values are calculated at 298K using MVK and MACR yields for NO values of 20 pptv (triangles) and 200 pptv (squares).
The assumed MVK and MACR yields dictate the correspondence between daughter/parent ratios and exposure. For example, a MACR/isoprene ratio of 1 would be consistent with an exposure of 7.9 × 10⁶ OH cm−3 h at NO = 20 pptv versus 6.0 × 10⁶ OH cm−3 h at NO = 200 pptv. Thus, for any given daughter/parent ratio, a higher assumed yield gives a smaller derived exposure. The ratio of yMVK to yMACR determines the location of the theoretical line, and the excellent agreement of this relationship with observations in Fig. 2 indicates that MCMv3.3.1 accurately represents the branching ratios for MVK and MACR production within the sampled NOx range.
We can effectively reverse this photochemical clock to derive a proxy for the total isoprene emissions that have been released into the sample air masses (de Gouw et al., 2005). First, we calculate OH exposures from observed daughter/parent ratios by inverting Eqn. (1). To perform this calculation with PTR-MS data (which has far greater coverage than the iWAS), we partition the measured sum between MVK and MACR using MVK/MACR ratios from steady-state box model calculations (Sect. 5). Modeled MVK/MACR ratios (with an output interval of 1 minute) are linearly interpolated to the 14-second observational time base. The MVK/MACR ratio does not vary dramatically (mean ± 1σ: 2.3 ± 0.2), and using a constant ratio instead alters exposures by less than 4%. Calculated exposures range from 1 to 20 × 106 OH cm−3 h (Fig. S4A). Exposures derived from MACR are 6% lower than those from MVK on average, and we use the mean of these two values. Next, an “initial” isoprene mixing ratio, ISOP0, is estimated via reverse integration of isoprene’s first-order loss rate:
| (2) |
ISOP0 represents the amount of isoprene that an air parcel would have to start with to generate the amount of isoprene, MVK and MACR observed. Thus, it is an observationally-constrained surrogate for isoprene emission strength (modulated to some degree by boundary layer height, as it is a volume-based quantity). ISOP0 mixing ratios are typically 2 – 20 times higher than observed isoprene (Fig. S4B).
4 The Yield of HCHO from Isoprene
The definition of “yield” can vary with context and requires careful consideration when quantifying chemical relationships. In a mechanistic sense, the “first generation yield” refers to the amount of HCHO produced per unit isoprene consumed in the first stage of oxidation. This is analogous to the yields of MVK and MACR used in the above calculation of initial isoprene. The model-derived first-generation HCHO yield from isoprene varies by more than a factor of 2 over the range of chemical environments encountered during SENEX (Fig. S3). An alternative definition is that of the “total yield” (sometimes referred to as the “molar yield,” e.g. Millet et al. (2006)), a time-dependent quantity that describes the total amount of HCHO produced over multiple generations of oxidation. The total yield is typically derived from model simulations and used to relate satellite HCHO column observations to isoprene emissions (Marais et al., 2012; Millet et al., 2006). Early studies acknowledged the NOx dependence of the total yield (Millet et al., 2006; Palmer et al., 2003), and more recent work has attempted to account for this dependence using NO2 column observations (Marais et al., 2012). Here, we define the “prompt yield” as the change in observed HCHO per unit change in ISOP0 (ΔHCHO/ΔISOP0). This is not the same as the first-generation yield, since the prompt yield can include HCHO production and loss over several hours (depending on the photochemical exposure of an air mass). Nor is it the same as the total yield, which inherently does not account for HCHO loss as an air mass ages. The prompt yield is effectively a quantity that relates isoprene emission strength to observed HCHO abundance. As we will demonstrate, this quantity is well-suited for segregating the various drivers of HCHO and for benchmarking model performance.
Figure 3A shows the relationship between calculated ISOP0 and observed HCHO. The overall correlation is linear with a striking NOx gradient. To quantify this NOx dependence, we sort the data by log(NOx), group it into 20 bins such that each bin contains the same number of points (N = 416), and perform a major-axis linear fit of HCHO versus ISOP0 for each bin. Individual fits give r2 values of 0.6–0.8, except for the highest NOx bin (r2 = 0.48) that contains some heavily-polluted air masses, such as downwind from power plants. Very fresh power plant plumes, defined as log(NOx) values exceeding a mean + 3σ threshold, are removed prior to this procedure to avoid skewing the highest NOx bin. Results are independent of the number of bins chosen or time resolution (e.g., 1-second versus 1-minute data).
Figure 3.
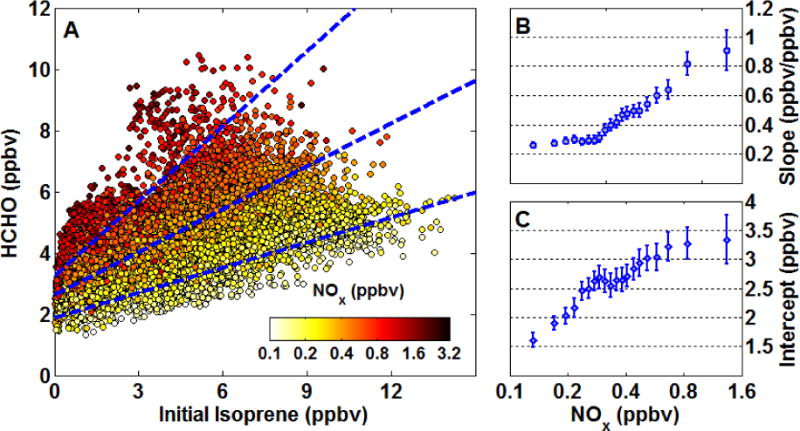
(A) NOx modulates the relationship between observed HCHO and calculated initial isoprene mixing ratios. Symbols denote all 1-second data. Dashed lines illustrate representative major-axis fits of NOx-grouped subsets at mean NOx values of 170, 380 and 810 pptv (see text for details of fitting procedure). The slope (B) and intercept (C) of these fits are the prompt HCHO yield and background HCHO mixing ratio, respectively. Error bars in (B) and (C) are 3σ fitting uncertainties.
The HCHO-ISOP0 slope (Fig. 3B) represents the prompt yield. This yield varies by a factor of 3 over the range of observed NOx, from 0.3 ppbv ppbv−1 for NOx mixing ratios of a few hundred pptv to 0.9 ppbv ppbv−1 at NOx > 1 ppbv. At low NOx, the prompt yield is comparable to the MCM-predicted direct first-generation yield of HCHO (0.25–0.4 ppbv ppbv−1 at NO = 10–40 pptv, Fig. S3), while at high NOx it is somewhat higher than the predicted first-generation yield (0.75 ppbv ppbv−1 at NO = 1000 pptv). This likely reflects the inclusion of more than one generation of HCHO production at higher NOx, where oxidation is more rapid (median exposures increase by 38% over the range of observed NOx values). Most of this portion of the HCHO budget, however, stems from first-generation production.
The intercept (Fig. 3C) represents the abundance of “background” HCHO. This portion of the HCHO budget stems mainly from air that either has not encountered strong isoprene emissions or is so aged that most of the isoprene has reacted away and can no longer be linked to a specific source region. Some of this background may also stem from oxidation of long-lived primary emissions like methane or methanol. Box model calculations (Sect. 5) indicate average HCHO budget contributions of 0.3 ± 0.2 ppbv and 0.2 ± 0.1 ppbv from methane and methanol, respectively. Background HCHO also exhibits a marked NOx dependence, increasing from 1.6 to 3.3 ppbv over the observed NOx range. As with the prompt yield, we expect such behavior since NOx regulates the fate of all organic peroxy radicals (see Sect. 6). Assuming a 1 km mixed layer depth (Wagner et al., 2015), the corresponding HCHO column density for this background is 4 – 8 × 1015 cm−2. This is comparable to the background reported by previous investigations of satellite-derived HCHO columns (Barkley et al., 2013; Millet et al., 2006). None of these studies explicitly account for the NOx dependence of the background, though it can represent a substantial fraction of the total HCHO column – maximum summertime HCHO columns over the southeast U.S. are ~25 × 1015 cm−2 (Millet et al., 2008). Given the strong NOx dependence of both prompt and background HCHO, grouping HCHO column observations by NOx (e.g. using simultaneous observations of NO2 columns (Marais et al., 2012) or model-derived NOx) and performing an analysis similar to that described here could provide a robust means of accounting for these influences.
5 Model Evaluation
Next, we compare the observed HCHO-ISOP0 relationship to results from a global chemical-transport model and a 0-D box model. Our goals are to both illustrate the utility of this analysis and evaluate model performance. By going beyond a simple comparison of modeled and measured mixing ratios, we can more accurately pinpoint potential shortcomings in model chemistry.
The GFDL AM3 model is an atmospheric general circulation model with interactive chemistry (Donner et al., 2011), including recent updates to the representation of isoprene degradation (Mao et al., 2013; Naik et al., 2013). Model simulations were carried out at 50 × 50 km2 resolution with horizontal winds nudged to NCEP GFS analyses and sampled along the SENEX flight tracks at a time resolution of 1 minute. Further details are available elsewhere (Li et al., 2016).
The University of Washington Chemical Box Model (UWCM v2.2) is a versatile 0-dimensional framework for simulating various chemical systems, including lab chamber experiments (Wolfe et al., 2012) and observations from ground (Kim et al., 2015; Kim et al., 2013; Wolfe et al., 2014) and airborne (Marvin et al., 2015) platforms. Multiple chemical mechanisms are available within UWCM; here we used the latest version of the Master Chemical Mechanism (MCM v3.3.1, Jenkin et al. (2015)). UWCM was constrained with 1-minute average observations of isoprene, NO2, ozone, CO, PAN, methane, methanol and meteorology and assumed clear-sky conditions for photolysis frequencies. The chemical system was integrated forward in time to diel steady state (total integration time of 3 days) for each set of measurements. This setup inherently assumes that the atmosphere is in chemical steady state – that is, that production and loss of HCHO, MVK, MACR and other species are roughly balanced. This assumption is rarely strictly true and may fail for highly-aged air masses (where isoprene is depleted) or when close to strong local emissions. Nonetheless, it is a fair approximation for the daytime well-mixed boundary layer observations that prevailed during SENEX. Monoterpenes and anthropogenic VOC are excluded from the simulation since observations of these species (from the iWAS) are relatively sparse. Separate sensitivity simulations utilizing the iWAS data suggest that observed monoterpenes and anthropogenic VOC (a subset of alkanes, alkenes and aromatics) increase modeled HCHO by 1 ± 2% and 2 ± 3%, respectively. A more detailed evaluation of box model performance is forthcoming (Marvin et al., 2015).
Output from both models is filtered for daytime, boundary-layer, non-biomass burning points using the same criteria as that for observations (Sect. 2). Both models adequately reproduce observed HCHO mixing ratios (Fig. S5). We perform the same analyses as described above to derive model prompt yield and background HCHO. Because of the reduced time resolution, we group results into 10 NOx bins, instead of 20, before fitting. For AM3, this results in 172 points per bin and typical r2 values of 0.4 – 0.8. For UWCM, there are 134 points per bin and all r2 values are > 0.86.
Both AM3 and UWCM reproduce the observed NOx dependence of the prompt yield (Fig. 4A). AM3 agrees well with observations in both magnitude and trend, though with some scatter at mid-NOx levels. UWCM tends be slightly low throughout most of the NOx range, which may reflect an issue with the mechanism (discussed below) or an inherent shortcoming of the steady-state assumption. Regardless of minor differences, these results suggest that both models provide excellent representation of early generation isoprene oxidation across NOx regimes.
Figure 4.
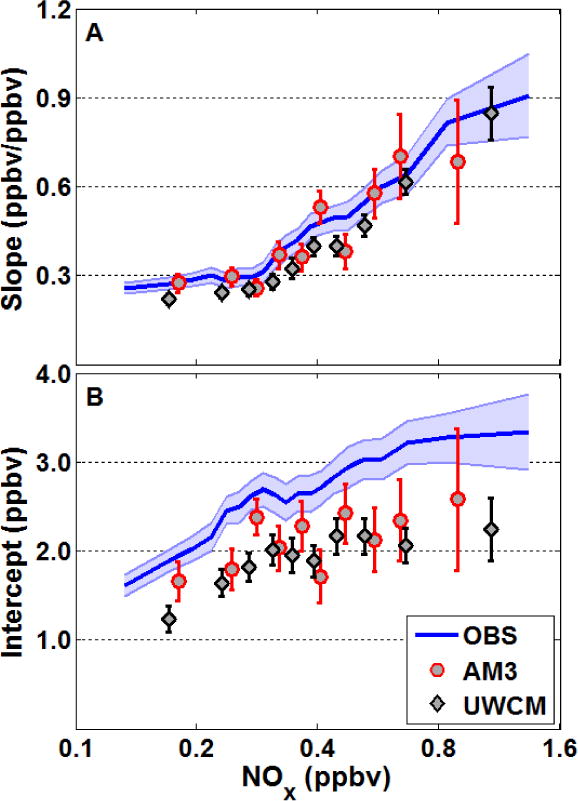
Comparison of observed and model-derived relationships between HCHO and initial isoprene versus NOx. Slopes (A) and intercepts (B) are calculated as described in the text. The observed values (blue line with shading) are the same as those shown in Figs. 3B–C. Symbols represent fit results for the global AM3 model (red circles) and the 0-D UWCM box model (black diamonds). Error bars denote 3σ fitting uncertainties.
Background HCHO mixing ratios are under-predicted by 0.5 – 1 ppbv by both models (Fig. 4B). The range of under-prediction is consistent with the offsets between observed and modeled total HCHO abundances (Fig. S5 fit x-intercepts: 0.3 ppbv (AM3) and 1.1 ppbv (UWCM)). It is possible that both models are missing some HCHO precursors (e.g. from multi-generation isoprene oxidation or other VOC not related to isoprene). This is especially plausible for the UWCM simulation, which only includes isoprene, methane and methanol as primary VOC and does not account for horizontal transport. Under-estimated OH concentrations might also explain part of this discrepancy, though we cannot easily evaluate this possibility. AM3 performs somewhat better than UWCM in terms of overall magnitude but exhibits a less clear NOx trend, which may reflect dilution over fairly large grid scales (note that the range of binned NOx values is smaller for AM3 than both observations and the UWCM). This result again highlights the need to consider this background before using a model to interpret observed HCHO columns that effectively average HCHO sources over space and time.
The agreement between AM3 and UWCM-MCMv3.3.1 is consistent with how these mechanisms treat first-generation ISOPO2 radicals (Figs. S6 and S7). Both models use the same rate constants for reactions of ISOPO2 with NO and HO2, which comprise the bulk of ISOPO2 sink. The AM3 mechanism assigns a 12% yield of HCHO to the reaction of ISOPO2 with HO2 (Paulot et al., 2009b), while the MCM assumes 100% production of peroxides for this channel. This may explain some of the discrepancy in the prompt yield at low NOx (Fig. 4A), though neither mechanism is consistent with the current experimental HCHO yield of ~6% HCHO (Liu et al., 2013). There are also two key differences in the minor reaction channels. First, the rate constant for reaction of ISOPO2 with other RO2 is an order of magnitude lower in AM3 compared to MCMv3.3.1 (1.54 vs. 12 – 16 × 10−13 cm3 s−1, the latter depending on the ISOPO2 isomer distribution). This reaction produces HCHO with yields comparable to that of ISOPO2 + NO and may be an important source in very-low NOx regimes. Second, AM3 assumes a constant ISOPO2 isomer distribution and thus under-predicts the isomerization rate relative to MCMv3.3.1, especially at mid to high NOx (Fig. S7D). AM3 also includes HCHO and other small oxidized VOC as direct products of isomerization rather than producing hydroperoxyaldehydes and other large products, which influences the timescale of HCHO production and thus the partitioning between prompt and background HCHO. The impact of the RO2 reaction and isomerization channels on HCHO yields is likely minor but depends significantly on the RO2/HO2 ratio (at low NOx) and on the overall ISOPO2 lifetime, which affects the ISOPO2 isomer distribution. For the particular model conditions in Fig. S3B, ISOPO2 lifetimes for the two mechanisms can differ by as much as 25% at the lowest NOx values (Fig. S7E). Regardless of these differences, the results shown in Fig. 4 confirm that both the condensed AM3 and explicit MCMv3.3.1 mechanisms perform similarly with regard to overall HCHO production.
6 Mechanistic Drivers of the NOx – HCHO Relationship
Despite the complexity of gas-phase organic chemistry, the impact of NOx on HCHO production essentially reduces to two factors: radical cycling and RO2 branching. Increasing NO enhances the conversion of HO2 to OH (R4) and thus accelerates VOC oxidation (R5). RO2 is also produced, to a lesser extent, by VOC ozonolysis and photolysis (R6). Subsequent production of HCHO depends on the structure and fate of RO2 intermediates, which can react with NO, HO2, other RO2, or isomerize (R7).
| (R4) |
| (R5) |
| (R6) |
| (R7) |
Here, α represents a bulk branching ratio for HCHO production weighted over all RO2 reactions. The RO2 lifetime is typically less than 100 s during the day, so (R5) is the rate-limiting step in HCHO formation. The HCHO production rate is then equal to the product of the total RO2 production rate and the bulk branching ratio:
| (3) |
Though total RO2 losses include reactions that do not make HCHO, α is still a useful metric for the relationship between HCHO production and overall VOC oxidation.
To disentangle these factors, we extract chemical rates from the diel steady-state UWCM simulations discussed in Sect. 5. Figure 5A shows the gross production rates for total peroxy radicals and HCHO as a function of NOx. Consistent with our earlier discussion, HCHO production increases by a factor of 3 from low to high NOx. Total RO2 production increases by a factor of 2 over this same range, driven primarily by increasing OH. The bulk branching ratio α, calculated as the ratio of HCHO and RO2 production rates, increases from 0.43 to 0.62 (Fig. 5B). This trend is consistent with NOx-dependent branching ratios of several major HCHO precursors, including isoprene hydroxyperoxy radicals (ISOPO2) and methyl peroxy radical (Fig. 5B). Based on this analysis, we conclude that enhanced OH production is the main driver for the NOx dependence of HCHO production, with variations in RO2 branching playing a lesser (but still important) role.
Figure 5.
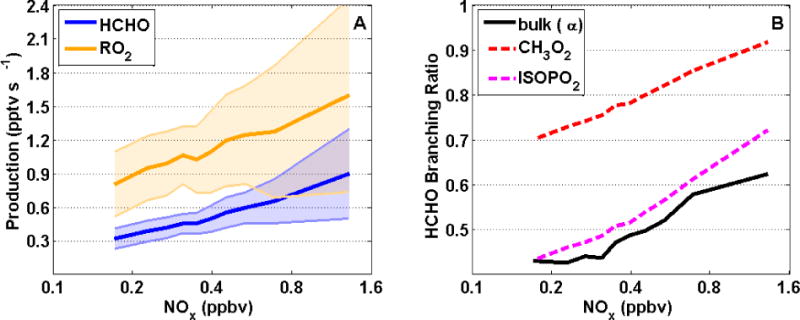
NOx dependence of chemical properties related to HCHO production, extracted from the UWCM simulation of SENEX observations. (A) Production rates for HCHO (blue) and total RO2 (orange). (B) Branching ratios for HCHO production weighted over all RO2 (solid black line) and for several individual RO2, including methyl peroxy radical (red) and total isoprene hydroxyperoxy radicals (magenta). All quantities are averaged over NOx using 10 bins with equal numbers of points. In (A), solid lines show the mean and shading is 1σ variability.
Using a combination of regional modeling and satellite observations, a recent study by Valin et al. (2016) also examines the drivers of HCHO production. They concur that OH production exerts a controlling influence on HCHO throughout the Southeast U.S. In contrast to our study, however, they assert that changes in RO2 branching have a negligible effect on the HCHO-NOx dependence. There are several potential explanations for this discrepancy. First, Valin et al. (2016) derive an “effective branching ratio” that is analogous to the bulk branching ratio in Eqn. (3) but calculated with reference to production of OH rather than RO2. Many OH sinks do not form RO2 radicals (e.g. reaction with CO, HCHO, methanol and NO2) and thus will not make HCHO. The fractional contribution of such reactants to total modeled OH reactivity increases from 36% to 60% over our NOx range; thus, using P(OH) instead of P(RO2) to calculate α from Eqn. (3) would effectively normalize out the NOx dependence of RO2 branching (Fig. 5B). Second, these two studies use very different photochemical mechanisms. Valin et al. (2016) use a modified version of the lumped Regional Atmospheric Chemistry Mechanism 2 (RACM2) (Browne et al., 2014; Goliff et al., 2013), while our box model uses the explicit MCMv3.3.1 (Jenkin et al., 2015). In Valin et al. (2016), it is stated that increasing HCHO production from the RO2 + RO2 channel compensates for decreasing production from RO2 + NO – an effect that we do not observe. Deeper investigation reveals that the rate constant for reaction of ISOPO2 with HO2 in RACM2 is a factor of 2 lower than those used in both MCMv3.3.1 and the AM3 mechanism, which are based on the experimentally-derived parameterization of Boyd et al. (2003). Thus, our model predicts a significantly larger contribution of RO2 + HO2 (which produces negligible HCHO) to the total RO2 sink. These differences highlight the importance of carefully evaluating chemical mechanisms before using models to interpret in situ and satellite observations.
Increased OH also reduces the lifetime of HCHO, which may affect the HCHO budget if this reaction becomes competitive with photolysis. UWCM predicts an average HCHO photolysis lifetime of 4 hours and OH reaction lifetimes that range from 3 hours at high NOx to 12 hours at low NOx. Thus, photolysis is typically the dominant loss process and the scaling of HCHO lifetime with OH is typically weak. The net chemical tendency of HCHO (production minus loss) is positive and increasing throughout the range of model NOx conditions. Faster loss due to reaction with OH therefore only slightly dampens the enhancement in HCHO production.
7 Conclusions
Using SENEX aircraft observations, we have quantified the NOx dependence of the relationship between isoprene emission strength and HCHO mixing ratios. Simultaneous measurements of isoprene, MVK and MACR define a photochemical clock for isoprene oxidation, allowing separation of prompt HCHO production (which retains the isoprene source signature) and background HCHO from late-generation isoprene oxidation products, methane and other long-lived VOC. The prompt HCHO yield increases by a factor of 3 (0.3 to 0.9 ppbv ppbv−1) and the average background HCHO mixing ratio doubles (1.6 to 3.3 ppbv) over the range of NOx values encountered in the southeast U.S. (0.1 – 2 ppbv). This analytical method is applied to evaluate the performance of a global chemical transport model and a 0-D steady-state box model. Both models accurately reproduce the observed NOx trend of the prompt HCHO yield, indicating that both chemical mechanisms accurately capture early-stage isoprene oxidation. On the other hand, both models also under-predict background HCHO abundance by 0.5 – 1 ppbv, which is a significant fraction of total HCHO in some cases. This suggests insufficient build-up of isoprene-derived long-lived precursors in the models, missing VOC not related to isoprene, or insufficient OH. Box model results also provide insight into the mechanistic drivers of the observed NOx trends. Over the NOx range studied here, a 100% increase in total RO2 production and a 40% increase in the HCHO production branching ratio give rise to a 3-fold increase in total HCHO production.
To our knowledge, there are no direct laboratory measurements of HCHO yields from low-NOx isoprene chemistry; thus, the results presented here constitute the first measurement-constrained evaluation of the isoprene-HCHO link across NOx regimes. The AM3 and MCMv3.3.1 mechanisms differ substantially (the former is highly condensed while the latter is explicit), but both contain recent updates to isoprene degradation. We expect that other mechanisms will also perform well if they accurately reflect our current best understanding. The observations presented here do not include the extremely-low NOx regime (NOx < 0.1 ppbv) typical of remote regions like the Amazon and equatorial Africa. In such pristine regions, smearing of HCHO production is expected to be more severe (Barkley et al., 2013), and total HCHO production may be significantly lower if the RO2 fate favors functionalization over fragmentation (e.g. isomerization). More work is needed to map out this area of the urban-rural spectrum. It may also be possible to apply the methods developed here to evaluate the chemistry of glyoxal, another key tracer of VOC oxidation that is also amenable to orbital observations (Kaiser et al., 2015b; Li et al., 2016) and is believed to be an important precursor for SOA (McNeill et al., 2012).
These results also carry implications for top-down isoprene emission estimates. Uncertainties in low-NOx chemistry are often cited as the largest source of potential error in derived emissions (Marais et al., 2012; Palmer et al., 2006). Based on our analysis, current mechanisms appear to capture low-NOx production of HCHO, MVK and MACR, thus such errors are likely less severe than commonly asserted. Recent work has acknowledged the impact of NOx on the prompt yield of HCHO from isoprene (Marais et al., 2012). We advocate considering the NOx dependence of background HCHO as well, since this can constitute a significant fraction of the total HCHO column. For scale, the derived background HCHO mixing ratio of 1.6 – 3.3 ppbv is 37 – 77% of the campaign-mean observed HCHO mixing ratio of 4.3 ppbv. Forthcoming geostationary observations will resolve local gradients in chemical regime, and smearing and background HCHO production will become problematic even in high-NOx regions. Indeed, even current-generation orbital instruments are capable of resolving some urban-rural gradients in HCHO columns (Boeke et al., 2011). When applying advanced statistical techniques like inversion, model results will only be as accurate as the chemical mechanisms driving them. Continued field observations are crucial for providing confidence in our ability to link HCHO to its sources. In this regard, recent work has highlighted the potential of airborne eddy covariance fluxes to quantify both surface-atmosphere exchange and in situ chemical processes (Karl et al., 2013; Kaser et al., 2015; Misztal et al., 2014; Wolfe et al., 2015). With such tools, it should be possible to simultaneously measure both isoprene emissions and HCHO columns, thereby obtaining a direct experimental constraint on the link between these two quantities.
Supplementary Material
Acknowledgments
We are grateful to NOAA AOC and the flight crew of the WP-3D for enabling a super awesome mission. HCHO measurement efforts were supported by US EPA Science to Achieve Results (STAR) program grant 83540601 and NASA grant NNH10ZDA001N-SEAC4RS. Analysis was supported by NASA ACCDAM grant NNX14AP48G. J. Kaiser acknowledges support from NASA ESSF grant NNX14AK97H. C.D. Hatch was supported by the Hendrix faculty grant and the Hendrix College Odyssey program. JM and LWH acknowledge support from NOAA Climate Program Office grant # NA13OAR4310071. This research has not been subjected to any EPA review and therefore does not necessarily reflect the views of the agency, and no official endorsement should be inferred.
Footnotes
Data Availability
All data used in this study are publicly accessible on the SENEX website (http://www.esrl.noaa.gov/csd/projects/senex/).
References
- Abbot DS, Palmer PI, Martin RV, Chance KV, Jacob DJ, Guenther A. Seasonal and interannual variability of North American isoprene emissions as determined by formaldehyde column measurements from space. Geophys Res Lett. 2003;30:1886. doi: 10.1029/2003GL017336. [DOI] [Google Scholar]
- Atkinson R, Arey J. Gas-phase tropospheric chemistry of biogenic volatile organic compounds: a review. Atmos Env. 2003;37:S197–S219. [Google Scholar]
- Atkinson R, Baulch D, Cox R, Crowley J, Hampson R, Hynes R, Jenkin M, Rossi M, Troe J. Evaluated kinetic and photochemical data for atmospheric chemistry: Volume II - gas phase reactions of organic species. Atmos Chem Phys. 2006;6:3625–4055. [Google Scholar]
- Barkley MP, De Smedt I, Van Roozendael M, Kurosu TP, Chance K, Arneth A, Hagberg D, Guenther A, Paulot F, Marais E, Mao JQ. Top-down isoprene emissions over tropical South America inferred from SCIAMACHY and OMI formaldehyde columns. J Geophys Res Atmos. 2013;118:6849–6868. doi: 10.1002/jgrd.50552. [DOI] [Google Scholar]
- Barkley MP, Palmer PI, Kuhn U, Kesselmeier J, Chance K, Kurosu TP, Martin RV, Helmig D, Guenther A. Net ecosystem fluxes of isoprene over tropical South America inferred from Global Ozone Monitoring Experiment (GOME) observations of HCHO columns. J Geophys Res. 2008;113:D20304. doi: 10.1029/2008JD009863. [DOI] [Google Scholar]
- Boeke NL, Marshall JD, Alvarez S, Chance KV, Fried A, Kurosu TP, Rappengluck B, Richter D, Walega J, Weibring P, Millet DB. Formaldehyde columns from the Ozone Monitoring Instrument: Urban versus background levels and evaluation using aircraft data and a global model. J Geophys Res Atmos. 2011;116:D05303. doi: 10.1029/2010jd014870. [DOI] [PMC free article] [PubMed] [Google Scholar]
- Boyd AA, Flaud PM, Daugey N, Lesclaux R. Rate Constants for RO2 + HO2 Reactions Measured under a Large Excess of HO2. J Phys Chem A. 2003;107:818–821. [Google Scholar]
- Brown SS, deGouw JA, Warneke C, Ryerson TB, Dube WP, Atlas E, Weber RJ, Peltier RE, Neuman JA, Roberts JM, Swanson A, Flocke F, McKeen SA, Brioude J, Sommariva R, Trainer M, Fehsenfeld FC, Ravishankara AR. Nocturnal isoprene oxidation over the Northeast United States in summer and its impact on reactive nitrogen partitioning and secondary organic aerosol. Atmos Chem Phys. 2009;9:3027–3042. [Google Scholar]
- Browne EC, Wooldridge PJ, Min KE, Cohen RC. On the role of monoterpene chemistry in the remote continental boundary layer. Atmos Chem Phys. 2014;14:1225–1238. doi: 10.5194/acp-14-1225-2014. [DOI] [Google Scholar]
- Carlton A, Baker K. Photochemical Modeling of the Ozark Isoprene Volcano: MEGAN, BEIS, and Their Impacts on Air Quality Predictions. Env Sci Technol. 2011;45:4438–4445. doi: 10.1021/es200050x. [DOI] [PubMed] [Google Scholar]
- Cazorla M, Wolfe GM, Bailey SA, Swanson AK, Arkinson HL, Hanisco TF. A new airborne laser-induced fluorescence instrument for in situ detection of Formaldehyde throughout the troposphere and lower stratosphere. Atmos Meas Tech. 2015;8:541–552. doi: 10.5194/amt-8-541-2015. [DOI] [Google Scholar]
- Crounse JD, Knap HC, Ørnsø KB, Jørgensen S, Paulot F, Kjaergaard HG, Wennberg PO. On the atmospheric fate of methacrolein: 1. Peroxy radical isomerization following addition of OH and O2. J Phys Chem A. 2012;116:5756–5762. doi: 10.1021/jp211560u. [DOI] [PubMed] [Google Scholar]
- Crounse JD, Paulot F, Kjaergaard HG, Wennberg PO. Peroxy radical isomerization in the oxidation of isoprene. Phys Chem Chem Phys. 2011;13:13607–13613. doi: 10.1039/c1cp21330j. [DOI] [PubMed] [Google Scholar]
- Curci G, Palmer PI, Kurosu TP, Chance K, Visconti G. Estimating European volatile organic compound emissions using satellite observations of formaldehyde from the Ozone Monitoring Instrument. Atmos Chem Phys. 2010;10:11501–11517. doi: 10.5194/acp-10-11501-2010. [DOI] [Google Scholar]
- da Silva G, Graham C, Wang ZF. Unimolecular beta-Hydroxyperoxy Radical Decomposition with OH Recycling in the Photochemical Oxidation of Isoprene. Env Sci Technol. 2010;44:250–256. doi: 10.1021/es900924d. [DOI] [PubMed] [Google Scholar]
- de Gouw J, Warneke C. Measurements of volatile organic compounds in the earths atmosphere using proton-transfer-reaction mass spectrometry. Mass Spec Rev. 2007;26:223–257. doi: 10.1002/mas.20119. [DOI] [PubMed] [Google Scholar]
- de Gouw JA, McKeen SA, Aikin KC, Brock CA, Brown SS, Gilman JB, Graus M, Hanisco T, Holloway JS, Kaiser J, Keutsch FN, Lerner BM, Liao J, Markovic MZ, Middlebrook AM, Min KE, Neuman JA, Nowak JB, Peischl J, Pollack IB, Roberts JM, Ryerson TB, Trainer M, Veres PR, Warneke C, Welti A, Wolfe GM. Airborne Measurements of the Atmospheric Emissions from a Fuel Ethanol Refinery. J Geophys Res Atmos. 2015;120:4385–4397. doi: 10.1002/2015jd023138. [DOI] [Google Scholar]
- de Gouw JA, Middlebrook AM, Warneke C, Goldan PD, Kuster WC, Roberts JM, Fehsenfeld FC, Worsnop DR, Canagaratna MR, Pszenny AAP, Keene WC, Marchewka M, Bertman SB, Bates TS. Budget of organic carbon in a polluted atmosphere: Results from the New England Air Quality Study in 2002. J Geophys Res. 2005;110:D16305. doi: 10.1029/2004jd005623. [DOI] [Google Scholar]
- DiGangi JP, Boyle ES, Karl T, Harley P, Turnipseed A, Kim S, Cantrell C, Maudlin RL, III, Zheng W, Flocke F, Hall SR, Ullmann K, Nakashima Y, Paul JB, Wolfe GM, Desai AR, Kajii Y, Guenther A, Keutsch FN. First direct measurements of formaldehyde flux via eddy covariance: implications for missing in-canopy formaldehyde sources. Atmos Chem Phys. 2011;11:10565–10578. doi: 10.5194/acp-11-10565-2011. [DOI] [Google Scholar]
- Donner LJ, Wyman BL, Hemler RS, Horowitz LW, Ming Y, Zhao M, Golaz JC, Ginoux P, Lin SJ, Schwarzkopf MD, Austin J, Alaka G, Cooke WF, Delworth TL, Freidenreich SM, Gordon CT, Griffies SM, Held IM, Hurlin WJ, Klein SA, Knutson TR, Langenhorst AR, Lee HC, Lin Y, Magi BI, Malyshev SL, Milly PCD, Naik V, Nath MJ, Pincus R, Ploshay JJ, Ramaswamy V, Seman CJ, Shevliakova E, Sirutis JJ, Stern WF, Stouffer RJ, Wilson RJ, Winton M, Wittenberg AT, Zeng F. The Dynamical Core, Physical Parameterizations, and Basic Simulation Characteristics of the Atmospheric Component AM3 of the GFDL Global Coupled Model CM3. J Climate. 2011;24:3484–3519. doi: 10.1175/2011jcli3955.1. [DOI] [Google Scholar]
- Dufour G, Wittrock F, Camredon M, Beekmann M, Richter A, Aumont B, Burrows JP. SCIAMACHY formaldehyde observations: constraint for isoprene emission estimates over Europe? Atmos Chem Phys. 2009;9:1647–1664. [Google Scholar]
- Fares S, Paoletti E, Loreto F, Brilli F. Bidirectional Flux of Methyl Vinyl Ketone and Methacrolein in Trees with Different Isoprenoid Emission under Realistic Ambient Concentrations. Environ Sci Technol. 2015;49:7735–7742. doi: 10.1021/acs.est.5b00673. [DOI] [PubMed] [Google Scholar]
- Fortems-Cheiney A, Chevallier F, Pison I, Bousquet P, Saunois M, Szopa S, Cressot C, Kurosu TP, Chance K, Fried A. The formaldehyde budget as seen by a global-scale multi-constraint and multi-species inversion system. Atmos Chem Phys. 2012;12:6699–6721. doi: 10.5194/acp-12-6699-2012. [DOI] [Google Scholar]
- Fu TM, Jacob DJ, Palmer PI, Chance K, Wang YXX, Barletta B, Blake DR, Stanton JC, Pilling MJ. Space-based formaldehyde measurements as constraints on volatile organic compound emissions in east and south Asia and implications for ozone. J Geophys Res Atmos. 2007;112:D06312. doi: 10.1029/2006jd007853. [DOI] [Google Scholar]
- Fuchs H, Hofzumahaus A, Rohrer F, Bohn B, Brauers T, Dorn H, Haseler R, Holland F, Kaminski M, Li X, Lu K, Nehr S, Tillmann R, Wegener R, Wahner A. Experimental evidence for efficient hydroxyl radical regeneration in isoprene oxidation. Nature Geosci. 2013;6:1023–1026. doi: 10.1038/NGEO1964. [DOI] [Google Scholar]
- Goliff WS, Stockwell WR, Lawson CV. The regional atmospheric chemistry mechanism, version 2. Atmos Env. 2013;68:174–185. doi: 10.1016/j.atmosenv.2012.11.038. [DOI] [Google Scholar]
- González Abad G, Liu X, Chance K, Wang H, Kurosu TP, Suleiman R. Updated Smithsonian Astrophysical Observatory Ozone Monitoring Instrument (SAO OMI) formaldehyde retrieval. Atmos Meas Tech. 2015;8:19–32. doi: 10.5194/amt-8-19-2015. [DOI] [Google Scholar]
- Guenther AB, Jiang X, Heald CL, Sakulyanontvittaya T, Duhl T, Emmons LK, Wang X. The Model of Emissions of Gases and Aerosols from Nature version 2.1 (MEGAN2.1): an extended and updated framework for modeling biogenic emissions. Geosci Mod Dev. 2012;5:1471–1492. doi: 10.5194/gmd-5-1471-2012. [DOI] [Google Scholar]
- Hogrefe C, Isukapalli SS, Tang XG, Georgopoulos PG, He S, Zalewsky EE, Hao W, Ku JY, Key T, Sistla G. Impact of Biogenic Emission Uncertainties on the Simulated Response of Ozone and Fine Particulate Matter to Anthropogenic Emission Reductions. J Air Waste Man Assoc. 2011;61:92–108. doi: 10.3155/1047-3289.61.1.92. [DOI] [PMC free article] [PubMed] [Google Scholar]
- Jenkin ME, Young JC, Rickard AR. The MCM v3.3.1 degradation scheme for isoprene. Atmos Chem Phys. 2015;15:11433–11459. doi: 10.5194/acp-15-11433-2015. [DOI] [Google Scholar]
- Kaiser J, Wolfe GM, Bohn B, Broch S, Fuchs H, Ganzeveld LN, Gomm S, Haseler R, Hofzumahaus A, Holland F, Jager J, Li X, Lohse I, Lu K, Prevot ASH, Rohrer F, Wegener R, Wolf R, Mentel TF, Kiendler-Scharr A, Wahner A, Keutsch FN. Evidence for an unidentified non-photochemical ground-level source of formaldehyde in the Po Valley with potential implications for ozone production. Atmos Chem Phys. 2015a;15:1289–1298. doi: 10.5194/acp-15-1289-2015. [DOI] [Google Scholar]
- Kaiser J, Wolfe GM, Min KE, Brown SS, Miller CC, Jacob DJ, deGouw JA, Graus M, Hanisco TF, Holloway J, Peischl J, Pollack IB, Ryerson TB, Warneke C, Washenfelder RA, Keutsch FN. Reassessing the ratio of glyoxal to formaldehyde as an indicator of hydrocarbon precursor speciation. Atmos Chem Phys. 2015b;15:7571–7583. doi: 10.5194/acp-15-7571-2015. [DOI] [Google Scholar]
- Karl T, Harley P, Emmons L, Thornton B, Guenther A, Basu C, Turnipseed A, Jardine K. Efficient Atmospheric Cleansing of Oxidized Organic Trace Gases by Vegetation. Science. 2010;330:816–819. doi: 10.1126/science.1192534. [DOI] [PubMed] [Google Scholar]
- Karl T, Misztal P, Jonsson H, Shertz S, Goldstein A, Guenther A. Airborne Flux Measurements of BVOCs above Californian Oak Forests: Experimental Investigation of Surface and Entrainment Fluxes, OH Densities, and Damkohler Numbers. J Atmos Sci. 2013;70:3277–3287. doi: 10.1175/JAS-D-13-054.1. [DOI] [Google Scholar]
- Kaser L, Karl T, Yuan B, Mauldin RL, III, Cantrell CA, Guenther AB, Patton EG, Weinheimer AJ, Knote C, Orlando J, Emmons L, Apel E, Hornbrook R, Shertz S, Ullmann K, Hall S, Graus M, de Gouw J, Zhou X, Ye C. Chemistry-turbulence interactions and mesoscale variability influence the cleansing efficiency of the atmosphere. Geophys Res Lett. 2015;42:10894–10903. doi: 10.1002/2015GL066641. [DOI] [Google Scholar]
- Kefauver SC, Filella I, Peñuelas J. Remote sensing of atmospheric biogenic volatile organic compounds (BVOCs) via satellite-based formaldehyde vertical column assessments. Int J Remote Sens. 2014;35:7519–7542. doi: 10.1080/01431161.2014.968690. [DOI] [Google Scholar]
- Kim S, Kim SY, Lee M, Shim H, Wolfe GM, Guenther AB, He A, Hong Y, Han J. Impact of isoprene and HONO chemistry on ozone and OVOC formation in a semirural South Korean forest. Atmos Chem Phys. 2015;15:4357–4371. doi: 10.5194/acp-15-4357-2015. [DOI] [Google Scholar]
- Kim S, Wolfe GM, Mauldin L, Cantrell C, Guenther A, Karl T, Turnipseed A, Greenberg J, Hall SR, Ullmann K, Apel E, Hornbrook R, Kajii Y, Nakashima Y, Keutsch FN, DiGangi JP, Henry SB, Kaser L, Schnitzhofer R, Graus M, Hansel A, Zheng W, Flocke FF. Evaluation of HOx sources and cycling using measurement-constrained model calculations in a 2-methyl-3-butene-2-ol (MBO) and monoterpene (MT) dominated ecosystem. Atmos Chem Phys. 2013;13:2031–2044. doi: 10.5194/acp-13-2031-2013. [DOI] [Google Scholar]
- Knighton WB, Herndon SC, Franklin JF, Wood EC, Wormhoudt J, Brooks W, Fortner EC, Allen DT. Direct measurement of volatile organic compound emissions from industrial flares using real-time online techniques: Proton Transfer Reaction Mass Spectrometry and Tunable Infrared Laser Differential Absorption Spectroscopy. Industrial & Engineering Chemistry Research. 2012;51:12674–12684. doi: 10.1021/ie202695v. [DOI] [Google Scholar]
- Kwok ESC, Aschmann SM, Arey J, Atkinson R. Product formation from the reaction of the NO3 radical with isoprene and rate constants for the reactions of methacrolein and methyl vinyl ketone with the NO3 radical. Int J Chem Kin. 1996;28:925–934. [Google Scholar]
- Lee M, Heikes BG, Jacob DJ, Sachse G, Anderson B. Hydrogen peroxide, organic hydroperoxide, and formaldehyde as primary pollutants from biomass burning. J Geophys Res Atmos. 1997;102:1301–1309. doi: 10.1029/96jd01709. [DOI] [Google Scholar]
- Lerner BM, Gilman JB, Kuster WC, de Gouw JA, et al. An improved, automated whole-air sampler and VOC GC-MS analysis system. 2016 in preparation. [Google Scholar]
- Li J, Mao J, Min KE, Washenfelder RA, Brown SS, Kaiser J, Keutsch FN, Volkamer R, Wolfe GM, Hanisco TF, Pollack IB, Ryerson TB, Graus M, Gilman JB, Lerner BM, Warneke C, de Gouw JA, Middlebrook AM, Liao J, Welti A, Henderson BH, Donner LJ, Cooke WF, Paulot F, Horowitz LW. Observational constraints on glyoxal production from isoprene oxidation and its contribution to organic aerosol over the Southeast United States. Geophys Res Lett. 2016 doi: 10.1002/2016JD025331. submitted. [DOI] [PMC free article] [PubMed] [Google Scholar]
- Liu YJ, Herdlinger-Blatt I, McKinney KA, Martin ST. Production of methyl vinyl ketone and methacrolein via the hydroperoxyl pathway of isoprene oxidation. Atmos Chem Phys. 2013;13:5715–5730. doi: 10.5194/acp-13-5715-2013. [DOI] [Google Scholar]
- Luecken DJ, Hutzell WT, Strum ML, Pouliot GA. Regional sources of atmospheric formaldehyde and acetaldehyde, and implications for atmospheric modeling. Atmos Env. 2012;47:477–490. doi: 10.1016/j.atmosenv.2011.10.005. [DOI] [Google Scholar]
- Mao J, Horowitz LW, Naik V, Fan S, Liu J, Fiore AM. Sensitivity of tropospheric oxidants to biomass burning emissions: implications for radiative forcing. Geophys Res Lett. 2013;40:1241–1246. doi: 10.1002/grl.50210. [DOI] [Google Scholar]
- Mao J, Ren X, Brune WH, Van Duin DM, Cohen RC, Park JH, Goldstein AH, Paulot F, Beaver MR, Crounse JD, Wennberg PO, DiGangi JP, Henry SB, Keutsch FN, Park C, Schade GW, Wolfe GM, Thornton JA. Insights into hydroxyl measurements and atmospheric oxidation in a California forest. Atmos Chem Phys. 2012;12:8009–8020. doi: 10.5194/acp-12-8009-2012. [DOI] [Google Scholar]
- Marais EA, Jacob DJ, Kurosu TP, Chance K, Murphy JG, Reeves C, Mills G, Casadio S, Millet DB, Barkley MP, Paulot F, Mao J. Isoprene emissions in Africa inferred from OMI observations of formaldehyde columns. Atmos Chem Phys. 2012;12:6219–6235. doi: 10.5194/acp-12-6219-2012. [DOI] [PMC free article] [PubMed] [Google Scholar]
- Marvin M, Wolfe GM, Salawitch R, et al. Evaluating mechanisms for isoprene oxidation using a constrained chemical box model and SENEX observations of formaldehyde. 2015 in preparation. [Google Scholar]
- McNeill VF, Woo JL, Kim DD, Schwier AN, Wannell NJ, Sumner AJ, Barakat JM. Aqueous-Phase Secondary Organic Aerosol and Organosulfate Formation in Atmospheric Aerosols: A Modeling Study. Env Sci Technol. 2012;46:8075–8081. doi: 10.1021/es3002986. [DOI] [PubMed] [Google Scholar]
- Millet DB, Jacob DJ, Boersma KF, Fu TM, Kurosu TP, Chance K, Heald CL, Guenther A. Spatial distribution of isoprene emissions from North America derived from formaldehyde column measurements by the OMI satellite sensor. J Geophys Res Atmos. 2008;113:D02307. doi: 10.1029/2007jd008950. [DOI] [Google Scholar]
- Millet DB, Jacob DJ, Turquety S, Hudman RC, Wu SL, Fried A, Walega J, Heikes BG, Blake DR, Singh HB, Anderson BE, Clarke AD. Formaldehyde distribution over North America: Implications for satellite retrievals of formaldehyde columns and isoprene emission. J Geophys Res Atmos. 2006;111:D24S02. doi: 10.1029/2005jd006853. [DOI] [Google Scholar]
- Misztal PK, Karl T, Weber R, Jonsson HH, Guenther AB, Goldstein AH. Airborne flux measurements of biogenic volatile organic compounds over California. Atmos Chem Phys. 2014;14:10631–10647. doi: 10.5194/acpd-14-10631-2014. [DOI] [Google Scholar]
- Naik V, Horowitz LW, Fiore AM, Ginoux P, Mao J, Aghedo AM, Levy H., II Impact of preindustrial to present-day changes in short-lived pollutant emissions on atmospheric composition and climate forcing. J Geophys Res Atmos. 2013;118:8086–8110. doi: 10.1002/jgrd.50608. [DOI] [Google Scholar]
- Palmer PI, Abbot DS, Fu TM, Jacob DJ, Chance K, Kurosu TP, Guenther A, Wiedinmyer C, Stanton JC, Pilling MJ, Pressley SN, Lamb B, Sumner AL. Quantifying the seasonal and interannual variability of North American isoprene emissions using satellite observations of the formaldehyde column. J Geophys Res Atmos. 2006;111:D12315. doi: 10.1029/2005jd006689. [DOI] [Google Scholar]
- Palmer PI, Jacob DJ, Fiore AM, Martin RV, Chance K, Kurosu TP. Mapping isoprene emissions over North America using formaldehyde column observations from space. J Geophys Res Atmos. 2003;108:4180. doi: 10.1029/2002jd002153. [DOI] [Google Scholar]
- Paulot F, Crounse JD, Kjaergaard HG, Kroll JH, Seinfeld JH, Wennberg PO. Isoprene photooxidation: new insights into the production of acids and organic nitrates. Atmos Chem Phys. 2009a;9:1479–1501. [Google Scholar]
- Paulot F, Crounse JD, Kjaergaard HG, Kurten A, St Clair JM, Seinfeld JH, Wennberg PO. Unexpected Epoxide Formation in the Gas-Phase Photooxidation of Isoprene. Science. 2009b;325:730–733. doi: 10.1126/science.1172910. [DOI] [PubMed] [Google Scholar]
- Peeters J, Muller JF, Stavrakou T, Nguyen VS. Hydroxyl Radical Recycling in Isoprene Oxidation Driven by Hydrogen Bonding and Hydrogen Tunneling: The Upgraded LIM1 Mechanism. J Phys Chem A. 2014;118:8625–8643. doi: 10.1021/jp5033146. [DOI] [PubMed] [Google Scholar]
- Peeters J, Müller JF. HOx radical regeneration in isoprene oxidation via peroxy radical isomerisations. II: experimental evidence and global impact. Phys Chem Chem Phys. 2010;12:14227–14235. doi: 10.1939/c0cp00811g. [DOI] [PubMed] [Google Scholar]
- Peeters J, Nguyen TL, Vereecken L. HOx radical regeneration in the oxidation of isoprene. Phys Chem Chem Phys. 2009;11:5935–5939. doi: 10.1039/b908511d. [DOI] [PubMed] [Google Scholar]
- Peeters J, Vandenberk S, Piessens E, Pultau V. H-atom abstraction in reactions of cyclic polyalkenes with OH. Chemosphere. 1999;38:1189–1195. [Google Scholar]
- Pollack I, Lerner B, Ryerson T. Evaluation of ultraviolet light-emitting diodes for detection of atmospheric NO2 by photolysis - chemiluminescence. J Atmos Chem. 2010;65:111–125. doi: 10.1007/s10874-011-9184-3. [DOI] [Google Scholar]
- Rivera-Rios JC, Nguyen TB, Crounse JD, Jud W, St Clair JM, Mikoviny T, Gilman JB, Lerner BM, Kaiser JB, de Gouw J, Wisthaler A, Hansel A, Wennberg PO, Seinfeld JH, Keutsch FN. Conversion of hydroperoxides to carbonyls in field and laboratory instrumentation: Observational bias in diagnosing pristine versus anthropogenically controlled atmospheric chemistry. Geophys Res Lett. 2014;41:8645–8651. doi: 10.1002/2014gl061919. [DOI] [Google Scholar]
- Roberts JM, Marchewka M, Bertman SB, Goldan P, Kuster W, de Gouw J, Warneke C, Williams E, Lerner B, Murphy P, Apel E, Fehsenfeld FC. Analysis of the isoprene chemistry observed during the New England Air Quality Study (NEAQS) 2002 intensive experiment. J Geophys Res. 2006;111:D23S12. doi: 10.1029/2006jd007570. [DOI] [Google Scholar]
- Ryerson T, Huey L, Knapp K, Neuman J, Parrish D, Sueper D, Fehsenfeld F. Design and initial characterization of an inlet for gas-phase NOy measurements from aircraft. J Geophys Res Atmos. 1999;104:5483–5492. doi: 10.1029/1998JD100087. [DOI] [Google Scholar]
- Shim C, Wang Y, Choi Y, Palmer PI, Abbot DS, Chance K. Constraining global isoprene emissions with Global Ozone Monitoring Experiment (GOME) formaldehyde column measurements. J Geophys Res. 2005;110:D24301. doi: 10.1029/2004jd005629. [DOI] [Google Scholar]
- St Clair JM, Wolfe GM, Rivera-Rios JC, Crounse JD, Praske E, Kim MJ, Thayer MP, Skog KM, Keutsch FN, Wennberg PO, Hanisco TF. Investigation of a potential HCHO measurement artifact from ISOPOOH. 2016 doi: 10.5194/amt-9-4561-2016. in preparation. [DOI] [PMC free article] [PubMed] [Google Scholar]
- Stavrakou T, Müller JF, de Smedt I, Van Roozendael M, van der Werf GR, Giglio L, Guenther A. Evaluating the performance of pyrogenic and biogenic emission inventories against one decade of space-based formaldehyde columns. Atmos Chem Phys. 2009;9:1037–1060. [Google Scholar]
- Stavrakou T, Müller JF, Bauwens M, De Smedt I, Van Roozendael M, Guenther A, Wild M, Xia X. Isoprene emissions over Asia 1979–2012: impact of climate and land-use changes. Atmos Chem Phys. 2014;14:4587–4605. doi: 10.5194/acp-14-4587-2014. [DOI] [Google Scholar]
- Stroud C, Roberts J, Goldan P, Kuster W, Murphy P, Williams E, Hereid D, Parrish D, Sueper D, Trainer M, Fehsenfeld F, Apel E, Riemer D, Wert B, Henry B, Fried A, Martinez-Harder M, Harder H, Brune W, Li G, Xie H, Young V. Isoprene and its oxidation products, methacrolein and methylvinyl ketone, at an urban forested site during the 1999 Southern Oxidants Study. J Geophys Res Atmos. 2001;106:8035–8046. doi: 10.1029/2000JD900628. [DOI] [Google Scholar]
- Trainer M, Williams E, Parrish D, Buhr M, Allwine E, Westberg H, Fehsenfeld F, Liu S. Models and observations of the impact of natural hydrocarbons on rural ozone. Nature. 1987;329:705–707. doi: 10.1038/329705a0. [DOI] [Google Scholar]
- Valin LC, Fiore AM, Chance K, González Abad G. The role of OH production in interpreting the variability of CH2O columns in the southeast US. J Geophys Res Atmos. 2016 doi: 10.1002/2015JD024012. [DOI] [Google Scholar]
- Wagner NL, Brock CA, Angevine WM, Beyersdorf A, Campuzano-Jost P, Day D, de Gouw JA, Diskin GS, Gordon TD, Graus MG, Holloway JS, Huey G, Jimenez JL, Lack DA, Liao J, Liu X, Markovic MZ, Middlebrook AM, Mikoviny T, Peischl J, Perring AE, Richardson MS, Ryerson TB, Schwarz JP, Warneke C, Welti A, Wisthaler A, Ziemba LD, Murphy DM. In situ vertical profiles of aerosol extinction, mass, and composition over the southeast United States during SENEX and SEAC4RS: observations of a modest aerosol enhancement aloft. Atmos Chem Phys. 2015;15:7085–7102. doi: 10.5194/acp-15-7085-2015. [DOI] [Google Scholar]
- Warneke C, de Gouw JA, Del Negro L, Brioude J, McKeen S, Stark H, Kuster WC, Goldan PD, Trainer M, Fehsenfeld FC, Wiedinmyer C, Guenther AB, Hansel A, Wisthaler A, Atlas E, Holloway JS, Ryerson TB, Peischl J, Huey LG, Hanks ATC. Biogenic emission measurement and inventories determination of biogenic emissions in the eastern United States and Texas and comparison with biogenic emission inventories. J Geophys Res Atmos. 2010;115:D00F18. doi: 10.1029/2009jd012445. [DOI] [Google Scholar]
- Warneke C, Trainer M, de Gouw JA, Parrish DD, Fahey DW, Ravishankara AR, Middlebrook AM, Brock CA, Roberts JM, Brown SS, Neuman JA, Lerner BM, Lack D, Law D, Huebler G, Pollack I, Sjostedt S, Ryerson TB, Gilman JB, Liao J, Holloway J, Peischl J, Nowak JB, Aikin K, Min KE, Washenfelder RA, Graus MG, Richardson M, Markovic MZ, Wagner NL, Welti A, Veres PR, Edwards P, Schwarz JP, Gordon T, Dube WP, McKeen S, Brioude J, Ahmadov R, Bougiatioti A, Lin J, Nenes A, Wolfe GM, Hanisco TF, Lee BH, Lopez-Hilfiker FD, Thornton JA, Keutsch FN, Kaiser J, Mao J, Hatch C. Instrumentation and Measurement Strategy for the NOAA SENEX Aircraft Campaign as Part of the Southeast Atmosphere Study 2013. Atmos Meas Tech Discuss. 2016;2016:1–39. doi: 10.5194/amt-2015-388. [DOI] [PMC free article] [PubMed] [Google Scholar]
- Wolfe GM, Cantrell C, Kim S, Mauldin RL, III, Karl T, Harley P, Turnipseed A, Zheng W, Flocke F, Apel EC, Hornbrook RS, Hall SR, Ullmann K, Henrey SB, DiGangi JP, Boyle ES, Kaser L, Schnitzhofer R, Hansel A, Graus M, Nakashima Y, Kajii Y, Guenther A, Keutsch FN. Missing peroxy radical sources within a summertime ponderosa pine forest. Atmos Chem Phys. 2014;14:4715–4732. doi: 10.5194/acp-14-4715-2014. [DOI] [Google Scholar]
- Wolfe GM, Crounse JD, Parrish JD, St Clair JM, Beaver MR, Paulot F, Yoon TP, Wennberg PO, Keutsch FN. Photolysis, OH reactivity and ozone reactivity of a proxy for isoprene-derived hydroperoxyenals (HPALDs) Phys Chem Chem Phys. 2012;14:7276–7286. doi: 10.1039/c2cp40388a. [DOI] [PubMed] [Google Scholar]
- Wolfe GM, Hanisco TF, Arkinson HL, Bui TP, Crounse JD, Dean-Day J, Goldstein A, Guenther A, Hall SR, Huey G, Jacob DJ, Karl T, Kim PS, Liu X, Marvin MR, Mikoviny T, Misztal PK, Nguyen TB, Peischl J, Pollack I, Ryerson T, St Clair JM, Teng A, Travis KR, Ullmann K, Wennberg PO, Wisthaler A. Quantifying sources and sinks of reactive gases in the lower atmosphere using airborne flux observations. Geophys Res Lett. 2015;42:8231–8240. doi: 10.1002/2015GL065839. [DOI] [Google Scholar]
- Xu L, Guo H, Boyd CM, Klein M, Bougiatioti A, Cerully KM, Hite JR, Isaacman-VanWertz G, Kreisberg NM, Knote C, Olson K, Koss A, Goldstein AH, Hering SV, de Gouw J, Baumann K, Lee SH, Nenes A, Weber RJ, Ng NL. Effects of anthropogenic emissions on aerosol formation from isoprene and monoterpenes in the southeastern United States. P Nat Acad Sci USA. 2015;112:37–42. doi: 10.1073/pnas.1417609112. [DOI] [PMC free article] [PubMed] [Google Scholar]
Associated Data
This section collects any data citations, data availability statements, or supplementary materials included in this article.