Fig. 2.

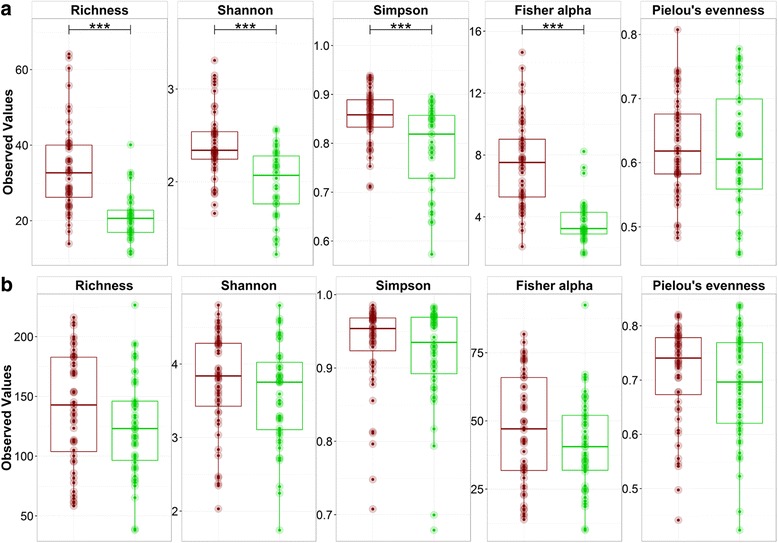
Boxplots of the alpha diversity indices of the a archaeal and b bacterial community on DNA (red) and RNA (green) level. Significant differences between DNA and RNA are indicated (***)

Boxplots of the alpha diversity indices of the a archaeal and b bacterial community on DNA (red) and RNA (green) level. Significant differences between DNA and RNA are indicated (***)