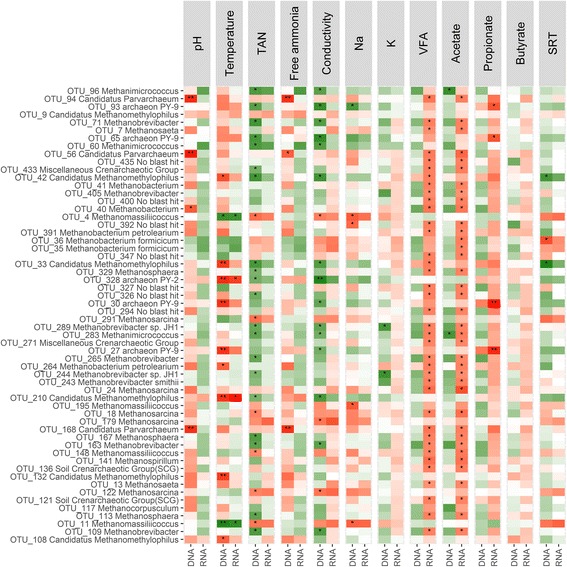
Fig. 4.

Correlation pattern of the 58 archaeal OTUs that had a significant (P < 0.05) difference in relative abundance between DNA and RNA with the main operational parameters, based on the Kendall rank correlation coefficient. Significant positive (green) or negative (red) correlations are marked with * (Adj. P < 0.05), ** (Adj. P < 0.01), or *** (Adj. P < 0.001). TAN total ammonia nitrogen, VFA volatile fatty acids, SRT sludge retention time
