

Abstract
Background
Many physiological and/or pathological conditions lead to muscle deconditioning, a well‐described phenomenon characterized by a loss of strength and muscle power mainly due to the loss of muscle mass. Fatty infiltrations, or intermuscular adipose tissue (IMAT), are currently well‐recognized components of muscle deconditioning. Despite the fact that IMAT is present in healthy human skeletal muscle, its increase and accumulation are linked to muscle dysfunction. Although IMAT development has been largely attributable to inactivity, the precise mechanisms of its establishment are still poorly understood. Because the sedentary lifestyle that accompanies age‐related sarcopenia may favour IMAT development, deciphering the early processes of muscle disuse is of great importance before implementing strategies to limit IMAT deposition.
Methods
In our study, we took advantage of the dry immersion (DI) model of severe muscle inactivity to induce rapid muscle deconditioning during a short period. During the DI, healthy adult men (n = 12; age: 32 ± 5) remained strictly immersed, in a supine position, in a controlled thermo‐neutral water bath. Skeletal muscle biopsies were obtained from the vastus lateralis before and after 3 days of DI.
Results
We showed that DI for only 3 days was able to decrease myofiber cross‐sectional areas (−10.6%). Moreover, protein expression levels of two key markers commonly used to assess IMAT, perilipin, and fatty acid binding protein 4, were upregulated. We also observed an increase in the C/EBPα and PPARγ protein expression levels, indicating an increase in late adipogenic processes leading to IMAT development. While many stem cells in the muscle environment can adopt the capacity to differentiate into adipocytes, fibro‐adipogenic progenitors (FAPs) represent the population that appears to play a major role in IMAT development. In our study, we showed an increase in the protein expression of PDGFRα, the specific cell surface marker of FAPs, in response to 3 days of DI. It is well recognized that an unfavourable muscle environment drives FAPs to ectopic adiposity and/or fibrosis.
Conclusions
This study is the first to emphasize that during a short period of severe inactivity, muscle deconditioning is associated with IMAT development. Our study also reveals that FAPs could be the main resident muscle stem cell population implicated in ectopic adiposity development in human skeletal muscle.
Keywords: Skeletal muscle disuse, Microgravity, Dry immersion, Fat infiltration, Adipogenesis, FAPs
Introduction
The skeletal muscle is the most abundant tissue in the human body, representing approximately 40% of the body weight and accounting for approximately 30% of the basal energy expenditure.1 This tissue is constantly adapting due to many intrinsic and environmental stresses, highlighting its high degree of plasticity. An increase in chronic stimulation through exercise and/or nutrition can cause a positive protein balance that can further lead to muscle hypertrophy.2, 3, 4 Conversely, a chronic decrease in mechanical constraints can lead to muscle deconditioning and atrophy.5, 6, 7, 8, 9, 10, 11 Skeletal muscle deconditioning can be defined as primary deconditioning, in case of direct consequences of unfavourable environmental conditions, such as chronic disuse, immobilization, a microgravity environment, sedentary lifestyle, and ageing (sarcopenia), or as secondary deconditioning, in case of indirect consequences of pathological changes like cancer (cachexia), diabetes, or chronic obstructive pulmonary disease.12
Muscle deconditioning is a well‐described phenomenon characterized by a loss of strength and muscle power mainly due to the loss of muscle mass.13, 14 However, there is now a growing body of evidence indicating that the loss of strength and power mostly exceeds the loss of muscle mass observed after inactivity or in advancing age,12, 15, 16, 17, 18 thereby suggesting that other factors are involved. Among these factors, accumulation of fatty infiltrations, or intermuscular adipose tissue (IMAT), may play a critical role. These fat cells, located under the epimysium (between bundles of muscle fibres) and under the perimysium (between muscle fibres), represent real adipocyte clusters, i.e. ectopic fat depots that are localized outside muscle cells, and should not be confused with intramyocellular triglyceride accumulation.19, 20 Although IMAT is naturally present in healthy human skeletal muscle, its increase and accumulation are linked to muscle dysfunction, deconditioning, and even disrupted regeneration processes.10, 12, 19, 21, 22, 23 Accumulation of these fatty infiltrations has been observed in many conditions closely linked to muscle deconditioning: inactivity,9, 24, 25 denervation,26, 27 diabetes,28, 29, 30 tenotomy31, 32 or even sarcopenia.12, 21, 33 In the specific context of sarcopenia, numerous studies have shown that IMAT infiltration into the mid‐thigh muscle remains an independent risk factor of mobility limitations,34, 35, 36 and IMAT level was also found to be a good predictor of clinical fracture in older adults.37
While many stem cells within the muscle environment could potentially differentiate into adipocytes, fibro‐adipogenic progenitors (FAPs) currently represent the main stem cell population playing a major role in IMAT development. A study by Uezumi et al.38 clearly showed that only progenitor cells expressing the cell surface receptor PDGFRα, representing FAPs, were able to differentiate into adipocytes after muscle injury induced by glycerol in a mouse model of regeneration. Importantly, a study by Heredia et al.39 subsequently confirmed that after muscle injury, PDGFRα was exclusively expressed by the FAPs. Other studies have also confirmed the in vivo adipogenic potential of FAPs.39, 40
Even though IMAT accumulation is strongly linked to many different physiological and/or pathological conditions, it seems that fatty infiltrations in muscles could be more related to the degree of inactivity. Indeed, several studies have demonstrated a negative correlation between physical activity and the amount of fatty infiltrations.9, 12, 24, 25, 41 A study by Manini et al.9 in healthy young adults highlighted IMAT content increases of 15% in the thighs and 20% in the calves after 4 weeks of unilateral lower limb suspension. Interestingly, a longitudinal study by Leskinen et al.24 also revealed that IMAT accumulation was greater in inactive co‐twins compared with their active counterparts. Advancing age is often associated with reduced daily activity42 and an interesting study by Wroblewski et al.43 showed that old elite athletes do not exhibit any increase in IMAT amount with ageing, highlighting again inactivity as a major regulator of IMAT development. Thus, deciphering the processes of IMAT development thanks to muscle disuse models is of great importance to further make up strategies to limit it.
In recent decades, the scientific community has validated several selected cell, animal, and human experimental models for studying muscle wasting processes. Currently, ground‐based models of simulated microgravity protocols contribute largely to scientific studies exploring muscle deconditioning and ageing.5, 12 Continuous exposure to bed rest in a head‐down tilt position has been one of the most used models of simulated microgravity. Studies using this model have produced and continue to generate a large amount of data concerning the effects of inactivity on healthy individuals.15, 44, 45, 46, 47, 48 However, the dry immersion (DI) model of simulated microgravity appears to induce much quicker muscle deconditioning changes than what is observed in the head‐down bed rest model.49 The DI model involves immersing a subject in thermo‐neutral water, and for a relatively short period, this model can faithfully reproduce most of the physiological effects of microgravity, including body fluid centralization, support unloading, and severe hypokinesia leading to muscle deconditioning.49, 50 Originally used and described by Shulzhenko et al.,51 muscle atrophy following DI was observed by several authors, predominantly for slow fibres,52, 53, 54, 55 and was associated with a decrease in sarcomere protein content.55
We previously used the DI model of muscle deconditioning, and we did not find any difference in intramuscular fat content following 3 days of DI using MRI technique.56 However, the MRI technique used does not allow for differentiation between intra‐ and extra‐myocellular lipids, and one can question whether the MRI technique is accurate enough to detect small changes in IMAT content. Moreover, the absence of observed increase in intramuscular fat content does not preclude changes at the cellular and molecular level for IMAT development, particularly concerning FAP commitment into the adipogenic lineage. To date, only the study by Manini et al.9 has investigated the effects of a human ground‐based model of muscle disuse on IMAT development, but no study has analysed the effects of a short period of inactivity. Moreover, the mechanisms leading to fatty infiltrations during sarcopenia or a sedentary lifestyle are poorly understood. We, therefore, took advantage of the DI model to investigate the effects of 3 days of DI on muscle IMAT development. In this study, we aimed to verify whether IMAT development starts within 3 days of DI, along with muscle deconditioning.
Material and methods
Subjects and ethics statement
Twelve healthy male subjects were selected for this experiment (age: 32 ± 5; height: 179 ± 7 cm; weight: 74.5 ± 7.2 kg; BMI: 23.5 ± 1.6). The subjects had no medical history or physical signs of neuromuscular disorders. The subjects were non‐smokers and were not taking any drugs or medications. All subjects gave informed consent to the experimental procedures, which were approved by the local ethics committee (CPP Sud‐Ouest outre‐Mer I, France, number ID RCB: 2014‐A00904–43) in accordance with the Declaration of Helsinki. All experiments were conducted at the Space Clinic of the Institute of Space Medicine and Physiology (Medes‐IMPS, Rangueil Hospital) in Toulouse (France) and were sponsored by the French National Space Agency (CNES).
Overall study design
This experiment consisted of a period of DI for 3 days with a 3 day ambulatory control period before DI and a 2‐day recovery period after DI. In the ambulatory and recovery periods, all subjects remained active and ambulatory, and they were asked not to exercise during the 8 days of the study. During the DI period, the subjects remained immersed in a supine position in a controlled thermo‐neutral water bath (33 ± 0.5°C) continuously, (Figure 1) except for daily 20 min extractions for toilet use and weighing (in bed rest position), and they were instructed not to produce any unnecessary movements with their limbs. The study was conducted in a quiet room at a stable temperature of 25°C. Each subject had a daily medical examination, and the MEDES team took several standardized measurements. For example, discomfort and psychological assessments were made via questionnaires, and body temperature was taken twice daily with a tympanic thermometer. During the 3 days of ambulatory period, the 3 days of DI and the 2 days recovery period, subjects received three solid meals/day during the study, with the requirement to finish all meals. The daily individual energy intake requirement was estimated using the World Health Organization equations by multiplying the resting metabolic rate with a physical activity level of 1.6 before and after DI and 1.3 during DI, as previously described by Arentson‐Lantz et al.48 Coffee, tea, alcohol, smoking, and drugs were prohibited throughout the experiment. Only paracetamol was allowed if needed. For more nutritional protocol details, see Demangel et al.56
Figure 1.
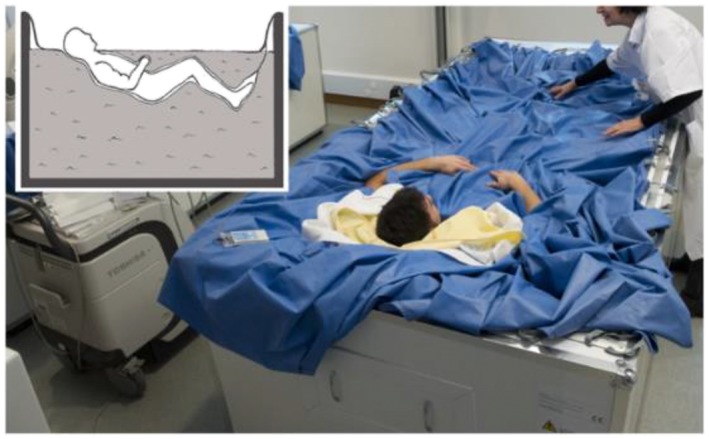
Dry immersion experimental model (used with permission from Treffel et al.57).
Muscle biopsy
Skeletal muscle biopsy was performed before DI (Pre‐DI, 8–13 days before DI) and during the final day of DI (Post‐DI, before reambulation) from the right vastus lateralis (VL) according to a well‐established method using a 5 mm Bergström biopsy needle under sterile conditions and local anaesthesia (1% lidocaine).58 Pre‐ and Post‐DI biopsies were obtained from the same leg, as near to each other as possible, and for each biopsy, two pieces were selected with an optical microscope for histological analyses. One piece was immediately embedded in small silicone casts filled with a cryoprotector (OCT, Sakura Finetek), immediately frozen in liquid nitrogen, and stored at −80°C until further analysis. The other piece was immediately fixed overnight in 4% paraformaldehyde solution at room temperature for 24 h and then embedded in paraffin. The remaining biopsy was rapidly frozen in liquid nitrogen and stored at −80°C for mRNA and protein content quantification.
Cryosectioning and immunohistochemistry
Transverse serial cross sections (10 μm thick) of VL samples were obtained using a cryostat maintained at −25°C. Before labelling, the sections were dried and fixed for 10 min in acetone. The sections were then washed in phosphate‐buffered saline (PBS), blocked and permeabilized with 0.1% Triton‐X100 and 20% horse serum. The sections were incubated with selected primary antibodies for 1 h at 37°C, followed by washes in PBS and incubation with the secondary antibody for 1 h at 37°C. The fibre sizes were analysed with ImageJ (1.46r version) software.
Paraffin‐embedded histological and immunohistochemical analyses
The muscle biopsies were fixed in 4% neutral‐buffered formalin (24 h) and embedded in paraffin. The paraffin‐embedded tissues were sectioned (3 μm thick), and the sections were stained with haematoxylin/eosin/saffron (H/E/S). The stained slides were digitalized with a NanoZoomer slide scanner with a 40× objective (Hamamatsu). The other slides were preserved for subsequent immunohistochemical analyses.
The immunohistochemistry protocol was performed as previously described.10, 59 Briefly, the skeletal muscle sections were deparaffinized, rehydrated, and incubated for antigen retrieval in EDTA buffer at 100°C for 30 min. The sections were incubated in 0.3% H2O2 for 20 min, and endogenous biotin was blocked using an Avidin‐Biotin Blocking Kit (Vector Laboratories, CliniSciences). Non‐specific antibody binding was blocked by incubation with TBS containing 20% normal goat serum for 30 min at RT. The sections were then incubated overnight at 4°C with anti‐PDGFRα antibody diluted at 1:250 or non‐specific rabbit IgG (Vector Laboratories, CliniSciences) at the same concentration. Antibody binding was revealed by the streptavidin‐biotin‐peroxidase complex method using an ABC Vectastain Kit and the peroxidase substrate 3,3'‐Diaminobenzidine (Vector Laboratories, CliniSciences). Images were analysed with ImageJ (1.46r version) software.
mRNA extraction and real‐time polymerase chain reaction (qPCR)
Total RNA was isolated from homogenized muscle samples using a miRNeasy Mini Kit according to the manufacturer's instructions (Qiagen). RNA concentration was determined by spectrophotometric analysis (Eppendorf AG, Hamburg, Germany), and integrity was checked with an Agilent 2100 bioanalyzer (Agilent Technologies) using an RNA 6000 Nano Kit according to the manufacturer's instructions.60 Reverse transcription reaction was performed with 2 μg of total RNA using a RevertAid First Strand cDNA Synthesis Kit (Thermo Scientific) according to the manufacturer's instructions. qPCR analysis was performed in a StepOnePlus Real‐Time PCR System (Applied Biosystems) with 10 μL of KAPA SYBR Fast Universal Readymix (CliniSciences), 300 nM forward and reverse primers, 2 μL of diluted cDNA template and water to a final volume of 20 μL. The forward and reverse primers used to amplify genes are listed in Table 1. All PCRs were performed in duplicate using the following cycle parameters: 20 s at 95°C, 40 cycles of 3 s at 95°C and 30 s at 60°C. The relative mRNA levels were normalized to β2‐microglobulin and cyclophilin A housekeeping gene levels, which were unaffected by the experiment. The results are expressed using the comparative cycle threshold. The relative changes in the level of a specific gene were calculated with the ΔΔCT formula.
Table 1.
Real‐time PCR primers
| Gene | Forward | Reverse | Amplicon size |
|---|---|---|---|
| C/EBPα | GACCAGAAAGCTGAGTTGTGAG | CCACAAAGCCCAGAAACCTA | 69 bp |
| C/EBPβ | CTCCAGGTAGGGGCTGAAGT | TTTAGACCCATGGAAGTGGC | 150 bp |
| Cyclophilin A | TTCCTCCTTTCACAGAATTATTCCA | CCGCCAGTGCCATTATGG | 75 bp |
| PDGFRα | AAGACCTGGGCAAGAGGAAC | GAACCTGTCTCGATGGCACT | 67 bp |
| PPARγ | GTGCCAGTTTCGATCCGTAGA | GGCCAGCATCGTGTAGATGA | 142 bp |
| rpS9 | CGGCCCGGGAGCTGTTGACG | CTGCTTGCGGACCCTAATGT | 247 bp |
Protein isolation and Western blotting
Muscle samples were homogenized in 10 volumes of lysis buffer [50 mM Tris–HCl (pH 7.5), 150 mM NaCl, 1 mM egtazic acid, 1 mM EDTA, 100 mM NaF, 5 mM Na3VO4, 1% Triton X‐100, 1% sodium dodecyl sulfate (SDS), 40 mM β‐glycerophosphate, and protease inhibitor mixture (P8340; Sigma‐Aldrich)] and centrifuged at 10 000 g for 10 min (4°C). Sixty micrograms of protein extract was loaded into Stain‐Free 4–20% precast gels (4568095; Bio‐Rad) before electrophoretic transfer onto nitrocellulose membranes (Bio‐Rad; Trans‐Blot Turbo Blotting System). After transfer, the membranes were blocked with 50 mM Tris–HCl (pH 7.5), 150 mM NaCl, and 0.1% Tween 20 (Tris‐buffered saline‐T) containing 5% skimmed milk or BSA and incubated overnight at 4°C with primary antibodies. The membranes were then incubated for 1 h with a peroxidase‐conjugated secondary antibody. The immunoblots were revealed using a Pierce ECL kit (32106; Thermo Scientific), and proteins were visualized by enhanced chemiluminescence using the ChemiDoc Touch Imaging System and quantified with Image Lab™ Touch Software (version 5.2.1). Stain‐Free technology was used as the loading control. A large number of methodological studies have already validated this technology and explained its functioning in detail.61, 62, 63, 64, 65, 66, 67, 68
Antibodies
Anti‐laminin (L9393; 1:400) antibody was purchased from Sigma‐Aldrich and secondary antibody Alexa Fluor 488 (A11029; 1:800) was purchased from Invitrogen. Anti‐PDGFRα (#3174), anti‐perilipin (#9349), anti‐FABP4 (#3544) and anti‐C/EBPα (#8178) primary antibodies were purchased from Cell Signalling and used at 1:500 dilution. Anti‐PPARγ (sc‐7273) and anti‐C/EBPβ (sc‐150) primary antibodies were purchased from Santa Cruz and used at 1:200 dilution. Anti‐mouse (sc‐2005) and anti‐rabbit (sc‐2004) HRP‐conjugated secondary antibodies were purchased from Santa Cruz and used at 1:4000 dilution.
Statistics
All values are expressed as the mean ± SEM, and the significance level was set at P < 0.05. Differences between Pre‐DI and Post‐DI were evaluated for significance using the paired Student's t‐test or the Wilcoxon matched‐pairs signed‐rank test when the data deviated from a normal distribution (Shapiro–Wilk normality test). Statistics and graphs were made with GraphPad Prism6 Software.
Results
Dry immersion induces muscle atrophy
To validate the efficiency of DI as a muscle‐deconditioning model, we first quantified the VL myofibers cross‐sectional area (CSA). We observed a significant decrease in the global VL myofiber CSA, reaching 10.6% (Post‐DI vs. Pre‐DI, P = 0.04; Figure 2). The CSA before DI (Pre‐DI) was 6283 μm2, in contrast to 5617 μm2 at the end of the DI protocol (Post‐DI). Therefore, DI rapidly promotes muscle deconditioning in VL.
Figure 2.
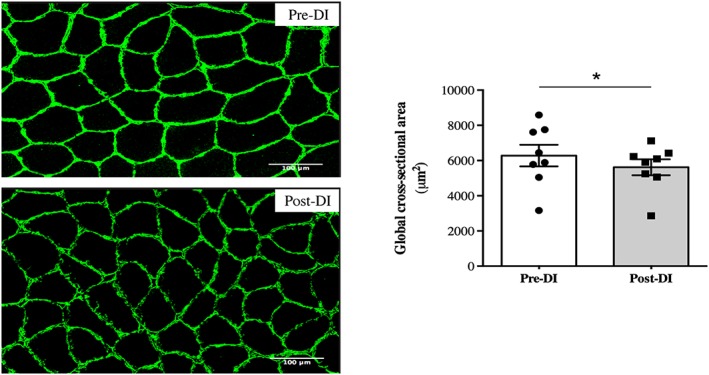
Changes in cross‐sectional area measurements after 3 days of dry immersion. Cross‐sectional area (CSA) measurement of all myofibers from vastus lateralis muscle biopsies taken before (Pre‐DI) and after (Post‐DI) 3 days of dry immersion (DI) with representative transversal muscle sections. * P < 0.05.
Fatty infiltration markers are upregulated after 3 days of dry immersion
We aimed to verify whether IMAT development could arise concomitantly with muscle deconditioning within 3 days of DI. We thus quantified the expression of perilipin and fatty acid binding protein 4 (FABP4), the two major markers of mature adipocytes commonly used in the literature. We observed marked increases in the protein expression levels of perilipin and FABP4 after the dry immersion protocol (+80% [P = 0.03] and +40% [P = 0.048], respectively; Figure 3a). In addition, we analysed IMAT adipocyte CSA and found an increase Post‐DI (Figure 3b). Unfortunately, the number of subjects on which the IMAT CSA measurement could be done was too low to apply powerful statistical tools (n = 4 for Pre‐DI and n = 5 for Post‐DI), and this difference did not reach statistical significance (P = 0.2, Figure 3c).
Figure 3.
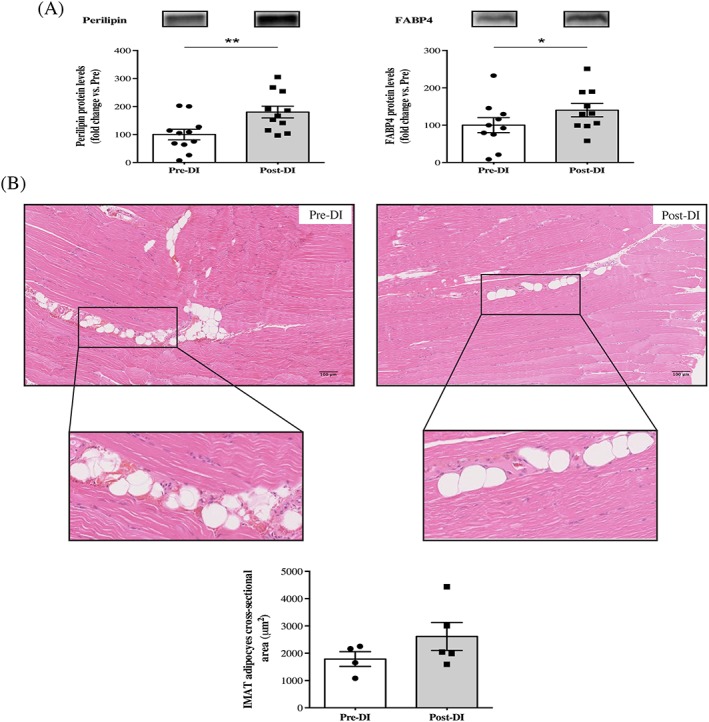
Changes in intermuscular adipose tissue deposition after 3 days of dry immersion. (A) Perilipin and fatty acid binding protein 4 (FABP4) protein levels from vastus lateralis muscle biopsies taken >before (Pre‐DI) and after (Post‐DI) 3 days of dry immersion (DI). (B) Representative histological longitudinal paraffin‐embedded vastus lateralis muscle sections that were obtained from Pre‐DI and Post‐DI muscle biopsies are shown with haematoxylin–eosin‐saffron staining. Intermuscular adipose tissue (IMAT) adipocyte cross‐sectional area measurements are shown in μm2. * P < 0.05 and ** P < 0.01.
Dry immersion enhances the expression of key adipogenic transcription factors
C/EBPβ plays an important role during the early stages of adipogenic differentiation. Interestingly, we did not detect any significant differences in mRNA (−14%, P = 0.23) or protein levels (+6%, P = 0.414) of C/EBPβ after our simulated microgravity protocol (Figure 4a). In light of our previous results regarding mature adipocyte markers, which indicated that the adipogenic process was already greatly engaged, we hypothesized that the later markers of adipogenesis would be differentially expressed. We, therefore, analysed mRNA and protein levels of PPARγ and C/EBPα. Surprisingly, no significant difference was detected for PPARγ mRNA induction (−5%, P = 0.21), whereas an increase in PPARγ protein expression (+64%, P = 0.038; Figure 4b) was observed. Moreover, C/EBPα protein expression increased after dry immersion (+108%, P = 0.022), and we observed a similar increase in C/EBPα mRNA induction (+127%, P = 0.0006; Figure 4c). Consistent with the results for mature adipocyte markers, the elevated expression of C/EBPα and PPARγ after 3 days of DI may also indicate an increase in the late adipogenic processes, leading to IMAT development.
Figure 4.
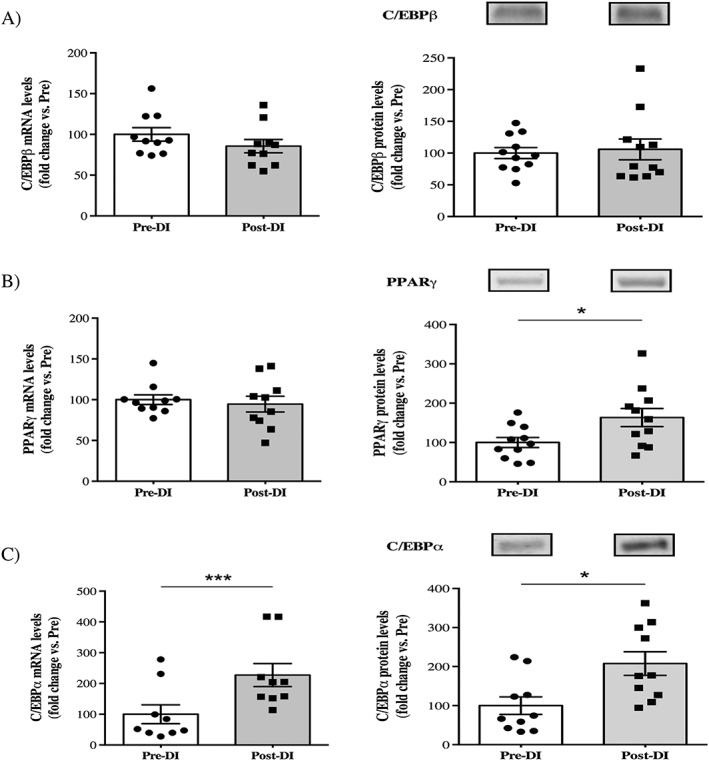
Changes in key adipogenic markers after 3 days of dry immersion. (A) Changes in C/EBPβ mRNA and protein levels in vastus lateralis muscle biopsies taken before (Pre‐DI) and after (Post‐DI) 3 days of dry immersion (DI). (B) Changes in PPARγ mRNA and protein levels in Pre‐DI and Post‐DI muscle biopsies. (C) Changes in C/EBPα mRNA and protein levels in Pre‐DI and Post‐DI muscle biopsies. * P < 0,05 and *** P < 0.001.
Dry immersion promotes fibro‐adipogenic progenitor proliferation
At least in mice, FAPs are well‐known as the major muscle‐resident stem cells implicated in the development of IMAT. We hypothesized that these mesenchymal stem cells, which are positive for and identified in many studies with the cell surface marker PDGFRα, were implicated in the IMAT development observed in our study. We, therefore quantified the mRNA induction and protein levels of PDGFRα after 3 days of DI. We found a minor but significant decrease in the mRNA induction of PDGFRα (−15%, P = 0.019; Figure 5a), whereas the protein levels were clearly enhanced (+47%, P = 0.007; Figure 5a). The change in protein levels was then confirmed by our immunohistochemical analysis (+26%, P = 0.022; Figure 5b). Therefore, in parallel with an increase in mature adipocyte markers and C/EBPα, the increase in PDGFRα expression probably underlines FAP proliferation in response to 3 days of DI. In an unfavourable environment, these FAPs are known to drive IMAT development.
Figure 5.
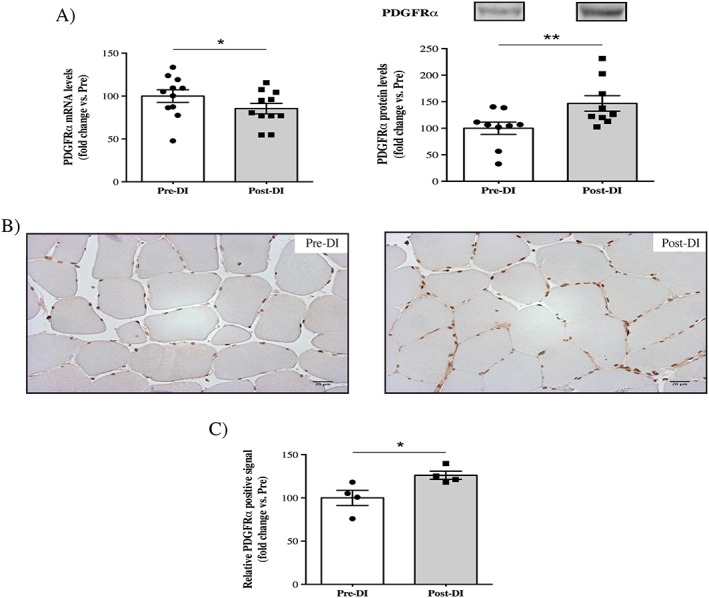
Changes in the fibro‐adipogenic progenitor cell surface marker PDGFRα after 3 days of dry immersion. (A) Changes in PDGFRα mRNA and protein levels in vastus lateralis muscle biopsies taken before (Pre‐DI) and after (Post‐DI) 3 days of dry immersion (DI). (B) Representative histological transversal paraffin‐embedded vastus lateralis muscle sections that were taken from Pre‐DI and Post‐DI muscle biopsies are immunostained with PDGFRα antibody. (C) Quantification of the PDGFRα‐positive signals. * P < 0.05 and ** P < 0.01.
Dry immersion does not increase the expression of fibrosis mRNA markers
FAPs are known to be able to differentiate into either adipocytes or fibroblasts. Therefore, we also quantified some key markers to evaluate the increase in extracellular matrix deposition, leading to fibrosis deposition (Figure 6). We found a clear decrease in the mRNA induction of α‐SMA (−60%; P = 0.0002) and connective tissue growth factor (−50%, P = 0.001) after 3 days of DI. Moreover, we did not find any differences in the mRNA induction of fibronectin (−10%, P = 0.197) and type 1α collagen (Col1a1; +104%, P = 0.148). These results may indicate that dry immersion for 3 days does not promote fibrosis development.
Figure 6.
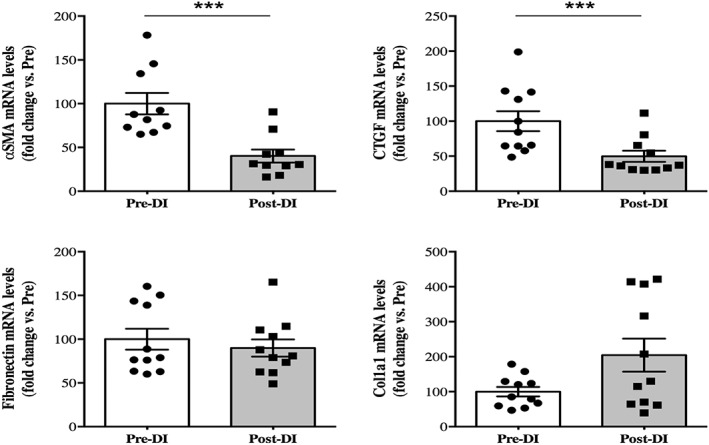
Changes in key fibrosis markers after 3 days of dry immersion. Changes in α‐smooth muscle actin, connective tissue growth factor (CTGF), fibronectin, and Col1a1 mRNA levels in vastus lateralis muscle biopsies taken before (Pre‐DI) and after (Post‐DI) 3 days of dry immersion (DI). *** P < 0.001.
Discussion
Identification of cost‐effective interventions to maintain muscle mass, muscle strength, and physical performance is a major public health challenge. It requires understanding the cellular, molecular, and systemic mechanisms as well as the underlying pathways involved in muscle deconditioning development. In the past decade, studies have increasingly recognized the importance of fatty infiltrations for the age‐mediated loss of skeletal‐muscle function and emphasized that this new important factor is closely linked to inactivity. Therefore, the main objective of this study was to characterize the effects of rapid and profound inactivity on the early mechanisms of IMAT development. For that purpose, we used the innovative muscle‐deconditioning model of DI model, for the first time in Europe in this experiment. Our study shows for the first time that severe inactivity for only 3 days was able to induce increased expression of the key markers of IMAT development, concomitant with muscle deconditioning.
Skeletal muscle atrophy in humans has already been observed in many studies related to muscle unloading but mainly using long‐duration protocols.5, 15, 69, 70, 71 Indeed, few studies have examined the effects on muscle unloading over short periods. The study by Edgerton et al.72 demonstrated a significant decrease in VL CSA after 11 days of real space flight (−16% for MyHCI and −36% for MyHCII). Within the specific context of DI, a decrease in the CSA of both slow and fast myofibers has already been reported after 3 days (5–9%) and 7 days (15–18%).49, 55 In our study, we observed a global decrease in VL myofiber CSA after only 3 days of DI (10.6%). Our results are thus in accordance with those of previous studies, demonstrating that conducting this protocol for only 3 days is able to induce muscle atrophy.
Our study was dedicated to investigating IMAT development. Fatty infiltration development is an important characteristic of muscle deconditioning and has been particularly studied in relation to ageing, obesity or inactivity.12, 19 No study conducted in humans has examined the effects of microgravity or simulated microgravity on specific IMAT development. In a closed context, Manini et al.9 have demonstrated that unilateral limb suspension of healthy young adults for 4 weeks was sufficient to induce a major increase in the IMAT content. Indeed, these authors found IMAT content increases of approximately 15% in the thighs and 20% in the calves of young healthy men. In our study, we found a clear increase in two key mature adipocytes markers: FABP4 and perilipin. These two markers are commonly used in the literature to evaluate IMAT deposition,10, 38, 39, 73, 74 and their increase highlights that DI for only 3 days might induce IMAT accumulation or at least their development. These results were supported by increases in the mRNA and protein expression levels of key adipogenic markers after DI. Indeed, we found clear increases in the protein expression levels of PPARγ and C/EBPα, while only the mRNA level of C/EBPα was enhanced. PPARγ and C/EBPα are transcription factors that are required to induce adipocyte development, and their deletion in mice leads to adipocyte formation dysfunction and premature death.75, 76, 77, 78 Taken together, these results emphasize that muscle deconditioning for only 3 days was able to promote fatty infiltration development. This result must be linked with that of St‐Jean‐Pelletier et al.79 who showed that a sedentary lifestyle more than ageing per se was related to an increase in intramyocellular lipid content in type I muscle fibres. We did not study here the intramyocellular lipid content, but it will be interesting in future muscle disuse experiments to verify if it increases parallel to IMAT development. Thus, age‐related IMAT and fibre‐type specific intramyocellular content seem to evolve concomitantly, with physical inactivity more than aging being the discriminant factor. In the same way, because obesity is linked to sedentary lifestyle, a prior history of obesity could be responsible of large inter‐individual variability in IMAT development in such models.80
Another point raised by our study was the expected increase in the expression of PDGFRα, a key cell surface marker of FAPs. According to recent animal studies focused on IMAT development and muscle‐resident stem cells, FAPs may be the main sources of IMAT during altered muscle homeostasis.38, 39, 40, 74, 81, 82 More recent studies conducted in humans also suggest that FAPs may be the stem cell population that promotes IMAT development.83, 84, 85 Our study is the first to show an increase in PDGFRα expression, indicative of FAP proliferation, after 3 days of DI‐mediated muscle deconditioning. In this unfavourable muscular environment, FAPs may be the main source of fatty infiltration development. Indeed, numerous papers have already demonstrated that FAPs are highly influenced by their environment. For example, Uezumi et al.38 showed that FAPs isolated from glycerol‐injected muscles did not differentiate into adipocytes in CTX‐injected muscles, and in contrast, those isolated from cardiotoxin‐injected muscles accumulated in degenerated areas and differentiated into adipocytes in glycerol‐injected muscles. Interestingly, Mozzetta et al.81 showed that FAPs were sensitive to adipogenesis inhibition mediated by HDAC inhibitors in young mdx mice, while the same treatment was not as effective in old mdx mice. These studies clearly showed that the surrounding muscle environment largely regulates the fate of FAPs. In our study, we found increased expression of many key markers linked to mature adipocyte accumulation and adipogenesis, but we did not observe increases in fibrosis markers. These results indicate a probable increase in IMAT content in the absence of fibrosis development. Therefore, one could hypothesize that the muscle‐deconditioning environment created by only 3 days of DI would favour FAP proliferation and drive these cells to an adipogenic lineage instead of a fibrogenic one, thereby leading to ectopic adiposity in muscles.
One of the most striking results of our study is that if we assume that FAPs are the main source of ectopic adiposity in muscles, then PDGFRα‐positive FAPs were activated and able to differentiate into mature adipocytes after only 3 days of muscle deconditioning. Classification and properties of muscle‐resident progenitors, including FAPs, have not been fully characterized. Satellite cells (SCs), the most studied stem cells in skeletal muscle, are known to have different proliferation and differentiation abilities.86, 87, 88, 89, 90 For example, Rantanen et al.91 observed an increase in myogenin mRNA as early as 4 and 8 h after injury. Thus, in a few hours after injury, some SCs are already able to differentiate, even before the first signs of SC proliferation, which appeared only 24 h post‐injury in that study. In addition, a study by Drummond et al.92 also demonstrated an increase in myogenin protein expression 6 h after resistance exercise (generating micro lesions), whereas MyoD protein expression remained unchanged until 48 h after exercise. These studies suggested that an SCs subpopulation could differentiate immediately after muscle injury without entering into the proliferation stage, instead of the well‐known proliferation and differentiation phases of the major SC populations. To reconcile our results that showed an increase in late adipogenic markers only (PPARγ and C/EBPα), one can hypothesize that similar to these SCs, FAPs may constitute a heterogeneous population and have a subset that is able to differentiate early under muscle disuse conditions.
Limitations and conclusion
It is important to note that our study was conducted in healthy and physically active adult men, and that IMAT development often associated with sarcopenia, frailty, insulin‐resistance, and mobility limitations states12, 19, 93 may respond differently to inactivity depending on the individual's gender, age, prior obesity and/or physical activity levels.21, 79, 80, 94, 95 For example, it could be interesting and helpful to study muscle disuse induced IMAT development in individuals with a prior history of obesity compared to lean ones in order to fully understand the different mechanisms underlying these variations. This would allow one to can ask whether childhood BMI of our subjects could explain the inter‐individual variations found in our study for IMAT development. Therefore, future studies are needed to investigate and understand IMAT development in selected populations.
To conclude, our study is the first to show that a short period of muscle disuse, mediated by the innovative dry immersion model, is able to induce IMAT development concomitant with muscle deconditioning. Our study also reveals that FAPs could be the resident muscle stem cell population implicated in IMAT development. Further studies are needed to explore efficient strategies to counteract this phenomenon that impairs muscle function.
Conflict of interest
The authors declare that the research was conducted in the absence of any commercial or financial relationships that could be construed as a potential conflict of interest.
Acknowledgements
We would particularly like to thank all the staff working in the Space Clinic of the Institute of Space Medicine and Physiology (Medes‐IMPS) in Toulouse for having organized and carried out these experiments, especially Marie‐Pierre Bareille and Arnaud Beck. We want to thank Professors Jacques Mercier and Maurice Hayot for their excellent biopsy procedures and the subjects for their participation in this project. We also greatly acknowledge the ‘Réseau d'Histologie Expérimentale de Montpellier’ (RHEM) platform for histology core facilities and paraffin processing of the muscle biopsies, especially Nelly Pirot, Florence Bernex, Charlène Berthet, Yohan Noël, and Laura De Oliveira. We also thank Nadine Adam for her helpful English corrections. The authors of this manuscript certify that they have complied with ethical guidelines for authorship and publishing in the Journal of Cachexia, Sarcopenia and Muscle.96
This work was supported by the Centre National d'Etudes Spatiales (CNES).
Pagano, A. F. , Brioche, T. , Arc‐Chagnaud, C. , Demangel, R. , Chopard, A. , and Py, G. (2018) Short‐term disuse promotes fatty acid infiltration into skeletal muscle. Journal of Cachexia, Sarcopenia and Muscle, 9: 335–347. doi: 10.1002/jcsm.12259.
References
- 1. Reid KF, Fielding RA. Skeletal muscle power: a critical determinant of physical functioning in older adults. Exerc Sport Sci Rev 2012;40:4–12. [DOI] [PMC free article] [PubMed] [Google Scholar]
- 2. Sartorelli V, Fulco M. Molecular and cellular determinants of skeletal muscle atrophy and hypertrophy. Science's STKE : signal transduction knowledge environment 2004;2004: re11. [DOI] [PubMed] [Google Scholar]
- 3. Egan B, Zierath JR. Exercise metabolism and the molecular regulation of skeletal muscle adaptation. Cell Metab 2013;17:162–184. [DOI] [PubMed] [Google Scholar]
- 4. Begue G, Douillard A, Galbes O, Rossano B, Vernus B, Candau R, et al. Early activation of rat skeletal muscle IL‐6/STAT1/STAT3 dependent gene expression in resistance exercise linked to hypertrophy. PloS one 2013;8: e57141. [DOI] [PMC free article] [PubMed] [Google Scholar]
- 5. Baldwin KM, Haddad F, Pandorf CE, Roy RR, Edgerton VR. Alterations in muscle mass and contractile phenotype in response to unloading models: role of transcriptional/pretranslational mechanisms. Front Physiol 2013;4:284. [DOI] [PMC free article] [PubMed] [Google Scholar]
- 6. Cros N, Muller J, Bouju S, Pietu G, Jacquet C, Leger JJ, et al. Upregulation of M‐creatine kinase and glyceraldehyde3‐phosphate dehydrogenase: two markers of muscle disuse. Am J Physiol 1999;276:R308–R316. [DOI] [PubMed] [Google Scholar]
- 7. Hanson AM, Harrison BC, Young MH, Stodieck LS, Ferguson VL. Longitudinal characterization of functional, morphologic, and biochemical adaptations in mouse skeletal muscle with hindlimb suspension. Muscle Nerve 2013;48:393–402. [DOI] [PubMed] [Google Scholar]
- 8. Kawashima S, Akima H, Kuno SY, Gunji A, Fukunaga T. Human adductor muscles atrophy after short duration of unweighting. Eur J Appl Physiol 2004;92:602–605. [DOI] [PubMed] [Google Scholar]
- 9. Manini TM, Clark BC, Nalls MA, Goodpaster BH, Ploutz‐Snyder LL, Harris TB. Reduced physical activity increases intermuscular adipose tissue in healthy young adults. Am J Clin Nutr 2007;85:377–384. [DOI] [PubMed] [Google Scholar]
- 10. Pagano AF, Demangel R, Brioche T, Jublanc E, Bertrand‐Gaday C, Candau R, et al. Muscle regeneration with intermuscular adipose tissue (IMAT) accumulation is modulated by mechanical constraints. PloS one 2015;10: e0144230. [DOI] [PMC free article] [PubMed] [Google Scholar]
- 11. Chopard A, Hillock S, Jasmin BJ. Molecular events and signalling pathways involved in skeletal muscle disuse‐induced atrophy and the impact of countermeasures. J Cell Mol Med 2009;13:3032–3050. [DOI] [PMC free article] [PubMed] [Google Scholar]
- 12. Brioche T, Pagano AF, Py G, Chopard A. Muscle wasting and aging: experimental models, fatty infiltrations, and prevention. Mol Aspects Med 2016;https://doi.org/10.1016/j.mam.2016.04.006. [DOI] [PubMed] [Google Scholar]
- 13. Cruz‐Jentoft AJ, Baeyens JP, Bauer JM, Boirie Y, Cederholm T, Landi F, et al. Sarcopenia: European consensus on definition and diagnosis: Report of the European Working Group on Sarcopenia in Older People. Age Ageing 2010;39:412–423. [DOI] [PMC free article] [PubMed] [Google Scholar]
- 14. Fielding RA, Vellas B, Evans WJ, Bhasin S, Morley JE, Newman AB, et al. Sarcopenia: an undiagnosed condition in older adults. Current consensus definition: prevalence, etiology, and consequences. International working group on sarcopenia. J Am Med Dir Assoc 2011;12:249–256. [DOI] [PMC free article] [PubMed] [Google Scholar]
- 15. Berg HE, Larsson L, Tesch PA. Lower limb skeletal muscle function after 6 wk of bed rest. J Appl Physiol (1985) 1997;82:182–188. [DOI] [PubMed] [Google Scholar]
- 16. Delmonico MJ, Harris TB, Visser M, Park SW, Conroy MB, Velasquez‐Mieyer P, et al. Longitudinal study of muscle strength, quality, and adipose tissue infiltration. Am J Clin Nutr 2009;90:1579–1585. [DOI] [PMC free article] [PubMed] [Google Scholar]
- 17. Di Prampero PE, Narici MV. Muscles in microgravity: from fibres to human motion. J Biomech 2003;36:403–412. [DOI] [PubMed] [Google Scholar]
- 18. Jubrias SA, Odderson IR, Esselman PC, Conley KE. Decline in isokinetic force with age: muscle cross‐sectional area and specific force. Pflugers Archiv : European journal of physiology 1997;434:246–253. [DOI] [PubMed] [Google Scholar]
- 19. Addison O, Marcus RL, Lastayo PC, Ryan AS. Intermuscular fat: a review of the consequences and causes. International journal of endocrinology 2014;2014:309570. [DOI] [PMC free article] [PubMed] [Google Scholar]
- 20. Vettor R, Milan G, Franzin C, Sanna M, De Coppi P, Rizzuto R, et al. The origin of intermuscular adipose tissue and its pathophysiological implications. Am J Physiol Endocrinol Metab 2009;297:E987–E998. [DOI] [PubMed] [Google Scholar]
- 21. Marcus RL, Addison O, Kidde JP, Dibble LE, Lastayo PC. Skeletal muscle fat infiltration: impact of age, inactivity, and exercise. J Nutr Health Aging 2010;14:362–366. [DOI] [PMC free article] [PubMed] [Google Scholar]
- 22. Sciorati C, Clementi E, Manfredi AA, Rovere‐Querini P. Fat deposition and accumulation in the damaged and inflamed skeletal muscle: cellular and molecular players. Cellular and molecular life sciences : CMLS 2015;https://doi.org/10.1007/s00018-015-1857-7. [DOI] [PMC free article] [PubMed] [Google Scholar]
- 23. Uezumi A, Ikemoto‐Uezumi M, Tsuchida K. Roles of nonmyogenic mesenchymal progenitors in pathogenesis and regeneration of skeletal muscle. Front Physiol. 2014;5:68. [DOI] [PMC free article] [PubMed] [Google Scholar]
- 24. Leskinen T, Sipila S, Alen M, Cheng S, Pietilainen KH, Usenius JP, et al. Leisure‐time physical activity and high‐risk fat: a longitudinal population‐based twin study. Int J Obes (Lond) 2009;33:1211–1218. [DOI] [PubMed] [Google Scholar]
- 25. Tuttle LJ, Sinacore DR, Cade WT, Mueller MJ. Lower physical activity is associated with higher intermuscular adipose tissue in people with type 2 diabetes and peripheral neuropathy. Phys Ther 2011;91:923–930. [DOI] [PMC free article] [PubMed] [Google Scholar]
- 26. Ceylan O, Seyfettinoglu F, Dulgeroglu AM, Avci A, Bayram B, Bora OA. Histomorphological comparison of immobilization and denervation atrophies. Acta Orthop Traumatol Turc 2014;48:320–325. [DOI] [PubMed] [Google Scholar]
- 27. Dulor JP, Cambon B, Vigneron P, Reyne Y, Nougues J, Casteilla L, et al. Expression of specific white adipose tissue genes in denervation‐induced skeletal muscle fatty degeneration. FEBS Lett 1998;439:89–92. [DOI] [PubMed] [Google Scholar]
- 28. Gallagher D, Heshka S, Kelley DE, Thornton J, Boxt L, Pi‐Sunyer FX, et al. Changes in adipose tissue depots and metabolic markers following a 1‐year diet and exercise intervention in overweight and obese patients with type 2 diabetes. Diabetes Care 2014;37:3325–3332. [DOI] [PMC free article] [PubMed] [Google Scholar]
- 29. Goodpaster BH, Kelley DE, Wing RR, Meier A, Thaete FL. Effects of weight loss on regional fat distribution and insulin sensitivity in obesity. Diabetes 1999;48:839–847. [DOI] [PubMed] [Google Scholar]
- 30. Karampinos DC, Baum T, Nardo L, Alizai H, Yu H, Carballido‐Gamio J, et al. Characterization of the regional distribution of skeletal muscle adipose tissue in type 2 diabetes using chemical shift‐based water/fat separation. Journal of magnetic resonance imaging : JMRI 2012;35:899–907. [DOI] [PMC free article] [PubMed] [Google Scholar]
- 31. Kuzel BR, Grindel S, Papandrea R, Ziegler D. Fatty infiltration and rotator cuff atrophy. J Am Acad Orthop Surg 2013;21:613–623. [DOI] [PubMed] [Google Scholar]
- 32. Laron D, Samagh SP, Liu X, Kim HT, Feeley BT. Muscle degeneration in rotator cuff tears. J Shoulder Elbow Surg 2012;21:164–174. [DOI] [PubMed] [Google Scholar]
- 33. Song MY, Ruts E, Kim J, Janumala I, Heymsfield S, Gallagher D. Sarcopenia and increased adipose tissue infiltration of muscle in elderly African American women. Am J Clin Nutr 2004;79:874–880. [DOI] [PubMed] [Google Scholar]
- 34. Tuttle LJ, Sinacore DR, Mueller MJ. Intermuscular adipose tissue is muscle specific and associated with poor functional performance. J Aging Res 2012;2012:172957. [DOI] [PMC free article] [PubMed] [Google Scholar]
- 35. Beavers KM, Beavers DP, Houston DK, Harris TB, Hue TF, Koster A, et al. Associations between body composition and gait‐speed decline: results from the Health, Aging, and Body Composition study. Am J Clin Nutr 2013;97:552–560. [DOI] [PMC free article] [PubMed] [Google Scholar]
- 36. Visser M, Goodpaster BH, Kritchevsky SB, Newman AB, Nevitt M, Rubin SM, et al. Muscle mass, muscle strength, and muscle fat infiltration as predictors of incident mobility limitations in well‐functioning older persons. J Gerontol A Biol Sci Med Sci 2005;60:324–333. [DOI] [PubMed] [Google Scholar]
- 37. Schafer AL, Vittinghoff E, Lang TF, Sellmeyer DE, Harris TB, Kanaya AM, et al. Fat infiltration of muscle, diabetes, and clinical fracture risk in older adults. J Clin Endocrinol Metab 2010;95:E368–E372. [DOI] [PMC free article] [PubMed] [Google Scholar]
- 38. Uezumi A, Fukada S, Yamamoto N, Takeda S, Tsuchida K. Mesenchymal progenitors distinct from satellite cells contribute to ectopic fat cell formation in skeletal muscle. Nat Cell Biol 2010;12:143–152. [DOI] [PubMed] [Google Scholar]
- 39. Heredia JE, Mukundan L, Chen FM, Mueller AA, Deo RC, Locksley RM, et al. Type 2 innate signals stimulate fibro/adipogenic progenitors to facilitate muscle regeneration. Cell 2013;153:376–388. [DOI] [PMC free article] [PubMed] [Google Scholar]
- 40. Uezumi A, Ito T, Morikawa D, Shimizu N, Yoneda T, Segawa M, et al. Fibrosis and adipogenesis originate from a common mesenchymal progenitor in skeletal muscle. J Cell Sci 2011;124:3654–3664. [DOI] [PubMed] [Google Scholar]
- 41. Farr JN, Van Loan MD, Lohman TG, Going SB. Lower physical activity is associated with skeletal muscle fat content in girls. Med Sci Sports Exerc 2012;44:1375–1381. [DOI] [PMC free article] [PubMed] [Google Scholar]
- 42. Derbre F, Gratas‐Delamarche A, Gomez‐Cabrera MC, Vina J. Inactivity‐induced oxidative stress: a central role in age‐related sarcopenia? European journal of sport science 2014;14:S98–108. [DOI] [PubMed] [Google Scholar]
- 43. Wroblewski AP, Amati F, Smiley MA, Goodpaster B, Wright V. Chronic exercise preserves lean muscle mass in masters athletes. Phys Sportsmed 2011;39:172–178. [DOI] [PubMed] [Google Scholar]
- 44. Buehlmeier J, Mulder E, Noppe A, Frings‐Meuthen P, Angerer O, Rudwill F, et al. A combination of whey protein and potassium bicarbonate supplements during head‐down‐tilt bedrest: presentation of a multidisciplinary randomized controlled trial (MEPstudy). Acta Astronaut 2013;95:82–91. [Google Scholar]
- 45. Chopard A, Arrighi N, Carnino A, Marini JF. Changes in dysferlin, proteins from dystrophin glycoprotein complex, costameres, and cytoskeleton in human soleus and vastus lateralis muscles after a long‐term bedrest with or without exercise. FASEB journal : official publication of the Federation of American Societies for Experimental Biology 2005;19:1722–1724. [DOI] [PubMed] [Google Scholar]
- 46. Chopard A, Lecunff M, Danger R, Lamirault G, Bihouee A, Teusan R, et al. Large‐scale mRNA analysis of female skeletal muscles during 60 days of bed rest with and without exercise or dietary protein supplementation as countermeasures. Physiol Genomics 2009;38:291–302. [DOI] [PubMed] [Google Scholar]
- 47. Mutin‐Carnino M, Carnino A, Roffino S, Chopard A. Effect of muscle unloading, reloading and exercise on inflammation during a head‐down bed rest. Int J Sports Med 2014;35:28–34. [DOI] [PubMed] [Google Scholar]
- 48. Arentson‐Lantz E, English KL, Paddon‐Jones D, Fry CS. 14 days of bed rest induces a decline in satellite cell content and robust atrophy of skeletal muscle fibers in middle‐aged adults. J Appl Physiol (1985) 2016; jap 00799 2015. doi:https://doi.org/10.1152/japplphysiol.00799.2015. [DOI] [PMC free article] [PubMed] [Google Scholar]
- 49. Navasiolava NM, Custaud MA, Tomilovskaya ES, Larina IM, Mano T, Gauquelin‐Koch G, et al. Long‐term dry immersion: review and prospects. Eur J Appl Physiol 2011;111:1235–1260. [DOI] [PubMed] [Google Scholar]
- 50. Treffel L, Mkhitaryan K, Gellee S, Gauquelin‐Koch G, Gharib C, Blanc S, et al. Intervertebral Disc Swelling Demonstrated by 3D and Water Content Magnetic Resonance Analyses after a 3‐Day Dry Immersion Simulating Microgravity. Front Physiol 2016;7:605. [DOI] [PMC free article] [PubMed] [Google Scholar]
- 51. Shulzhenko EB, Vil‐Vilyams IF, Khudyakova MA, Grigoryev AI. Deconditioning during prolonged immersion and possible countermeasures. Life Sci Space Res 1976;14:289–294. [PubMed] [Google Scholar]
- 52. Litvinova KS, Vikhlyantsev IM, Kozlovskaya IB, Podlubnaya ZA, Shenkman BS. Effects of artificial support stimulation on fiber and molecular characteristics of soleus muscle in men exposed to 7‐day dry immersion. Journal of gravitational physiology : a journal of the International Society for Gravitational Physiology. 2004;11:P131–P132. [PubMed] [Google Scholar]
- 53. Moukhina A, Shenkman B, Blottner D, Nemirovskaya T, Lemesheva Y, Puttmann B, et al. Effects of support stimulation on human soleus fiber characteristics during exposure to ‘dry’ immersion. Journal of gravitational physiology : a journal of the International Society for Gravitational Physiology 2004;11:P137–P138. [PubMed] [Google Scholar]
- 54. Shenkman BS, Kozlovskaya IB, Nemirovskaya TL, Tcheglova IA. Human muscle atrophy in supportlessness: effects of short‐term exposure to dry immersion. Journal of gravitational physiology : a journal of the International Society for Gravitational Physiology. 1997;4:P137–P138. [PubMed] [Google Scholar]
- 55. Shenkman BS, Podlubnaia ZA, Vikhliantsev IM, Litvinova KS, Udal'tsov SN, Nemirovskaia TL, et al. Human soleus fibers contractile characteristics and sarcomeric cytoskeletal proteins after gravitational unloading. Contribution of support stimulus. Biofizika 2004;49:881–890. [PubMed] [Google Scholar]
- 56. Demangel R, Treffel L, Py G, Brioche T, Pagano AF, Bareille MP, et al. Early structural and functional signature of 3‐day human skeletal muscle disuse using the dry immersion model. J Physiol 2017;https://doi.org/10.1113/JP273895. [DOI] [PMC free article] [PubMed] [Google Scholar]
- 57. Treffel L, Dmitrieva L, Gauquelin‐Koch G, Custaud MA, Blanc S, Gharib C, et al. Craniomandibular system and postural balance after 3‐day dry immersion. PloS one 2016;11: e0150052. [DOI] [PMC free article] [PubMed] [Google Scholar]
- 58. Bergstrom J. Percutaneous needle biopsy of skeletal muscle in physiological and clinical research. Scand J Clin Lab Invest 1975;35:609–616. [PubMed] [Google Scholar]
- 59. Pirot N, Delpech H, Deleuze V, Dohet C, Courtade‐Saidi M, Basset‐Leobon C, et al. Lung endothelial barrier disruption in Lyl1‐deficient mice. Am J Physiol Lung Cell Mol Physiol 2014;306:L775–L785. [DOI] [PubMed] [Google Scholar]
- 60. Imbeaud S, Graudens E, Boulanger V, Barlet X, Zaborski P, Eveno E, et al. Towards standardization of RNA quality assessment using user‐independent classifiers of microcapillary electrophoresis traces. Nucleic Acids Res 2005;33: e56. [DOI] [PMC free article] [PubMed] [Google Scholar]
- 61. Vigelso A, Dybboe R, Hansen CN, Dela F, Helge JW, Guadalupe‐Grau A. GAPDH and beta‐actin protein decreases with aging making Stain‐Free technology a superior loading control in Western blotting of human skeletal muscle. J Appl Physiol (1985) 2014; jap 00840 2014. doi:https://doi.org/10.1152/japplphysiol.00840.2014. [DOI] [PubMed] [Google Scholar]
- 62. Faden F, Eschen‐Lippold L, Dissmeyer N. Normalized quantitative Western blotting based on standardized fluorescent labeling. Methods Mol Biol 2016;1450:247–258. [DOI] [PubMed] [Google Scholar]
- 63. Zeitler AF, Gerrer KH, Haas R, Jimenez‐Soto LF. Optimized semi‐quantitative blot analysis in infection assays using the Stain‐Free technology. J Microbiol Methods 2016;126:38–41. [DOI] [PubMed] [Google Scholar]
- 64. Gilda JE, Gomes AV. Western blotting using in‐gel protein labeling as a normalization control: stain‐free technology. Methods Mol Biol 2015;1295:381–391. [DOI] [PubMed] [Google Scholar]
- 65. Rivero‐Gutierrez B, Anzola A, Martinez‐Augustin O, de Medina FS. Stain‐free detection as loading control alternative to Ponceau and housekeeping protein immunodetection in Western blotting. Anal Biochem 2014;467:1–3. [DOI] [PubMed] [Google Scholar]
- 66. Gilda JE, Gomes AV. Stain‐Free total protein staining is a superior loading control to beta‐actin for Western blots. Anal Biochem 2013;440:186–188. [DOI] [PMC free article] [PubMed] [Google Scholar]
- 67. Gurtler A, Kunz N, Gomolka M, Hornhardt S, Friedl AA, McDonald K, et al. Stain‐Free technology as a normalization tool in Western blot analysis. Anal Biochem 2013;433:105–111. [DOI] [PubMed] [Google Scholar]
- 68. Colella AD, Chegenii N, Tea MN, Gibbins IL, Williams KA, Chataway TK. Comparison of Stain‐Free gels with traditional immunoblot loading control methodology. Anal Biochem 2012;430:108–110. [DOI] [PubMed] [Google Scholar]
- 69. Trappe S, Costill D, Gallagher P, Creer A, Peters JR, Evans H, et al. Exercise in space: human skeletal muscle after 6 months aboard the International Space Station. J Appl Physiol (1985) 2009;106:1159–1168. [DOI] [PubMed] [Google Scholar]
- 70. Trappe S, Trappe T, Gallagher P, Harber M, Alkner B, Tesch P. Human single muscle fibre function with 84 day bed‐rest and resistance exercise. J Physiol 2004;557:501–513. [DOI] [PMC free article] [PubMed] [Google Scholar]
- 71. Fitts RH, Trappe SW, Costill DL, Gallagher PM, Creer AC, Colloton PA, et al. Prolonged space flight‐induced alterations in the structure and function of human skeletal muscle fibres. J Physiol 2010;588:3567–3592. [DOI] [PMC free article] [PubMed] [Google Scholar]
- 72. Edgerton VR, Zhou MY, Ohira Y, Klitgaard H, Jiang B, Bell G, et al. Human fiber size and enzymatic properties after 5 and 11 days of spaceflight. J Appl Physiol (1985) 1995;78:1733–1739. [DOI] [PubMed] [Google Scholar]
- 73. Lukjanenko L, Brachat S, Pierrel E, Lach‐Trifilieff E, Feige JN. Genomic profiling reveals that transient adipogenic activation is a hallmark of mouse models of skeletal muscle regeneration. PloS one. 2013;8: e71084. [DOI] [PMC free article] [PubMed] [Google Scholar]
- 74. Joe AW, Yi L, Natarajan A, Le Grand F, So L, Wang J, et al. Muscle injury activates resident fibro/adipogenic progenitors that facilitate myogenesis. Nat Cell Biol 2010;12:153–163. [DOI] [PMC free article] [PubMed] [Google Scholar]
- 75. Wu Z, Rosen ED, Brun R, Hauser S, Adelmant G, Troy AE, et al. Cross‐regulation of C/EBP alpha and PPAR gamma controls the transcriptional pathway of adipogenesis and insulin sensitivity. Mol Cell 1999;3:151–158. [DOI] [PubMed] [Google Scholar]
- 76. Linhart HG, Ishimura‐Oka K, DeMayo F, Kibe T, Repka D, Poindexter B, et al. C/EBPalpha is required for differentiation of white, but not brown, adipose tissue. Proc Natl Acad Sci U S A 2001;98:12532–12537. [DOI] [PMC free article] [PubMed] [Google Scholar]
- 77. Barak Y, Nelson MC, Ong ES, Jones YZ, Ruiz‐Lozano P, Chien KR, et al. PPAR gamma is required for placental, cardiac, and adipose tissue development. Mol Cell 1999;4:585–595. [DOI] [PubMed] [Google Scholar]
- 78. Rosen ED, Sarraf P, Troy AE, Bradwin G, Moore K, Milstone DS, et al. PPAR gamma is required for the differentiation of adipose tissue in vivo and in vitro. Mol Cell 1999;4:611–617. [DOI] [PubMed] [Google Scholar]
- 79. St‐Jean‐Pelletier F, Pion CH, Leduc‐Gaudet JP, Sgarioto N, Zovile I, Barbat‐Artigas S, et al. The impact of ageing, physical activity, and pre‐frailty on skeletal muscle phenotype, mitochondrial content, and intramyocellular lipids in men. J Cachexia Sarcopenia Muscle 2017;8:213–228. [DOI] [PMC free article] [PubMed] [Google Scholar]
- 80. Tyrovolas S, Koyanagi A, Olaya B, Ayuso‐Mateos JL, Miret M, Chatterji S, et al. Factors associated with skeletal muscle mass, sarcopenia, and sarcopenic obesity in older adults: a multi‐continent study. J Cachexia Sarcopenia Muscle 2016;7:312–321. [DOI] [PMC free article] [PubMed] [Google Scholar]
- 81. Mozzetta C, Consalvi S, Saccone V, Tierney M, Diamantini A, Mitchell KJ, et al. Fibroadipogenic progenitors mediate the ability of HDAC inhibitors to promote regeneration in dystrophic muscles of young, but not old Mdx mice. EMBO Mol Med 2013;5:626–639. [DOI] [PMC free article] [PubMed] [Google Scholar]
- 82. Sohn J, Lu A, Tang Y, Wang B, Huard J. Activation of non‐myogenic mesenchymal stem cells during the disease progression in dystrophic dystrophin/utrophin knockout mice. Hum Mol Genet 2015;https://doi.org/10.1093/hmg/ddv125. [DOI] [PMC free article] [PubMed] [Google Scholar]
- 83. Uezumi A, Fukada S, Yamamoto N, Ikemoto‐Uezumi M, Nakatani M, Morita M, et al. Identification and characterization of PDGFRalpha(+) mesenchymal progenitors in human skeletal muscle. Cell Death Dis 2014;5: e1186. [DOI] [PMC free article] [PubMed] [Google Scholar]
- 84. Laurens C, Louche K, Sengenes C, Coue M, Langin D, Moro C, et al. Adipogenic progenitors from obese human skeletal muscle give rise to functional white adipocytes that contribute to insulin resistance. Int J Obes (Lond) 2015;https://doi.org/10.1038/ijo.2015.193. [DOI] [PubMed] [Google Scholar]
- 85. Arrighi N, Moratal C, Clement N, Giorgetti‐Peraldi S, Peraldi P, Loubat A, et al. Characterization of adipocytes derived from fibro/adipogenic progenitors resident in human skeletal muscle. Cell Death Dis 2015;6: e1733. [DOI] [PMC free article] [PubMed] [Google Scholar]
- 86. Schultz E. Satellite cell proliferative compartments in growing skeletal muscles. Dev Biol 1996;175:84–94. [DOI] [PubMed] [Google Scholar]
- 87. Tierney MT, Sacco A. Satellite cell heterogeneity in skeletal muscle homeostasis. Trends Cell Biol 2016;https://doi.org/10.1016/j.tcb.2016.02.004. [DOI] [PMC free article] [PubMed] [Google Scholar]
- 88. Motohashi N, Asakura A. Muscle satellite cell heterogeneity and self‐renewal. Front Cell Dev Biol 2014;2:1. [DOI] [PMC free article] [PubMed] [Google Scholar]
- 89. Collins CA, Olsen I, Zammit PS, Heslop L, Petrie A, Partridge TA, et al. Stem cell function, self‐renewal, and behavioral heterogeneity of cells from the adult muscle satellite cell niche. Cell 2005;122:289–301. [DOI] [PubMed] [Google Scholar]
- 90. Ono Y, Masuda S, Nam HS, Benezra R, Miyagoe‐Suzuki Y, Takeda S. Slow‐dividing satellite cells retain long‐term self‐renewal ability in adult muscle. J Cell Sci 2012;125:1309–1317. [DOI] [PubMed] [Google Scholar]
- 91. Rantanen J, Hurme T, Lukka R, Heino J, Kalimo H. Satellite cell proliferation and the expression of myogenin and desmin in regenerating skeletal muscle: evidence for two different populations of satellite cells. Lab Invest 1995;72:341–347. [PubMed] [Google Scholar]
- 92. Drummond MJ, Conlee RK, Mack GW, Sudweeks S, Schaalje GB, Parcell AC. Myogenic regulatory factor response to resistance exercise volume in skeletal muscle. Eur J Appl Physiol 2010;108:771–778. [DOI] [PubMed] [Google Scholar]
- 93. Coen PM, Goodpaster BH. Role of intramyocelluar lipids in human health. Trends in endocrinology and metabolism: TEM 2012;23:391–398. [DOI] [PMC free article] [PubMed] [Google Scholar]
- 94. Tipton KD. Gender differences in protein metabolism. Curr Opin Clin Nutr Metab Care 2001;4:493–498. [DOI] [PubMed] [Google Scholar]
- 95. Makizako H, Shimada H, Doi T, Tsutsumimoto K, Lee S, Lee SC, et al. Age‐dependent changes in physical performance and body composition in community‐dwelling Japanese older adults. J Cachexia Sarcopenia Muscle 2017;8:607–614. [DOI] [PMC free article] [PubMed] [Google Scholar]
- 96. von Haehling S, Morley JE, Coats AJ, Anker SD. Ethical guidelines for publishing in the Journal of Cachexia, Sarcopenia and Muscle: update 2015. J Cachexia Sarcopenia Muscle 2015;6:315–316. [DOI] [PMC free article] [PubMed] [Google Scholar]