

Abstract
Background
Toxicity of chemotherapy on skeletal muscles and the heart may significantly contribute to cancer cachexia, mortality, and decreased quality of life. Doxorubicin (DOX) is an effective cytostatic agent, which unfortunately has toxic effects on many healthy tissues. Blocking of activin receptor type IIB (ACVR2B) ligands is an often used strategy to prevent skeletal muscle loss, but its effects on the heart are relatively unknown.
Methods
The effects of DOX treatment with or without pre‐treatment with soluble ACVR2B‐Fc (sACVR2B‐Fc) were investigated. The mice were randomly assigned into one of the three groups: (1) vehicle (PBS)‐treated controls, (2) DOX‐treated mice (DOX), and (3) DOX‐treated mice administered with sACVR2B‐Fc during the experiment (DOX + sACVR2B‐Fc). DOX was administered with a cumulative dose of 24 mg/kg during 2 weeks to investigate cachexia outcome in the heart and skeletal muscle. To understand similarities and differences between skeletal and cardiac muscles in their responses to chemotherapy, the tissues were collected 20 h after a single DOX (15 mg/kg) injection and analysed with genome‐wide transcriptomics and mRNA and protein analyses. The combination group was pre‐treated with sACVR2B‐Fc 48 h before DOX administration. Major findings were also studied in mice receiving only sACVR2B‐Fc.
Results
The DOX treatment induced similar (~10%) wasting in skeletal muscle and the heart. However, transcriptional changes in response to DOX were much greater in skeletal muscle. Pathway analysis and unbiased transcription factor analysis showed that p53‐p21‐REDD1 is the main common pathway activated by DOX in both skeletal and cardiac muscles. These changes were attenuated by blocking ACVR2B ligands especially in skeletal muscle. Tceal7 (3‐fold to 5‐fold increase), transferrin receptor (1.5‐fold increase), and Ccl21 (0.6‐fold to 0.9‐fold decrease) were identified as novel genes responsive to blocking ACVR2B ligands. Overall, at the transcriptome level, ACVR2B ligand blocking had only minor influence in the heart while it had marked effects in skeletal muscle. The same was also true for the effects on tissue wasting. This may be explained in part by about 18‐fold higher gene expression of myostatin in skeletal muscle compared with the heart.
Conclusions
Cardiac and skeletal muscles display similar atrophy after DOX treatment, but the mechanisms for this may differ between the tissues. The present results suggest that p53‐p21‐REDD1 signalling is the main common DOX‐activated pathway in these tissues and that blocking activin receptor ligands attenuates this response, especially in skeletal muscle supporting the overall stronger effects of this treatment in skeletal muscles.
Keywords: Myostatin, Activins, Transcriptome, p53, Doxorubicin, Ccl21
Introduction
Cancer cachexia is associated with increased mortality.1 This may, in part, be related to increased toxicity of chemotherapy on skeletal muscles and the heart.1, 2, 3, 4, 5 The maintenance of skeletal1 and cardiac6 muscle mass and function predicts better response to treatment and survival in diseases. Therefore, it is crucial to discover and develop effective strategies to counteract pathological skeletal and cardiac muscle loss.
Doxorubicin (DOX, Adriamycin®) is an anthracycline cytostatic agent, which acts through arresting cell cycle, and thus blocks proliferation of malignant cells.7 Unfortunately, DOX has deleterious effects also on many healthy tissues. Large doses of DOX have been shown for decades to induce cardiotoxicity through various mechanisms.5, 8, 9 In addition, DOX induces adverse effects on skeletal muscle tissue including muscle weakness, fatigue, dysfunction, and atrophy.10 Some studies have suggested that the heart may be more sensitive to DOX than skeletal muscle,2, 3 but the degree of skeletal muscle dysfunction can be comparable to or even higher than that of heart.11, 12
Skeletal and cardiac muscles are very similar in several aspects; both are striated and composed of myofibrils. However, cardiac cells are smaller, more circular, branched, and have junctions between cells called intercalated discs connecting cardiomyocytes (CMCs) together. This complexity in the heart may be an advantage, but also a disadvantage regarding regeneration, which has been thought to be among the weakest in the adult mammalian body.13, 14 In comparison to the heart, skeletal muscles have a remarkable regeneration capacity even after very severe injury.15
Skeletal muscle size is negatively regulated by myostatin, GDF11, and activins, which belong to the TGF‐β superfamily of proteins.16, 17, 18 They exert their effects through binding to activin receptor type IIB (ACVR2B). An often used strategy to increase muscle size and to prevent muscle loss is to block these ACVR2B ligands by administration of a soluble ligand binding domain of ACVR2B (sACVR2B‐Fc).4, 19, 20, 21 In addition, sACVR2B‐Fc treatment has been found to prolong survival and to reverse cancer cachexia in mice.22, 23 Activin receptor signalling is important for heart growth regulation and homeostasis as well,18, 22, 24, 25, 26, 27, 28, 29 but the effects of blocking activin receptor ligands in the heart have not been investigated in chemotherapy‐induced cardiac atrophy.
Previous studies have evaluated the effects of DOX and ACVR2B blocking either on the heart or skeletal muscle. In the present study, we compared the effects of DOX‐treatment with or without pre‐treatment with sACVR2B‐Fc on cardiac and skeletal muscles. We show here that cardiac and skeletal muscle masses were similarly decreased by DOX chemotherapy treatment. However, transcriptional changes in response to DOX were much greater in skeletal muscle. Furthermore, we show that blocking of activin receptor ligands had more pronounced effect on skeletal muscle than cardiac wasting.
Materials and methods
Animals
C57BL/6J male mice (Envigo), aged 6–10 weeks were maintained under standard conditions (temperature 22°C, 12:12 h light/dark cycle) with free access to food and water. The protocols were approved by the National Animal Experiment Board, and all the experiments were carried out in accordance with the guidelines of the committee and the ethical standards of the Declaration of Helsinki.
Experimental design
The mice were randomly assigned into three groups: (1) vehicle (PBS)‐treated controls (CTRL), (2) DOX hydrochloride treated mice (DOX), and (3) DOX‐treated mice administered with sACVR2B‐Fc intraperitoneally (DOX + sACVR2B) (Figure 1A).
Figure 1.

(A) Experimental design. The study included acute as well as 2 and 4 week experiments. (B) Adjusted mass (control = 1, adjusted to tibial length) of skeletal muscle and the heart after 4 weeks of cumulative 24 mg/kg doxorubicin administration (mean ± SD). Skeletal muscle mass is a sum of tibialis anterior, gastrocnemius, and soleus masses. n = 15, 16, and 17 in skeletal muscle and n = 14, 16, and 16 in heart in CTRL, DOX, and in DOX + sACVR2B, respectively. General linear model analysis of variance with Bonferroni post hoc test was used. * or *** = significant (P < 0.05 or P < 0.001, respectively) difference to respective CTRL. ### = significant (P < 0.001) difference to respective DOX.
In the long‐term treatment experiments, both DOX groups received four intraperitoneal injections of DOX (each 6 mg/kg in PBS), administered every third day during the first 2 weeks of the experiment.4, 5 Control mice were administered with an equal volume of PBS. The mice were euthanized at 2 weeks and at 4 weeks after the first DOX injection. Half of the DOX mice were injected with sACVR2B‐Fc (5 mg/kg in PBS) twice a week during the first 2 weeks of the experiment and once a week after that. The DOX treatment protocol was designed to mimic the treatment of human patients with low DOX doses to induce cardiotoxicity but no treatment‐related deaths.30
In the acute experiment, a single intraperitoneal injection of DOX (15 mg/kg in PBS) or an equal volume of PBS was administered. sACVR2B‐Fc‐treated mice received a single intraperitoneal injection of sACVR2B‐Fc (10 mg/kg in PBS) 48 h before DOX administration, as we have previously shown that sACVR2B‐Fc increases muscle protein synthesis 48 h after its administration.20 The mice were euthanized 20 h after DOX/PBS administration. To analyse the effects of sACVR2B‐Fc alone, another experiment was conducted in which sACVR2B‐Fc (10 mg/kg in PBS) or PBS were administered 48 h before sample collection into wild‐type mice.20
Tissue collection
At the end of the experiment, the mice were anaesthetized with ketamine and xylazine and then euthanized by cardiac puncture followed by cervical dislocation. Hindlimb muscle tibialis anterior (TA), gastrocnemius, soleus, and the heart were immediately excised and weighed. The left TA and gastrocnemius muscles and part of the heart (apex) were snap‐frozen in liquid nitrogen. Blood was fully drained from hearts prior to tissue weighing. All tissue weights were normalized to the length of the tibia (mm). TA muscle was used in subsequent analyses, except when analysing the effects of sACVR2B‐Fc alone20 and DOX‐measurements, in which gastrocnemius was used.
Puromycin injection for protein synthesis measurement
Puromycin incorporation assay31 was conducted as earlier4, 20, 32 with small modifications. In brief, mice were intraperitoneally injected with 0.040 μmol/g (21.78 mg/kg) puromycin (Calbiochem, Darmstadt, Germany) dissolved in 200 μL of PBS. At exactly 25 min after the injection of puromycin, mice were euthanized by cervical dislocation and heart was collected and snap‐frozen at exactly 30 min after puromycin injection.
sACVR2B‐Fc production
The recombinant fusion protein was produced and purified as described earlier in detail.20 The ectodomain of human ACVR2B was fused with a human IgG1 Fc domain and expressed in Chinese hamster ovary cells grown in a suspension culture. The protein is similar but not identical to that originally generated by Lee and colleagues.19
RNA analysis
Total RNA was extracted from muscle and the heart with TRIsure reagent (Bioline) and further purified with NucleoSpin® RNA II columns. For quantitative polymerase chain reaction (qPCR), RNA was reverse transcribed to cDNA by using iScript™ Advanced cDNA Synthesis Kit for real‐time qPCR (Bio‐Rad Laboratories) according to the manufacturer's instructions. Real‐time qPCR was performed according to standard procedures by using iQ SYBR Supermix (Bio‐Rad Laboratories) and CFX96 Real‐Time PCR Detection System (Bio‐Rad Laboratories). Quantification was carried out by using standard curve or efficiency corrected ΔΔCt method. The relative mRNA expressions were normalized by using 36b4 as a reference gene, as it was the most stable (lowest intergroup and intragroup variances) from three candidate reference genes (36b4, Gapdh, and Rn18S). Primer sequences are listed in Online Resource 1: Supplementary Methods.
Microarray analysis
RNA from the TA and the heart samples of the acute experiment were analysed with Illumina Sentrix MouseRef‐6 v2 Expression BeadChip containing 45 281 transcripts (Illumina Inc., San Diego, CA, USA) by the Functional Genomics Unit at Biomedicum Helsinki, University of Helsinki, Finland according to the manufacturer's instructions. Five muscle and heart samples from control and DOX groups and five muscle and three heart samples from DOX + sACVR2B‐Fc group were analysed. RNA was analysed for integrity and quality on Agilent Bioanalyser 2100. Illumina's GenomeStudio software was used for initial data analysis and quality control. Raw data were normalized with quantile normalization (including log2‐transformation of the data), data quality was assessed, and statistical analyses were performed by using Chipster software (IT Center for Science, Espoo, Finland).33 Statistically significant differences in individual genes between the groups were tested by using Empirical Bayes statistics and the Benjamini‐Hochberg algorithm controlling false discovery rate (FDR). FDR values of <0.05 with ≥1.2‐fold change difference were considered significant. MIAME guidelines were followed during array data generation, pre‐processing, and analysis. The complete data set is publicly available in the NCBI Gene Expression Omnibus (http://www.ncbi.nlm.nih.gov/geo; accession no. GSE77745 and GSE97642). Heatmap illustrations were performed with GENE‐E software (Broad Institute, Cambridge, USA).
Transcription factor analysis
Transcription factor (TF) analysis is usually conducted in cultured cells rather than actual tissue samples, and it focuses on a single a priori chosen TF at a time. When the TF is not known in advance, or when only gene expression profiling is available, regulatory relationships can be uncovered by reverse‐engineering a gene regulatory network starting from the expression data. A‐genome‐wide ranking‐and‐recovery approach using iRegulon software34 was used to detect enriched TF motifs and their optimal set of direct target genes. This analysis also links these candidate motifs to TFs by using motif2TF procedure.
Pathway analysis
Enrichment of functionally related genes in four different gene set collections was first performed by using a non‐biased method by gene set enrichment analysis software (GSEA; Version 2.0)35 as previously done in our laboratory.4, 36, 37 The collections used were the Canonical Pathways, Biocarta, KEGG, and Reactome (http://www.broadinstitute.org/gsea/msigdb/collections.jsp). The number of permutations by gene set was set to 1000 and gene sets with at least 10, and no more than 500 genes were taken into account in each analysis. The statistical significance was calculated by using FDR, and the level of significance was set at FDR<0.05.
Doxorubicin measurement
The DOX concentration from gastrocnemius muscle was measured with an Agilent 1100 HPLC system (Agilent Technologies, Waldbronn, Germany) coupled to an AB Sciex API 2000 tandem mass spectrometer (Framingham, MA), as previously described.5
Tissue processing for the protein analysis
Muscle and heart samples were homogenized and treated with proper inhibitors as previously reported.4, 5 One part of the heart homogenate was taken for the puromycin incorporation examination. For that purpose, the sample was centrifuged at 500 g for 5 min to remove cell debris. For the analysis of individual proteins, the rest of the homogenate was centrifuged at 10 000 g for 10 min. Total protein content was determined by using the bicinchonic acid protein assay (Pierce Biotechnology, Rockford, USA) with an automated KoneLab analyser (Thermo Scientific, Vantaa, Finland).
Western immunoblot analyses
Western immunoblot analyses were performed as previously reported.4, 5 Ponceau S staining and GAPDH were used as loading controls, and all the results are normalized to the mean of Ponceau S and GAPDH. The quantification of GAPDH normalized to Ponceau S was similar among the groups, indicating that GAPDH protein content remained stable under the experimental conditions. The antibodies used are listed in the Online Resource 1: Supplementary Methods.
Immunohistochemistry
Cardiac and skeletal muscle (TA) tissue sections were cut with cryomicrotome and fixed with ice‐cold acetone. Masson trichrome staining was performed to analyse the amount of fibrosis in the tissues. Immunohistochemistry was performed to measure CMC cross‐sectional area by using mouse‐anti‐dystrophin antibody (1:500 dilution, NCL‐Dys 2, Novocastra). Rabbit‐anti‐Ki67 antibody (1:300, ab1667, Abcam) was used to evaluate the effects of DOX and sACVR2B‐Fc on the cell proliferation. Sections were imaged with Zeiss Axioimager microscope, and CMC size was calculated using Cell Profiler software.
Statistical analysis
Multiple group comparisons except microarray (see details above) were conducted with general linear model analysis of variance followed by Bonferroni post hoc test or by non‐parametric Kruskal–Wallis test followed by Holm‐Bonferroni corrected Mann–Whitney U‐test as post hoc when appropriate. For two‐group comparisons, a two‐tailed unpaired Student's t‐test or non‐parametric Mann–Whitney U‐test was used. Data were checked for normality and for the equality of variances. The level of significance in these analyses was set at P < 0.05. Data are expressed as means ± SEM if not otherwise mentioned. Statistical analyses were performed with ibm spss statistics version 24 for Windows (SPSS, Chicago, IL).
Results
ACVR2B blocking can prevent chemotherapy‐induced skeletal muscle but not cardiac atrophy
At 4 weeks, chemotherapy‐induced atrophy was almost identical between skeletal and cardiac muscles (Figure 1B). In skeletal muscle, sACVR2B‐Fc treatment effectively prevented the loss of muscle mass and was able to even increase muscle mass (Figure 1B). However, sACVR2B‐Fc was unable to fully block the cardiac atrophy, although the weight loss was slightly less consistent in DOX + sACVR2B (P = 0.165) when compared with DOX alone (P = 0.030). Furthermore, CMC cross‐sectional area was not increased by sACVR2B (Online Resource 2: Su pplementary Figure S1A).
Larger transcriptomic changes in skeletal muscle than in the heart in response to doxorubicin chemotherapy
Whole‐genome microarray analysis using FDR < 0.05 and fold change ≥ 1.2 criteria showed that 485 and 40 annotated transcripts were up‐regulated and 473 and 24 were down‐regulated by DOX in skeletal muscle and heart, respectively, at 20 h after a single DOX injection. Out of these genes, there were 21 and 6 genes that were up‐regulated or down‐regulated, respectively, by DOX in both muscle and the heart (Online Resource 3: Supplementary Figure S2A and S2B). In addition to having much larger number of genes altered, the genes with largest changes showed more robust response in skeletal muscle as compared with the heart (Figure 2A–2D).
Figure 2.
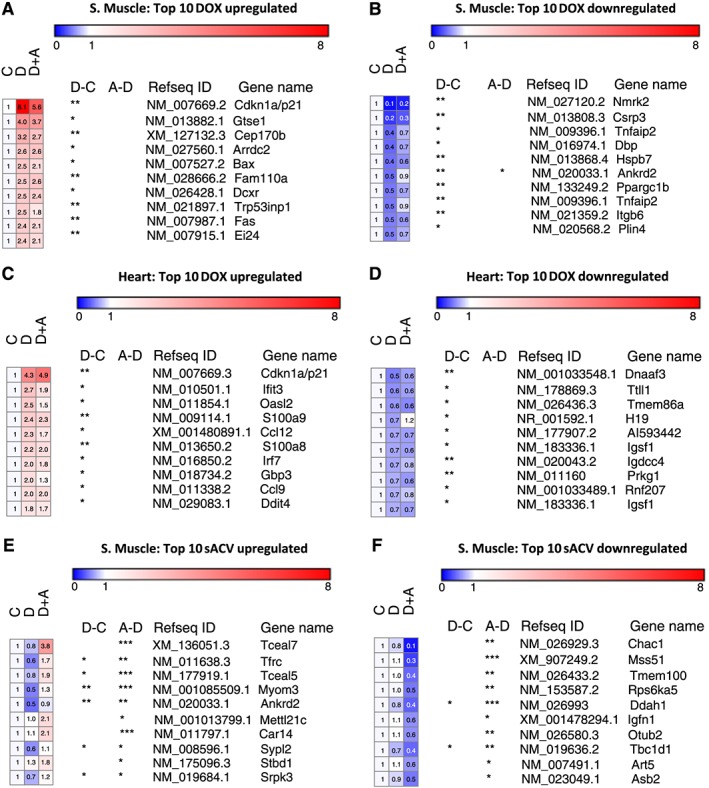
Top 10 genes with largest response to doxorubicin in skeletal muscle (A and B) and in the heart (C and D). Top 10 genes with largest change by sACVR2B‐Fc in skeletal muscle (E and F). C = CTRL, D = DOX, A = DOX + sACVR2B. *, **, or *** = significant (P < 0.05, P < 0.01, or P < 0.001, respectively) adjusted difference (false discovery rate). n = 5 per group.
Of the most up‐regulated genes, a well‐known cell‐cycle inhibitor p21/Cdkn1a was highly up‐regulated by DOX injection in both muscle and the heart (Figure 2A and 2C), and this was validated by qPCR (Figure 3A). Interestingly, this response was significantly decreased by sACVR2B‐Fc treatment preceding DOX administration in skeletal muscle (Figure 3A). sACVR2B‐Fc alone did not, however, decrease p21/Cdkn1a below healthy controls (Figure 3A). Moreover, DNA‐damage response indicator Redd1/Ddit4 was up‐regulated in both skeletal and heart muscle as published earlier,4, 5 and blocking ACVR2B ligands attenuated this response in skeletal muscle as published earlier4 without an effect in the heart (Online Resource 2: Su pplementary Figure S1B).
Figure 3.

Doxorubicin alters the gene expression of (A) Cdkn1a (p21), while sACVR2B‐Fc increases (B) Tceal7 in skeletal muscle and attenuates (C) Ccl21 mRNA levels. (D) Doxorubicin decreases transferrin receptor (Tfrc) mRNA in both tissues while its mRNA and protein (E) levels are increased by sACVR2B‐Fc. Tceal7 was expressed in heart only very weakly, and thus, it was not analysed. The values are presented as fold changes compared with the control group. For multiple group comparisons, general linear model analysis of variance with Bonferroni post hoc test (A and B) or Kruskal‐Wallis test with Holm‐Bonferroni corrected Mann–Whitney U post hoc test (C–E) were used. For two‐group comparisons, the Student's t‐test (A–C) or non‐parametric Mann–Whitney U‐test (E) were used. *, **, or *** = significant (P < 0.05, P < 0.01, or P < 0.001, respectively) difference to respective CTRL. # or ### = significant (P < 0.05 and P < 0.001, respectively) difference to respective DOX. n = 7–9 per group in the doxorubicin experiment and n = 5–6 per group in the sACVR2B‐Fc alone vs. PBS experiment.
Tceal7 and Ccl21 mRNAs are regulated by sACVR2B‐Fc
One hundred eighteen and 1 annotated transcripts were up‐regulated, and 84 and 2 transcripts were down‐regulated in DOX + sACVR2B‐Fc‐treated mice when compared with DOX alone in muscle and the heart, respectively. In skeletal muscle, the gene with the highest increase by sACVR2B‐Fc in microarray (Figure 2E) was Tceal7 [transcription elongation factor A], a protein involved in skeletal muscle development and regeneration,38 and this finding was further confirmed by qPCR (Figure 3B). The expression level of Tceal7 in the heart was very low and could not be analysed reliably. The only significantly up‐regulated gene by sACVR2B‐Fc in the heart was Vsig4 (3.52‐fold, FDR < 0.001), which remained unchanged in skeletal muscle. Of the five annotated probes down‐regulated by sACVR2B‐Fc in the heart, four were probes for Ccl21 gene and the response of this gene was also validated by qPCR in both tissues (Figure 3C). sACVR2B‐Fc treatment alone also increased the expression of Tceal7 and decreased the expression of Ccl21 (Figure 3B and 3C), confirming that these effects are due to the blocking of activin receptor type IIB ligands. Potassium voltage‐gated channel, Isk‐related subfamily, member 1 (Kne1) was another gene decreased by sACVR2B‐Fc in the heart (0.55‐fold, FDR = 0.01) without an effect in skeletal muscle. Transcripts, which showed the largest down‐regulation by sACVR2B‐Fc in muscle, are shown in Figure 2F.
There were 22 and 17 genes that were up‐regulated or down‐regulated, respectively, by DOX in skeletal muscle, and whose expression was normalized by sACVR2B‐Fc treatment (Online Resource 3: Supplementary Figure S2C and S2D). An interesting gene among these was transferrin receptor, as iron metabolism has been shown to be affected and to play a role in DOX‐induced toxicity.39 In both muscle and the heart transferrin receptor mRNA decreased by DOX and in both tissues, but especially in skeletal muscle, this was rescued by sACVR2B‐Fc (Figure 3D). The increase in transferrin receptor by sACVR2B‐Fc was translated into protein level as well, especially in skeletal muscle (Figure 3E).
PGC‐1 gene expression
As microarray platforms do not have probes for most of the recently identified PGC‐1α isoforms, we analysed them by qPCR. In skeletal muscle, Pgc‐1α exon 1a (Ppargc1a exon 1a) and Pgc‐1α exon 1c isoforms as well as Pgc‐1β (Ppargc1b) mRNA decreased by DOX (P < 0.05), and only the N‐truncated Pgc‐1α isoforms remained unchanged (Figure 4A–4D). In contrast, in the heart, there was an overall increase by DOX in Pgc‐1α isoforms (Figure 4A–4D). No effect of sACVR2B‐Fc was observed in either tissue type (Figure 4A–4D).
Figure 4.

(A–D) Doxorubicin differentially alters the gene expression of Ppargc1 (PGC‐1) mRNA isoforms in muscle and the heart. Notice that in (C) Ppargc1a exon 1c, the * in S. muscle with lines depicts the doxorubicin effect of both doxorubicin groups pooled when compared with control without treatments. General linear model analysis of variance with Bonferroni post hoc test was used. *, **, or *** = significant (P < 0.05, P < 0.01, or P < 0.001, respectively) difference to respective CTRL. n = 6–9 per group.
Heart protein synthesis and ubiquitin ligases
We recently reported that skeletal muscle protein synthesis was decreased by DOX and this could be restored by sACVR2B‐Fc.4 In this study, we analysed protein synthesis in the heart in response to DOX and sACVR2B‐Fc. Unlike in skeletal muscle, there was no consistent effect of either DOX or sACVR2B‐Fc on puromycin incorporation into proteins, a marker of protein synthesis, in the heart (Figure 5A). The level of ubiquitinated proteins was also unchanged in the heart (Figure 5B) similarly as previously published in skeletal muscle.4 E3 ubiquitin ligase Atrogin1 mRNA increased by DOX in both tissues, but more robustly in the skeletal muscle (Figure 5C). Interestingly, sACVR2B‐Fc prevented the increase in Atrogin1 mRNA in muscle (Figure 5C). Murf1 mRNA showed a small decrease by DOX in the heart (Figure 5C), while as previously published in skeletal muscle, Murf1 mRNA was unaltered by DOX, but decreased due to sACVR2B‐Fc.4
Figure 5.
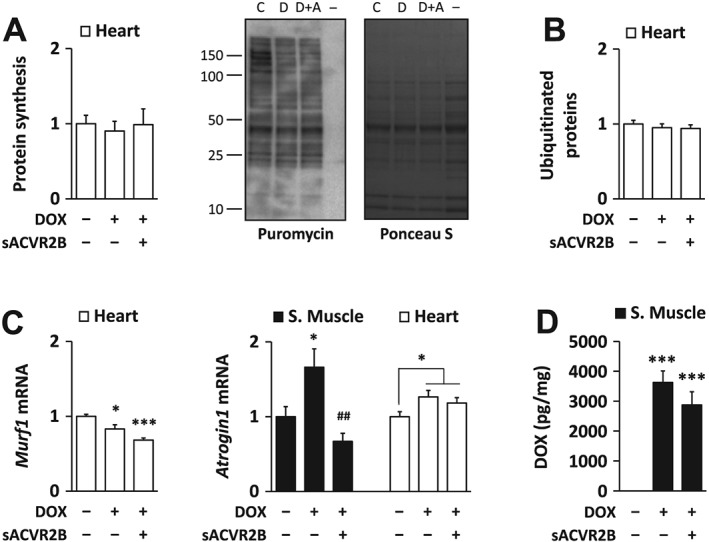
(A) Doxorubicin administration and sACVR2B‐Fc treatment did not alter heart protein synthesis. Protein synthesis relative to doxorubicin was analysed with puromycin incorporation method. Representative blot (left) with Ponceau S staining (right). (− = negative control for puromycin). Doxorubicin administration had no effect on the amount of ubiquitinated proteins in the heart (B) despite minor changes in the mRNA expression of E3 ubiquitin ligases MuRF1 and Atrogin1 (C). (D) sACVR2B‐Fc treatment did not alter doxorubicin levels in gastrocnemius muscle at the 20 h timepoint after doxorubicin‐administration, when the RNA and protein samples were also taken. Kruskal‐Wallis test with Holm‐Bonferroni corrected Mann–Whitney U post hoc test (A and B), and general linear model analysis of variance with Bonferroni post hoc test (C and D) were used. Doxorubicin effect in Atrogin1 expression in the heart was evaluated with Student's t‐test. n = 7–9 per group in the doxorubicin experiment. Regarding doxorubicin experiment, muscle results of Murf1 can be found as Supporting Information in earlier publication.4
Muscle doxorubicin content is unaltered by sACVR2B‐Fc
To analyse whether the strong effects of sACVR2B‐Fc were simply due to attenuated DOX levels in the combination group, DOX concentration in gastrocnemius muscle after the acute DOX treatment was analysed. We found that DOX content at 20 h post‐injection did not differ between the DOX and DOX + sACVR2B administered mice (Figure 5D), suggesting that sACVR2B‐Fc effects are not due to altered tissue concentration of DOX.
Pathway analysis shows similar responses in skeletal muscle and the heart
To identify affected pathways, further analyses were conducted by using an unbiased gene clustering analysis with GSEA.35 In GSEA analysis, 72 and 51 gene sets were up‐regulated and 17 and 0 down‐regulated (FDR < 0.05) in skeletal muscles and hearts of DOX‐injected mice, respectively (Online Resource 4: Supplementary Figure S3A and S3B). It was evident that p53/p63 pathways/gene sets were activated in both skeletal muscle and the heart (Figure 6A and 6B). Also, pathways related to RNA polymerase and transcription were up‐regulated in both tissues (Figure 6A and 6B). In skeletal muscle the most down‐regulated pathways were related to extracellular proteins, collagens, and their regulation (Figure 6A). Same pathways tended to be decreased also in the heart after DOX‐injection, but less significantly than in skeletal muscle (FDR > 0.05). No sign of fibrosis was observed with Masson trichrome staining either in skeletal muscle or in the heart at 4 weeks (Online Resource 2: Su pplementary Figure S1C).
Figure 6.

Gene set enrichment analysis was conducted from the microarray results. Positive and negative enrichment scores denote a large number of genes up‐regulated or down‐regulated, respectively, in the given gene set. Gene sets with false discovery rate < 0.001 are presented for the doxorubicin effects in muscle (A) and the heart (B). Normalized enrichment score (NES)‐values of up‐regulated gene sets in doxorubicin‐treated mice (DOX vs. CTRL) are expressed as red bars and NES‐values of down‐regulated gene sets as blue bars. There was no significant enrichment of gene sets down‐regulated by doxorubicin in the heart (B). For the sACVR2B‐Fc effects, gene sets with false discovery rate < 0.05 are presented (C). NES‐values of up‐regulated gene sets in treated mice (DOX + sACVR2B vs. DOX) are expressed as red bars and NES‐values of down‐regulated gene sets as blue bars. There was no significant enrichment of gene sets altered by sACVR2B‐Fc at false discovery rate < 0.05 in the heart.
Correspondingly, nine gene sets were up‐regulated and six down‐regulated (FDR < 0.05) in DOX + sACVR2B when compared with DOX alone in skeletal muscle without any affected gene sets in the heart (Figure 6C). In muscle, the most activated gene sets were related to translation capacity and efficiency, and the most down‐regulated ones to extracellular proteins, and especially proteoglycans and extracellular matrix glycoproteins. Of the gene sets that were down‐regulated by DOX in skeletal muscle, p38‐MAPK pathway was significantly increased by DOX + sACVR2B when compared with DOX alone (Figure 6C and Online Resource 4: Supplementary Figure S3C and S3D).
As sACVR2B prevented the DOX‐induced increase in the cell cycle inhibitor p21, we stained muscle and heart sections with Ki67 antibody. DOX treatment had no significant effect on the number of Ki67‐positive nuclei, but surprisingly, sACVR2B significantly increased Ki67‐positivie nuclei in both muscle and the heart (Online Resource 2: Su pplementary Figure S1D).
Transcription factor analysis
Next, to gain insight into the key mediators of the effects of DOX and sACVR2B‐Fc, a TF analysis was conducted. For this analysis, the gene lists of FDR < 0.05 up‐regulated or down‐regulated genes with at least 1.5‐fold change were loaded to iRegulon software. As a common TF up‐regulated by DOX in both the muscle and the heart, p53 was again identified (Online Resource 5: S upplementary Table S1). mRNA expression changes of genes containing p53 targeted motifs in microarray (>1.5‐fold increase DOX vs. Control) are shown in Figure 7A and 7B. p21/Cdkn1a and Redd1/Ddit4 rankings were high in both tissues suggesting that p53‐REDD1‐p21 pathway is the main common pathway activated by DOX in skeletal and cardiac muscles. p53 itself is mainly post‐transcriptionally regulated, and indeed, its protein content was increased in both tissues after DOX (Figure 7C). However, sACVR2B‐Fc completely blocked this response in both tissues (Figure 7C). This is in line with the expression changes downstream of p53, as p21/Cdkn1a mRNA up‐regulated in response to DOX was attenuated by sACVR2B‐Fc, especially in skeletal muscle (Figure 3A).
Figure 7.
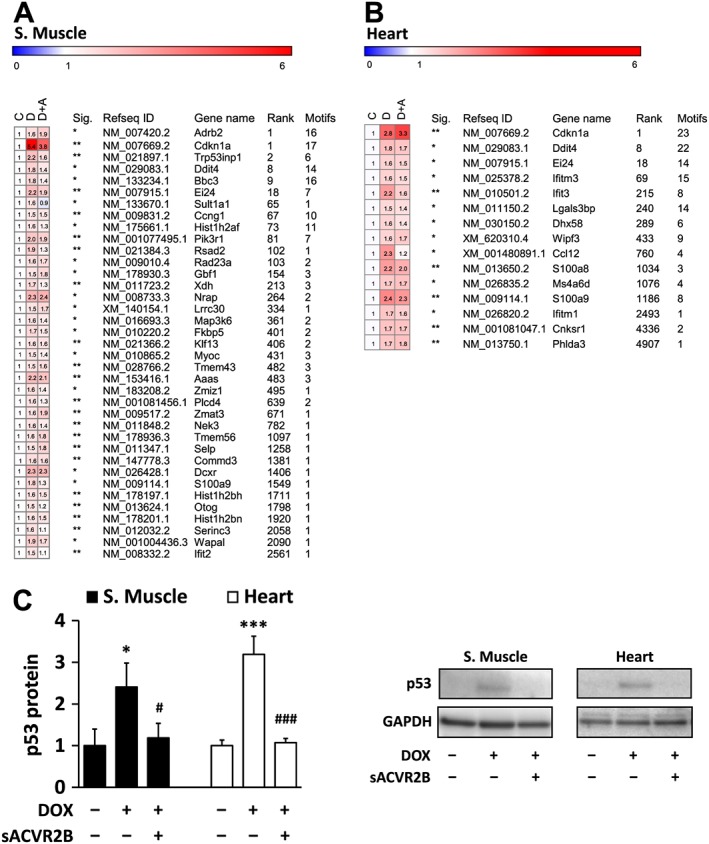
mRNA expression changes of genes containing p53 targeted motifs (DOX vs. CTRL fold change > 1.5 and false discovery rate < 0.05) (A) in skeletal muscle and (B) in the heart. C = control, D = DOX, and D + A = DOX + sACVR2B. Sig. designates p‐adjusted false discovery rate of the difference between the doxorubicin and controls (* = false discovery rate < 0.05, ** = false discovery rate < 0.01, *** = false discovery rate < 0.001). Rank = the rank number (all genes in the genome) of likelihood of being a p53 target. Motifs = the number of p53 associated motifs found in regulatory sequence. The table presents results of mean of probes with multiple transcripts. n = 5 per group. (C) The effects of DOX and combined DOX + sACVR2B on p53 protein level. Kruskal‐Wallis test with Holm‐Bonferroni corrected Mann–Whitney U post hoc test was used. n = 8–9 in heart and 4–6 in skeletal muscle.
Other notable TFs affected by DOX were MyoD in skeletal muscle and Stat3 in the heart. MyoD binding site was enriched in iRegulon by DOX (Online Resource 5: S upplementary Table S1). This result was associated with increased Myod1 mRNA by DOX in both microarray and in qPCR (Online Resource 6: Supplementary Figure S4A). On the other hand, Stat3 binding site was strongly enriched in the heart, but not in skeletal muscle (Online Resource 5: S upplementary Table S1) without changes in the phosphorylation of Stat3 (Online Resource 6: Supplementary Figure S4B).
Gene expression of ACVR2B and its ligands in muscle and in heart and in response to doxorubicin and sACVR2B‐Fc
The difference in the response to ACVR2B ligand blocking between skeletal muscle and the heart could be explained by different expression level of activin receptor IIB or its ligands or their responses to DOX. First, we compared the mRNA levels in muscle and heart tissues of young healthy mice (n = 12). Myostatin (Gdf8) mRNA expression was ~18‐fold higher in skeletal muscle than in the heart (P < 0.001; Figure 8A). The expression levels of Activin A (Inhibin βA), Gdf11, and activin receptor IIb (Acvr2b) mRNAs were relatively low in both tissues, especially in skeletal muscle that had lower mRNA of these genes than the heart (P < 0.005; Figure 8A). Next, we analysed the responses of these ligands to the treatments. sACVR2B‐Fc increased Gdf8 mRNA but decreased Acvr2b mRNA exclusively in skeletal muscle without effects on Activin A or Gdf11 mRNA (Figure 8B–8E). DOX slightly decreased Activin A and Gdf11 mRNA in skeletal muscle without an effect on Gdf8 or Acvr2b mRNA expression (Figure 8B–8E).
Figure 8.

(A) Activin receptor type IIB and its major ligands are differentially expressed in the heart and skeletal muscle. The effects of doxorubicin and sACVR2B‐Fc administration on mRNA expression of (B) Gdf8 (myostatin), (C) Acvr2b, (D) Activin A, and (E) Gdf11 in skeletal muscle and the heart. n = 12 per group in muscle and heart comparison (A), n = 6–9 per group in the doxorubicin experiment (B–E). For multiple group comparisons, general linear model analysis of variance with Bonferroni post hoc test was used (B–E). For two‐group comparisons, the non‐parametric Mann–Whitney U‐test (A) or Student's t‐test (doxorubicin effect in D) were used.
Discussion
The present study reports common and unique changes in skeletal muscle and the heart after DOX chemotherapy alone and in combination with activin receptor ligand blocking. DOX treatment induced similar tissue wasting in both heart and skeletal muscles; however, changes in the whole‐genome transcriptome were much greater in skeletal muscle. We identified p53‐p21‐REDD1 as the main common pathway activated by DOX in both skeletal and cardiac muscles, and this was attenuated by blocking the activin receptor IIB ligands. Although a few novel targets were found in the heart, the blocking of sACVR2B ligands had markedly stronger effects in skeletal muscle than in the heart.
To the best of our knowledge, this was the first omics‐based study comparing the effects of chemotherapy and activin receptor ligand blocking in the heart and skeletal muscle. Previously, the effects of DOX on heart transcriptome have been investigated9, 40 and the effects of cancer cachexia without chemotherapy have been compared in cardiac and skeletal muscles.41 Moreover, we and others have investigated skeletal muscle transcriptome after blocking or deleting activin receptor ligands with different strategies.4, 21, 37 However, we are unaware of any omics‐based DOX studies in skeletal muscle. Here we found that after a cumulative dose of 24 mg/kg of DOX, skeletal muscle and heart wasting at 4 weeks after starting the treatment were almost identical, supporting previous findings in rats.11 Regarding quality and functional aspects, previous studies comparing the degree of toxicity in skeletal muscle and in the heart have provided contrasting results.2, 3, 11, 12 Perhaps surprisingly, in our study, skeletal muscles showed much more robust changes in transcript expression after DOX administration when compared with the heart. Interestingly, in line with our findings, a recent study reported that muscle transcriptome was much more responsive to C26 cancer cachexia than that of the heart.41
Why the DOX‐induced changes, especially in transcriptomics, were much larger in skeletal muscle even though the loss of tissue mass was equal? Skeletal muscle tissue has a tremendous regeneration capacity after muscle damage compared with the heart.13, 14 One of the most important factors in skeletal muscle regeneration/restoration is a skeletal muscle‐specific protein MyoD that activates skeletal muscle‐specific transcription,42 and is required for muscle regeneration after injury.43 MyoD target genes and Myod mRNA itself were induced in skeletal muscle in DOX‐injected mice, possibly reflecting regeneration process in skeletal muscle by activated satellite cells.43 This response is probably secondary to the myocyte damage,2, 10 as at least in vitro in myoblasts, DOX per se can inhibit MyoD expression.44 Tceal7 was the most induced gene by sACVR2B‐Fc in skeletal muscle. TCEAL7 is a protein expressed mainly in skeletal muscle, and it is up‐regulated after muscle injury serving as an enhancer of muscle cell differentiation.38 This may be one of the mechanisms how new myofibre nuclei can be acquired with sACVR2B.22
REDD145 and p2146 are downstream targets of p53. The present results suggest that p53‐p21‐REDD1 is the main pathway activated by DOX in both skeletal and cardiac muscles. DOX has been shown to increase nuclear accumulation and DNA binding of p53,47 which at least in part mediates cardiac wasting.48 Interestingly, sACVR2B‐Fc completely prevented DOX‐induced increase in p53 protein in both tissues and attenuated the increase in p21 mRNA in skeletal muscle. Our results show that sACVR2B‐Fc does not induce its effect via modulating DOX‐levels in muscles. Instead, decreased level of ACVR2B ligands such as myostatin can directly affect cell cycle regulation.49 We found that sACVR2B‐Fc increased Ki67‐positive cells in both tissues. In skeletal muscle, this may indicate increased proliferation of at least satellite cells,22 although most of the Ki67 staining was observed in myofibre and CMC nuclei. In addition to changes in proliferating cells, the increased Ki67 staining by sACVR2B‐Fc may also reflect ribosomal RNA transcription.50 In our pathway analyses, gene sets related to translation capacity or efficiency were enriched in skeletal muscle by sACVR2B‐Fc. Knowing the importance of mTOR and ribosomes and their biogenesis in muscle protein synthesis and in muscle hypertrophy,51 this may be causally linked with the increased muscle protein synthesis and mTORC1 signalling that we showed earlier.4
Downstream of p53, cell cycle arrest and increased reactive oxygen species are thought to be mediated, at least in part, by cyclin‐dependent kinase inhibitor p2146 and REDD1/DDIT4.45, 52 These responses can be important in preventing proliferation of cells with harmful alterations in their DNA. This may, however, also be detrimental as some of the proliferating cells would aid recovery of skeletal muscle and the heart.53 In the heart, absence of p53 may prevent at least part of the DOX‐induced injury.54 In skeletal muscle, overexpression of p53 is sufficient to induce muscle atrophy and muscle is partially resistant to certain types of atrophy stimuli in the absence of p53.55 Interestingly, Fox et al. showed that p53 specifically targeted to muscle fibres mediates atrophy through p21, and that p21 alone is sufficient to decrease muscle fibre size.55 Thus, the evidence suggests that increased p53 and its downstream signalling in skeletal muscle mainly acts by provoking muscle loss and injury rather than being protective. Our present results indicate that sACVR2B‐Fc acts in part via inhibiting increased p53 signalling and thus may have a protecting role in the muscles and the heart.
Another common effect of sACVR2B‐Fc was decreased expression of Ccl21 mRNA. CCL21 is a chemokine that is increased in the heart and in serum of clinical and pre‐clinical heart‐failure, and its high levels are associated with increased all‐cause mortality in patients with heart pathologies.56, 57 Thus, our results indicate that activin receptor ligand blocking attenuates pathological cytokine responses in both tissues. However, based on the present data, we cannot conclude the effect of this directly on heart or skeletal muscle function.
Blocking of activin receptor ligands had only minor effects in the heart. However, it may still have certain protective effects in CMCs, as indicated by the effects on p53 and Ccl21. The ~18‐fold higher myostatin expression in skeletal muscle (see Figure 8A) may be one important reason why sACVR2B‐Fc has more pronounced effects in skeletal muscle than in the heart. The difference is not, however, explained by different protein18 or gene expression levels of activin receptor IIB or its other ligands activin A and GDF11, as their mRNA levels were low in these tissues and if anything, higher in the heart. Also, their gene expression was not affected by DOX. Myostatin is activated after cleavage of its prodomain by BMP1/tolloid proteinases.26 Our microarray data suggest that the expression level of these (TLL1, TLL2, and TLD/BMP1 found on our array chip) did not differ between skeletal muscle and the heart (http://www.ncbi.nlm.nih.gov/geo; accession no. GSE77745 and GSE97642).
One of the main reasons for DOX‐induced cardiotoxicity is thought to be mitochondrial iron accumulation.39 DOX‐induced iron uptake has been shown to be mediated, in part, by transferrin receptor‐dependent mechanism.58 Muscle‐specific lack of transferrin receptor leads to decreased muscle growth and other metabolic changes, and surprisingly, many other tissues are affected as well.59 Our present study showed that transferrin receptor mRNA was decreased by DOX in both tissues. Surprisingly, especially in skeletal muscle and to a small extent also in the heart, sACVR2B‐Fc was able to increase the transferrin receptor mRNA and protein levels. This opens up interesting ideas for further studies to elucidate the role of transferrin receptor in muscle wasting and the role of activin receptor ligands in this regulation.
Interestingly, some of the responses were to the opposite directions between the tissues. Most of the PGC‐1 mRNA isoforms were decreased by DOX in skeletal muscle, while in the heart, they tended to increase. PGC‐1α regulates for instance mitochondrial biogenesis, angiogenesis, and to some extent also muscle hypertrophy.60 The observed differences support the recent evidence suggesting that PGC‐1α may have different functions in skeletal muscle and the heart.61 Downstream genes of Stat3 TF were up‐regulated specifically in the heart. This may reflect heart's response to attenuate cardiotoxicity as Stat3 overexpression in the heart has been shown to decrease DOX‐induced cardiomyopathy.62
The importance of ACVR2B ligands in skeletal muscle is rather well studied. In addition, severe cardiac defects are observed in ACVR2B knockout mice24 showing that ACVR2B signalling is important also for the heart development. In many pathological conditions or when cardiac load is increased, myostatin expression is induced in the heart,26, 27 which may be sufficient to decrease both cardiac and skeletal muscle size.25 Myostatin inhibition has had variable effects on heart size depending on the model used.18, 25, 63 Based on recent evidence, GDF11 that has high homology with myostatin, and is also a ligand for ACVR2B, may be more potent in inducing cardiac atrophy than myostatin.18 Of other ACVR2B ligands, also elevated serum activin A levels have been reported in heart failure,64 and heart size is decreased in situations with large increases in systemic activin A levels.22, 28 Moreover, activin A and cancer‐induced decrease in heart size can be prevented with strategies that block ACVR2B ligands.22 In the present study, sACVR2B‐Fc treatment increased skeletal muscle mass without a significant effect on heart mass. The small effect of sACVR2B‐Fc in the heart supports earlier findings, in which blocking of activin receptor ligands in mice without cardiac atrophy had very small or no effect on heart size.20, 65, 66 The present study showed that there was also no effect of DOX or sACVR2B‐Fc on cardiac protein synthesis or CMC size unlike in skeletal muscle.4 In skeletal muscle, also large de novo increase in size by blocking or deleting activin receptor ligands is possible without endogenous changes in myostatin, GDF11, or activin A expression as shown in the present study. Identifying the receptor and ligand preference in the heart vs. muscle will be of importance, as several pre‐clinical and clinical experiments with blockers of these ligands and their receptors are currently ongoing.
In conclusion, the present results demonstrate that cardiac and skeletal muscles displayed similar atrophy due to the DOX treatment. However, the transcriptional changes were much greater in skeletal muscle, which may be attributed to the different regeneration capacity of these two tissues. On the other hand, p53‐p21‐REDD1 signalling was strongly induced in both tissues, and this could be attenuated by activin receptor ligand blocking, especially in skeletal muscle. Smaller effect of blocking these ligands in the heart may be explained in part by higher gene expression of myostatin in skeletal muscle. Taken together, the present study emphasizes that therapeutic strategies should not assume that skeletal and cardiac muscles show similar responses to different atrophy conditions.
Conflict of interest
Juha Hulmi, Tuuli Nissinen, Markus Räsänen, Joni Degerman, Juulia Lautaoja, Karthik Hemanthakumar, Janne Backman, Olli Ritvos, Mika Silvennoinen, and Riikka Kivelä declare that they have no conflicts of interest.
Supporting information
Figure S1. (A) Cardiomyocyte size at 2 weeks, (B) Redd1 (Ddit4) mRNA acutely, (C) fibrosis at 4 weeks, and (d) ki67 at 2 weeks (both tissues, left panel) and acutely (right panel) in the heart after single doxorubicin and sACVR2B‐Fc injection. In Figure 1C, representative images of stained transverse heart section and tibialis anterior muscle of different groups show no marked fibrosis at this timepoint (scalebar 50 μm). In Figure 1D, lower panel shows representative Ki67 staining in muscle and in the heart (scalebar 100 μm). The n = 4–8 per group in cardiomyocyte and ki67, n = 9–10 in fibrosis, and in REDD1 n = 6–9 per group). Bonferroni post hoc tests. *, **, or *** = significant (P < 0.05, P < 0.01, or P < 0.001, respectively) difference to respective CTRL. # or ### = significant (P < 0.05, P < 0.001, respectively) difference to respective doxorubicin. Notice that muscle results of Redd1 can be found from a previous publication [4].
Figure S2. Venn graphs for individual gene transcripts changed by doxorubicin (A) in skeletal muscle (tibialis anterior) and (B) in the heart and (C–F) the effects of sACVR2B‐Fc in tibialis anterior at adjusted false discovery rate < 0.05, fold change ≥ 1.2.
Figure S3. Venn graphs for comparison of gene set enrichment analysis identified gene sets and pathways in skeletal muscle and the heart (false discovery rate < 0.05) (A–C and E). p38 MAPK pathway was down‐regulated by doxorubicin and restored by sACVR2B‐Fc treatment in skeletal muscle as (D).
Table S1. These tables present top 10 identified transcription factors that may be involved in regulation of co‐expressed genes in question. The program searched the regulatory motifs from each gene 500 bp upstream from transcription start site. Motif collection involved 9713 position weight matrices. D = doxorubicin, C = CTRL, A = doxorubicin + sACVR2B‐Fc. NES = enrichment score threshold.
Figure S4. (A) Myod mRNA levels in skeletal muscle (n = 8 per group) and (B) p‐STAT3(Tyr750)/total STAT3 protein levels in skeletal muscle and the heart (n = 7–9 per group).
Acknowledgements
Director of the Wihuri Research Institute Kari Alitalo is thanked for providing resources and valuable comments on the study design. We also thank Dr. Philippe Pierre for kindly providing the anti‐puromycin antibody. We acknowledge Maria Arrano de Kivikko, Kirsi Lintula, Arja Pasternack, Jouko Laitila, Juho Hyödynmaa, and Markus Ritvos for their valuable help and technical assistance. Biomedicum Functional Genomics Unit and Biomedicum Imaging Unit are thanked for core services and technical support.
The authors certify that they comply with the ethical guidelines for authorship and publishing of the Journal of Cachexia, Sarcopenia and Muscle.67
This work was supported by the Academy of Finland (grant nos. 275922 and 297245) and Jenny and Antti Wihuri Foundation.
Hulmi, J. J. , Nissinen, T. A. , Räsänen, M. , Degerman, J. , Lautaoja, J. H. , Hemanthakumar, K. A. , Backman, J. T. , Ritvos, O. , Silvennoinen, M. , and Kivelä, R. (2018) Prevention of chemotherapy‐induced cachexia by ACVR2B ligand blocking has different effects on heart and skeletal muscle. Journal of Cachexia, Sarcopenia and Muscle, 9: 417–432. doi: 10.1002/jcsm.12265.
Contributor Information
Juha J. Hulmi, Email: juha.hulmi@jyu.fi
Riikka Kivelä, Email: riikka.kivela@helsinki.fi.
References
- 1. Kazemi‐Bajestani SM, Mazurak VC, Baracos V. Computed tomography‐defined muscle and fat wasting are associated with cancer clinical outcomes. Semin Cell Dev Biol 2016;54:2–10. [DOI] [PubMed] [Google Scholar]
- 2. Doroshow JH, Tallent C, Schechter JE. Ultrastructural features of Adriamycin‐induced skeletal and cardiac muscle toxicity. Am J Pathol 1985;118:288–297. [PMC free article] [PubMed] [Google Scholar]
- 3. Ito H, Miller SC, Billingham ME, Akimoto H, Torti SV, Wade R, et al. Doxorubicin selectively inhibits muscle gene expression in cardiac muscle cells in vivo and in vitro. Proc Natl Acad Sci U S A 1990;87:4275–4279. [DOI] [PMC free article] [PubMed] [Google Scholar]
- 4. Nissinen TA, Degerman J, Rasanen M, Poikonen AR, Koskinen S, Mervaala E, et al. Systemic blockade of ACVR2B ligands prevents chemotherapy‐induced muscle wasting by restoring muscle protein synthesis without affecting oxidative capacity or atrogenes. Sci Rep 2016;6:32695. [DOI] [PMC free article] [PubMed] [Google Scholar]
- 5. Rasanen M, Degerman J, Nissinen TA, Miinalainen I, Kerkela R, Siltanen A, et al. VEGF‐B gene therapy inhibits doxorubicin‐induced cardiotoxicity by endothelial protection. Proc Natl Acad Sci U S A 2016;113:13144–13149. [DOI] [PMC free article] [PubMed] [Google Scholar]
- 6. Murphy KT. The pathogenesis and treatment of cardiac atrophy in cancer cachexia. Am J Physiol Heart Circ Physiol 2016;310:H466–H477. [DOI] [PubMed] [Google Scholar]
- 7. Tacar O, Sriamornsak P, Dass CR. Doxorubicin: an update on anticancer molecular action, toxicity and novel drug delivery systems. J Pharm Pharmacol 2013;65:157–170. [DOI] [PubMed] [Google Scholar]
- 8. Mitry MA, Edwards JG. Doxorubicin induced heart failure: phenotype and molecular mechanisms. Int J Cardiol Heart Vasc 2016;10:17–24. [DOI] [PMC free article] [PubMed] [Google Scholar]
- 9. Zhang S, Liu X, Bawa‐Khalfe T, Lu LS, Lyu YL, Liu LF, et al. Identification of the molecular basis of doxorubicin‐induced cardiotoxicity. Nat Med 2012;18:1639–1642. [DOI] [PubMed] [Google Scholar]
- 10. Gilliam LA, St Clair DK. Chemotherapy‐induced weakness and fatigue in skeletal muscle: the role of oxidative stress. Antioxid Redox Signal 2011;15:2543–2563. [DOI] [PMC free article] [PubMed] [Google Scholar]
- 11. Hydock DS, Lien CY, Jensen BT, Schneider CM, Hayward R. Characterization of the effect of in vivo doxorubicin treatment on skeletal muscle function in the rat. Anticancer Res 2011;31:2023–2028. [PubMed] [Google Scholar]
- 12. Min K, Kwon OS, Smuder AJ, Wiggs MP, Sollanek KJ, Christou DD, et al. Increased mitochondrial emission of reactive oxygen species and calpain activation are required for doxorubicin‐induced cardiac and skeletal muscle myopathy. J Physiol 2015;593:2017–2036. [DOI] [PMC free article] [PubMed] [Google Scholar]
- 13. Sommese L, Zullo A, Schiano C, Mancini FP, Napoli C. Possible muscle repair in the human cardiovascular System. Stem Cell Rev 2017;13:170–191. [DOI] [PubMed] [Google Scholar]
- 14. Grounds MD. The need to more precisely define aspects of skeletal muscle regeneration. Int J Biochem Cell Biol 2014;56:56–65. [DOI] [PubMed] [Google Scholar]
- 15. d'Albis A, Couteaux R, Janmot C, Roulet A, Mira JC. Regeneration after cardiotoxin injury of innervated and denervated slow and fast muscles of mammals. Myosin isoform analysis. Eur J Biochem 1988;174:103–110. [DOI] [PubMed] [Google Scholar]
- 16. McPherron AC, Lawler AM, Lee SJ. Regulation of skeletal muscle mass in mice by a new TGF‐beta superfamily member. Nature 1997;387:83–90. [DOI] [PubMed] [Google Scholar]
- 17. Chen JL, Walton KL, Winbanks CE, Murphy KT, Thomson RE, Makanji Y, et al. Elevated expression of activins promotes muscle wasting and cachexia. FASEB J 2014;28:1711–1723. [DOI] [PubMed] [Google Scholar]
- 18. Hammers DW, Merscham‐Banda M, Hsiao JY, Engst S, Hartman JJ, Sweeney HL. Supraphysiological levels of GDF11 induce striated muscle atrophy. EMBO Mol Med 2017;9:531–544. [DOI] [PMC free article] [PubMed] [Google Scholar]
- 19. Lee SJ, Reed LA, Davies MV, Girgenrath S, Goad ME, Tomkinson KN, et al. Regulation of muscle growth by multiple ligands signaling through activin type II receptors. Proc Natl Acad Sci U S A 2005;102:18117–18122. [DOI] [PMC free article] [PubMed] [Google Scholar]
- 20. Hulmi JJ, Oliveira BM, Silvennoinen M, Hoogaars WM, Ma H, Pierre P, et al. Muscle protein synthesis, mTORC1/MAPK/Hippo signaling, and capillary density are altered by blocking of myostatin and activins. Am J Physiol Endocrinol Metab 2013;304:E41–E50. [DOI] [PubMed] [Google Scholar]
- 21. Rahimov F, King OD, Warsing LC, Powell RE, Emerson CP Jr, Kunkel LM, et al. Gene expression profiling of skeletal muscles treated with a soluble activin type IIB receptor. Physiol Genomics 2011;43:398–407. [DOI] [PMC free article] [PubMed] [Google Scholar]
- 22. Zhou X, Wang JL, Lu J, Song Y, Kwak KS, Jiao Q, et al. Reversal of cancer cachexia and muscle wasting by ActRIIB antagonism leads to prolonged survival. Cell 2010;142:531–543. [DOI] [PubMed] [Google Scholar]
- 23. Toledo M, Busquets S, Penna F, Zhou X, Marmonti E, Betancourt A, et al. Complete reversal of muscle wasting in experimental cancer cachexia: additive effects of activin type II receptor inhibition and beta‐2 agonist. Int J Cancer 2016;138:2021–2029. [DOI] [PubMed] [Google Scholar]
- 24. Oh SP, Li E. The signaling pathway mediated by the type IIB activin receptor controls axial patterning and lateral asymmetry in the mouse. Genes Dev 1997;11:1812–1826. [DOI] [PubMed] [Google Scholar]
- 25. Heineke J, Auger‐Messier M, Xu J, Sargent M, York A, Welle S, et al. Genetic deletion of myostatin from the heart prevents skeletal muscle atrophy in heart failure. Circulation 2010;121:419–425. [DOI] [PMC free article] [PubMed] [Google Scholar]
- 26. Breitbart A, Auger‐Messier M, Molkentin JD, Heineke J. Myostatin from the heart: local and systemic actions in cardiac failure and muscle wasting. Am J Physiol Heart Circ Physiol 2011;300:H1973–H1982. [DOI] [PMC free article] [PubMed] [Google Scholar]
- 27. Bish LT, George I, Maybaum S, Yang J, Chen JM, Sweeney HL. Myostatin is elevated in congenital heart disease and after mechanical unloading. PLoS One 2011;6:e23818. [DOI] [PMC free article] [PubMed] [Google Scholar]
- 28. Chen JL, Walton KL, Qian H, Colgan TD, Hagg A, Watt MJ, et al. Differential effects of IL6 and activin A in the development of cancer‐associated cachexia. Cancer Res 2016;76:5372–5382. [DOI] [PubMed] [Google Scholar]
- 29. Morissette MR, Cook SA, Foo S, McKoy G, Ashida N, Novikov M, et al. Myostatin regulates cardiomyocyte growth through modulation of Akt signaling. Circ Res 2006;99:15–24. [DOI] [PMC free article] [PubMed] [Google Scholar]
- 30. Vejpongsa P, Yeh ET. Prevention of anthracycline‐induced cardiotoxicity: challenges and opportunities. J Am Coll Cardiol 2014;64:938–945. [DOI] [PubMed] [Google Scholar]
- 31. Schmidt EK, Clavarino G, Ceppi M, Pierre P. SUnSET, a nonradioactive method to monitor protein synthesis. Nat Methods 2009;6:275–277. [DOI] [PubMed] [Google Scholar]
- 32. Goodman CA, Mabrey DM, Frey JW, Miu MH, Schmidt EK, Pierre P, et al. Novel insights into the regulation of skeletal muscle protein synthesis as revealed by a new nonradioactive in vivo technique. FASEB J 2011;25:1028–1039. [DOI] [PMC free article] [PubMed] [Google Scholar]
- 33. Kallio MA, Tuimala JT, Hupponen T, Klemela P, Gentile M, Scheinin I, et al. Chipster: user‐friendly analysis software for microarray and other high‐throughput data. BMC Genomics 2011;12: 507‐2164‐12‐507. [DOI] [PMC free article] [PubMed] [Google Scholar]
- 34. Janky R, Verfaillie A, Imrichova H, Van de Sande B, Standaert L, Christiaens V, et al. iRegulon: from a gene list to a gene regulatory network using large motif and track collections. PLoS Comput Biol 2014;10:e1003731. [DOI] [PMC free article] [PubMed] [Google Scholar]
- 35. Subramanian A, Tamayo P, Mootha VK, Mukherjee S, Ebert BL, Gillette MA, et al. Gene set enrichment analysis: a knowledge‐based approach for interpreting genome‐wide expression profiles. Proc Natl Acad Sci U S A 2005;102:15545–15550. [DOI] [PMC free article] [PubMed] [Google Scholar]
- 36. Kivela R, Silvennoinen M, Lehti M, Rinnankoski‐Tuikka R, Purhonen T, Ketola T, et al. Gene expression centroids that link with low intrinsic aerobic exercise capacity and complex disease risk. FASEB J 2010;24:4565–4574. [DOI] [PMC free article] [PubMed] [Google Scholar]
- 37. Kainulainen H, Papaioannou KG, Silvennoinen M, Autio R, Saarela J, Oliveira BM, et al. Myostatin/activin blocking combined with exercise reconditions skeletal muscle expression profile of mdx mice. Mol Cell Endocrinol 2015;399:131–142. [DOI] [PubMed] [Google Scholar]
- 38. Shi X, Garry DJ. Myogenic regulatory factors transactivate the Tceal7 gene and modulate muscle differentiation. Biochem J 2010;428:213–221. [DOI] [PubMed] [Google Scholar]
- 39. Ichikawa Y, Ghanefar M, Bayeva M, Wu R, Khechaduri A, Naga Prasad SV, et al. Cardiotoxicity of doxorubicin is mediated through mitochondrial iron accumulation. J Clin Invest 2014;124:617–630. [DOI] [PMC free article] [PubMed] [Google Scholar]
- 40. Yi X, Bekeredjian R, DeFilippis NJ, Siddiquee Z, Fernandez E, Shohet RV. Transcriptional analysis of doxorubicin‐induced cardiotoxicity. Am J Physiol Heart Circ Physiol 2006;290:H1098–H1102. [DOI] [PubMed] [Google Scholar]
- 41. Shum AM, Fung DC, Corley SM, McGill MC, Bentley NL, Tan TC, et al. Cardiac and skeletal muscles show molecularly distinct responses to cancer cachexia. Physiol Genomics 2015;47:588–599. [DOI] [PubMed] [Google Scholar]
- 42. Olson EN. Regulation of muscle transcription by the MyoD family. The heart of the matter. Circ Res 1993;72:1–6. [DOI] [PubMed] [Google Scholar]
- 43. Megeney LA, Kablar B, Garrett K, Anderson JE, Rudnicki MA. MyoD is required for myogenic stem cell function in adult skeletal muscle. Genes Dev 1996;10:1173–1183. [DOI] [PubMed] [Google Scholar]
- 44. Kurabayashi M, Jeyaseelan R, Kedes L. Antineoplastic agent doxorubicin inhibits myogenic differentiation of C2 myoblasts. J Biol Chem 1993;268:5524–5529. [PubMed] [Google Scholar]
- 45. Ellisen LW, Ramsayer KD, Johannessen CM, Yang A, Beppu H, Minda K, et al. REDD1, a developmentally regulated transcriptional target of p63 and p53, links p63 to regulation of reactive oxygen species. Mol Cell 2002;10:995–1005. [DOI] [PubMed] [Google Scholar]
- 46. Deng C, Zhang P, Harper JW, Elledge SJ, Leder P. Mice lacking p21CIP1/WAF1 undergo normal development, but are defective in G1 checkpoint control. Cell 1995;82:675–684. [DOI] [PubMed] [Google Scholar]
- 47. Kurz EU, Douglas P, Lees‐Miller SP. Doxorubicin activates ATM‐dependent phosphorylation of multiple downstream targets in part through the generation of reactive oxygen species. J Biol Chem 2004;279:53272–53281. [DOI] [PubMed] [Google Scholar]
- 48. Zhu W, Soonpaa MH, Chen H, Shen W, Payne RM, Liechty EA, et al. Acute doxorubicin cardiotoxicity is associated with p53‐induced inhibition of the mammalian target of rapamycin pathway. Circulation 2009;119:99–106. [DOI] [PMC free article] [PubMed] [Google Scholar]
- 49. Patel AK, Tripathi AK, Patel UA, Shah RK, Joshi CG. Myostatin knockdown and its effect on myogenic gene expression program in stably transfected goat myoblasts. In Vitro Cell Dev Biol Anim 2014;50:587–596. [DOI] [PubMed] [Google Scholar]
- 50. Bullwinkel J, Baron‐Luhr B, Ludemann A, Wohlenberg C, Gerdes J, Scholzen T. Ki‐67 protein is associated with ribosomal RNA transcription in quiescent and proliferating cells. J Cell Physiol 2006;206:624–635. [DOI] [PubMed] [Google Scholar]
- 51. von Walden F, Liu C, Aurigemma N, Nader GA. mTOR signaling regulates myotube hypertrophy by modulating protein synthesis, rDNA transcription, and chromatin remodeling. Am J Physiol Cell Physiol 2016;311:C663–C672. [DOI] [PubMed] [Google Scholar]
- 52. Shoshani T, Faerman A, Mett I, Zelin E, Tenne T, Gorodin S, et al. Identification of a novel hypoxia‐inducible factor 1‐responsive gene, RTP801, involved in apoptosis. Mol Cell Biol 2002;22:2283–2293. [DOI] [PMC free article] [PubMed] [Google Scholar]
- 53. Tidball JG, Villalta SA. Regulatory interactions between muscle and the immune system during muscle regeneration. Am J Physiol Regul Integr Comp Physiol 2010;298:R1173–R1187. [DOI] [PMC free article] [PubMed] [Google Scholar]
- 54. Velez JM, Miriyala S, Nithipongvanitch R, Noel T, Plabplueng CD, Oberley T, et al. p53 Regulates oxidative stress‐mediated retrograde signaling: a novel mechanism for chemotherapy‐induced cardiac injury. PLoS One 2011;6:e18005. [DOI] [PMC free article] [PubMed] [Google Scholar]
- 55. Fox DK, Ebert SM, Bongers KS, Dyle MC, Bullard SA, Dierdorff JM, et al. p53 and ATF4 mediate distinct and additive pathways to skeletal muscle atrophy during limb immobilization. Am J Physiol Endocrinol Metab 2014;307:E245–E261. [DOI] [PMC free article] [PubMed] [Google Scholar]
- 56. Yndestad A, Finsen AV, Ueland T, Husberg C, Dahl CP, Oie E, et al. The homeostatic chemokine CCL21 predicts mortality and may play a pathogenic role in heart failure. PLoS One 2012;7:e33038. [DOI] [PMC free article] [PubMed] [Google Scholar]
- 57. Finsen AV, Ueland T, Sjaastad I, Ranheim T, Ahmed MS, Dahl CP, et al. The homeostatic chemokine CCL21 predicts mortality in aortic stenosis patients and modulates left ventricular remodeling. PLoS One 2014;9:e112172. [DOI] [PMC free article] [PubMed] [Google Scholar]
- 58. Kotamraju S, Chitambar CR, Kalivendi SV, Joseph J, Kalyanaraman B. Transferrin receptor‐dependent iron uptake is responsible for doxorubicin‐mediated apoptosis in endothelial cells: role of oxidant‐induced iron signaling in apoptosis. J Biol Chem 2002;277:17179–17187. [DOI] [PubMed] [Google Scholar]
- 59. Barrientos T, Laothamatas I, Koves TR, Soderblom EJ, Bryan M, Moseley MA, et al. Metabolic catastrophe in mice lacking transferrin receptor in muscle. EBioMedicine 2015;2:1705–1717. [DOI] [PMC free article] [PubMed] [Google Scholar]
- 60. Martinez‐Redondo V, Pettersson AT, Ruas JL. The hitchhiker's guide to PGC‐1alpha isoform structure and biological functions. Diabetologia 2015;58:1969–1977. [DOI] [PubMed] [Google Scholar]
- 61. Mutikainen M, Tuomainen T, Naumenko N, Huusko J, Smirin B, Laidinen S, et al. Peroxisome proliferator‐activated receptor‐gamma coactivator 1 alpha1 induces a cardiac excitation‐contraction coupling phenotype without metabolic remodelling. J Physiol 2016;594:7049–7071. [DOI] [PMC free article] [PubMed] [Google Scholar]
- 62. Kunisada K, Negoro S, Tone E, Funamoto M, Osugi T, Yamada S, et al. Signal transducer and activator of transcription 3 in the heart transduces not only a hypertrophic signal but a protective signal against doxorubicin‐induced cardiomyopathy. Proc Natl Acad Sci U S A 2000;97:315–319. [DOI] [PMC free article] [PubMed] [Google Scholar]
- 63. Biesemann N, Mendler L, Wietelmann A, Hermann S, Schafers M, Kruger M, et al. Myostatin regulates energy homeostasis in the heart and prevents heart failure. Circ Res 2014;115:296–310. [DOI] [PubMed] [Google Scholar]
- 64. Yndestad A, Ueland T, Oie E, Florholmen G, Halvorsen B, Attramadal H, et al. Elevated levels of activin A in heart failure: potential role in myocardial remodeling. Circulation 2004;109:1379–1385. [DOI] [PubMed] [Google Scholar]
- 65. Hulmi JJ, Oliveira BM, Silvennoinen M, Hoogaars WM, Pasternack A, Kainulainen H, et al. Exercise restores decreased physical activity levels and increases markers of autophagy and oxidative capacity in myostatin/activin‐blocked mdx mice. Am J Physiol Endocrinol Metab 2013;305:E171–E182. [DOI] [PubMed] [Google Scholar]
- 66. Morine KJ, Bish LT, Selsby JT, Gazzara JA, Pendrak K, Sleeper MM, et al. Activin IIB receptor blockade attenuates dystrophic pathology in a mouse model of Duchenne muscular dystrophy. Muscle Nerve 2010;42:722–730. [DOI] [PMC free article] [PubMed] [Google Scholar]
- 67. von Haehling S, Morley JE, Coats AJ, Anker SD. Ethical guidelines for publishing in the Journal of Cachexia, Sarcopenia and Muscle: update 2015. J Cachexia Sarcopenia Muscle 2015;6:315–316. [DOI] [PMC free article] [PubMed] [Google Scholar]
Associated Data
This section collects any data citations, data availability statements, or supplementary materials included in this article.
Supplementary Materials
Figure S1. (A) Cardiomyocyte size at 2 weeks, (B) Redd1 (Ddit4) mRNA acutely, (C) fibrosis at 4 weeks, and (d) ki67 at 2 weeks (both tissues, left panel) and acutely (right panel) in the heart after single doxorubicin and sACVR2B‐Fc injection. In Figure 1C, representative images of stained transverse heart section and tibialis anterior muscle of different groups show no marked fibrosis at this timepoint (scalebar 50 μm). In Figure 1D, lower panel shows representative Ki67 staining in muscle and in the heart (scalebar 100 μm). The n = 4–8 per group in cardiomyocyte and ki67, n = 9–10 in fibrosis, and in REDD1 n = 6–9 per group). Bonferroni post hoc tests. *, **, or *** = significant (P < 0.05, P < 0.01, or P < 0.001, respectively) difference to respective CTRL. # or ### = significant (P < 0.05, P < 0.001, respectively) difference to respective doxorubicin. Notice that muscle results of Redd1 can be found from a previous publication [4].
Figure S2. Venn graphs for individual gene transcripts changed by doxorubicin (A) in skeletal muscle (tibialis anterior) and (B) in the heart and (C–F) the effects of sACVR2B‐Fc in tibialis anterior at adjusted false discovery rate < 0.05, fold change ≥ 1.2.
Figure S3. Venn graphs for comparison of gene set enrichment analysis identified gene sets and pathways in skeletal muscle and the heart (false discovery rate < 0.05) (A–C and E). p38 MAPK pathway was down‐regulated by doxorubicin and restored by sACVR2B‐Fc treatment in skeletal muscle as (D).
Table S1. These tables present top 10 identified transcription factors that may be involved in regulation of co‐expressed genes in question. The program searched the regulatory motifs from each gene 500 bp upstream from transcription start site. Motif collection involved 9713 position weight matrices. D = doxorubicin, C = CTRL, A = doxorubicin + sACVR2B‐Fc. NES = enrichment score threshold.
Figure S4. (A) Myod mRNA levels in skeletal muscle (n = 8 per group) and (B) p‐STAT3(Tyr750)/total STAT3 protein levels in skeletal muscle and the heart (n = 7–9 per group).