Abstract
Conventional beam orientation optimization (BOO) algorithms for IMRT assume that the same set of beam angles is used for all treatment fractions. In this paper we present a BOO formulation based on group sparsity that simultaneously optimizes non-coplanar beam angles for all fractions, yielding a fraction-variant (FV) treatment plan. Beam angles are selected by solving a multi-fraction fluence map optimization problem involving 500–700 candidate beams per fraction, with an additional group sparsity term that encourages most candidate beams to be inactive. The optimization problem is solved using the Fast Iterative Shrinkage-Thresholding Algorithm. Our FV BOO algorithm is used to create five-fraction treatment plans for digital phantom, prostate, and lung cases as well as a 30-fraction plan for a head and neck case. A homogeneous PTV dose coverage is maintained in all fractions. The treatment plans are compared with fraction-invariant plans that use a fixed set of beam angles for all fractions. The FV plans reduced OAR mean dose and D2 values on average by 3.3% and 3.8% of the prescription dose, respectively. Notably, mean OAR dose was reduced by 14.3% of prescription dose (rectum), 11.6% (penile bulb), 10.7% (seminal vesicle), 5.5% (right femur), 3.5% (bladder), 4.0% (normal left lung), 15.5% (cochleas), and 5.2% (chiasm). D2 was reduced by 14.9% of prescription dose (right femur), 8.2% (penile bulb), 12.7% (proximal bronchus), 4.1% (normal left lung), 15.2% (cochleas), 10.1% (orbits), 9.1% (chiasm), 8.7% (brainstem), and 7.1% (parotids). Meanwhile, PTV homogeneity defined as D95/D5 improved from .92 to .95 (digital phantom), from .95 to .98 (prostate case), and from .94 to .97 (lung case), and remained constant for the head and neck case. Moreover, the FV plans are dosimetrically similar to conventional plans that use twice as many beams per fraction. Thus, FV BOO offers the potential to reduce delivery time for non-coplanar IMRT.
Keywords: Group sparsity, beam orientation optimization, proximal algorithms, non-coplanar IMRT
1 Introduction
Compared to coplanar IMRT and volumetric modulated arc therapy (VMAT), non-coplanar IMRT with beam orientation optimization (BOO) has been shown to improve dose compactness and organ-at-risk (OAR) sparing substantially for various cancer sites (Woods et al. 2016; Dong et al. 2013a; Dong et al. 2013b; Dong et al. 2014a; Nguyen et al. 2014a; Nguyen et al. 2014b; Rwigema et al. 2015; Dong et al. 2014b). However, a large number of non-coplanar beams (typically 15 or more) are needed to maximize dosimetric improvement, resulting in a longer treatment time that may not be clinically viable. This problem is compounded by the additional maneuvering of the gantry and couch that is needed for non-coplanar delivery. To overcome this challenge, we examine a traditional but seemingly unnecessary constraint in radiotherapy planning — namely, the use of a fixed set of beam angles for all fractions of the treatment course. By removing this constraint and utilizing different beam angles in different fractions, the same dosimetric improvement may be achieved while using fewer beams per fraction, thus avoiding long treatment delivery times.
The dosimetric benefit of spatiotemporally non-uniform fractionation schemes has been investigated recently in the papers (Unkelbach, Zeng, and Engelsman 2013; Unkelbach 2015; Unkelbach and Papp 2015), which solve a BED-based multi-fraction fluence map optimization problem to obtain treatment plans that deliver distinct dose distributions in different fractions. Spatiotemporally modulated radiotherapy has also been investigated in the papers (Kim, Ghate, and Phillips 2009; Kim, Stewart, and Phillips 2015; Kim and Phillips 2016; Saberian, Ghate, and Kim 2017), which optimize fractionation schedules based on a linear-quadratic cell survival model. The paper (Kim, Ghate, and Phillips 2012) formulates the treatment planning problem as a discrete-time stochastic control problem using functional imaging to observe the system state and using beam intensities as controls. Adaptive fractionation was posed a control problem in (Ramakrishnan et al. 2012), which varies the tumor dose received at each fraction based on measurements of patient anatomy, with the goal of minimizing cumulative dose to an OAR while meeting dose requirements for the tumor. However, in these studies, the treatment plans are optimized using the same set of beams or VMAT arcs in all fractions, and the idea of fraction-variant beam angle selection is not considered.
In the context of proton therapy, a modality known as single-field uniform dose (SFUD) delivers uniform and constant dose to the tumor using varying beam angles. Faced with a similar challenge of minimizing the time for gantry rotation in proton therapy, SFUD delivery alternates between several pre-selected beams and avoids high entrance dose to any particular volume (Lomax 1999). In SFUD planning, each field is independently optimized to cover the target uniformly, while OAR doses vary between fields. In addition to providing for a shorter treatment delivery time, SFUD has been shown to be more robust than multifield optimization intensity-modulated proton therapy (MFO-IMPT). However, due to the more restrictive optimization space, SFUD dosimetry has been found inferior to that of MFO-IMPT (Harding et al. 2014; Kirk et al. 2015; Zhu et al. 2011; Stuschke et al. 2012).
IMRT with field rotation was studied in (Dink et al. 2012), which first partitions a set of coplanar candidate beams into M disjoint subsets S1, …, SM, with each subset consisting of evenly spaced beams, and then assigns one of these M subsets to each treatment fraction. The particular subset that is selected varies from fraction to fraction. (So, if F is the total number of treatment fractions, and Fm is the number of fractions for which subset m is selected, then F1 +⋯+ FM = F.) A mixed integer linear program is solved to determine the integers Fm and to compute fluence maps for all beams. The results in (Dink et al. 2012) provide an important demonstration of the dosimetric benefits of fraction-variant beam angle selection, and it is desirable to extend this line of research to the setting of non-coplanar IMRT.
In this paper we investigate the potential improvement in cumulative physical dose distribution from allowing beam orientations to vary between fractions. We present a BOO formulation based on group sparsity that simultaneously optimizes non-coplanar beam angles for all fractions, yielding fraction-variant treatment plans.
2 Methods
2.1 Notation
Before presenting a problem formulation for fraction-variant beam orientation optimization, we first establish some notation.
F is the total number of treatment fractions. We use F = 30 for conventional fractionation, or F = 5 for SBRT.
B is the number of candidate beams per fraction. Typically B is between 500 and 700 for non-coplanar IMRT cases after colliding beams are removed. We assume that the pool of candidate beam angles is the same for each fraction, but we make no requirement that the same beam angles are used during each treatment session. The total number of candidate beams (including all candidate beams from all fractions) is BF.
The vector xf,b is the fluence map for the bth candidate beam on treatment day f.
- The vector xf (for f = 1, …, F) is the concatenation of the vectors xf,b, and the vector x is the concatenation of the vectors xf:
The matrix is the dose-calculation matrix for the PTV (when i = 0) or for the ith OAR (i = 1,…, N). Here is the block column of Ai corresponding to the bth beam firing position. Note that is a vector that records how much dose is delivered to each voxel of the ith structure on treatment day f.
- For i = 1, …, N, we define
where the matrix Ai is repeated F times. A key point is that only one copy of Ai must be stored in computer memory, so introducing Āi does not increase RAM requirements. Notice that the vector
stores the total dose delivered to each voxel in the ith OAR, summed over all treatment fractions. The vector d0 stores the prescription doses for each voxel in the PTV, and the vectors di (for i = 1, …, N) store prescribed maximum doses for each voxel in the ith OAR.
The notation y+ (where y is a vector) is defined by y+ = max(y, 0), with the maximum taken componentwise.
- The function is the Huber penalty (with parameter μ > 0), defined by
The notation indicates that the Huber penalty is simply a smoothed out version of the ℓ1-norm, and μ controls the amount of smoothing.(1) The matrix D represents a discrete gradient operator, so that Dx is a list of intensity differences between adjacent beamlets. The function is a smoothed total variation regularization penalty function. Total variation regularization has been used in fluence map optimization to encourage fluence maps to be piecewise constant, which enhances plan deliverability (Kim et al. 2012; Zhu et al. 2008; Nguyen et al. 2015).
2.2 Fraction-variant beam orientation optimization
With the above notation in place, we are now ready to present a problem formulation for fraction-variant (FV) beam orientation optimization. We propose to select beam orientations for all fractions simultaneously by solving a multi-fraction fluence map optimization problem involving a large number of candidate beams, with an additional group sparsity penalty term in the objective function that encourages most candidate beams to be inactive. The group sparsity approach to beam orientation optimization is an established technique that was introduced in (Jia et al. 2011) and was shown to have state of the art performance in (O’Connor et al. 2016) and (Liu, Dong, and Xing 2017). In detail, our FV BOO problem formulation is
| (2) |
where 0 < p < 1. We take p = 1=2 for all experiments in this paper. (Our motivation for choosing p = 1=2, as well as an explanation of why the value p = 1 is forbidden, is given in appendix C.) The PTV terms encourage the PTV to be covered uniformly at each fraction, so that A0xf ≈ d0/F for f = 1,…, F. The OAR terms penalize the cumulative dose delivered to OARs (summed over all fractions), and the terms specifically penalize violations of the prescribed dose limits for i = 1,…, N. It is possible to obtain high quality treatment plans by setting di = 0 for i = 1, … N. However, nonzero values of di can provide further control over the shape of dose-volume histograms. The smoothed total variation regularization term encourages all fluence maps for all fractions to be piecewise constant, for enhanced plan deliverability. The group sparsity term encourages most candidate beams to be inactive, while allowing for a different set of beams to be active at each fraction. The remaining active (nonzero) beams for each fraction are the ones selected to be used during treatment. In practice we find that approximately the same number of beams are selected for each fraction, although this requirement is not enforced explicitly. The weights wb can be chosen to be all the same, so that wb = c for all b. Alternatively, the weights wb can be computed (up to a common scale factor c) according to the strategy explained in appendix D. Either way, the scaling parameter c is tuned to control the number of active beams in the solution to (2). The weights wb do not have to be tuned individually. Once the beam angle selection step is complete, fluence maps for all selected beams (for all fractions) are computed simultaneously by solving a convex multi-fraction fluence map optimization (FMO) problem which is similar to problem (2), but with no group sparsity term and using only the beams which were selected for each fraction. In more detail, let Ωf ⊂ {1,…,B} be the set of all indices of beam firing positions which were not selected for use during fraction f. The multi-fraction FMO problem is
| (3) |
A similar polishing step was used in (Jia et al. 2011) to prevent the group sparsity term from exerting any influence on the final fluence map intensity values.
The objective function in (2) does not directly impose control over the per fraction dose delivered to OARs. Thus, as compared with traditional fraction-invariant treatment planning algorithms, the model (2) might accept higher than normal OAR doses in certain particular fractions for the sake of minimizing the cumulative OAR dose. This tradeoff between controlling the per fraction OAR dose and minimizing the cumulative OAR dose can be observed in the results shown in section 3. In section 4, we will discuss the possibility of alternative problem formulations which limit both per fraction OAR dose and cumulative dose, as was done in the setting of coplanar IMRT in the original work (Dink et al. 2012).
We solve the optimization problem (2) using an accelerated proximal gradient method known as the Fast Iterative Shrinkage-Thresholding Algorithm (FISTA) (Beck and Teboulle 2009; Scheinberg, Goldfarb, and Bai 2014). Details of the algorithm are given in appendix A. Standard convergence results for FISTA assume that the optimization problem is convex, but we have found that FISTA converges to a good solution when p = 1/2, in which case problem (2) is non-convex. Note that when F = 1 and the group sparsity term is omitted, problem (2) reduces to a standard fluence map optimization problem that uses quadratic or one-sided quadratic dose fidelity penalty terms. In this special case, problem (2) is convex, and FISTA is guaranteed to find a globally optimal solution.
2.3 Experimental setup
A digital phantom as well as an SBRT prostate, an SBRT lung, and a conventionally fractionated head and neck patient with a single-level prescription dose to the unilateral lesion were selected to test and evaluate the proposed algorithm. The prescription doses and PTV volumes for each case are listed in table 1. The digital phantom consists of a body structure containing a C-shaped PTV that is wrapped around a cylindrical OAR. For the digital phantom, there were 60 coplanar candidate beam firing positions, with six degrees of separation between adjacent beams. For cases “PRT”, “LNG”, and “H&N”, we began with 1162 non-coplanar candidate beam firing positions evenly distributed over the surface of a sphere, with approximately six degrees of separation between adjacent beams. A 3D human surface measurement and a machine CAD model were utilized to identify collision zones, and beam angles that resulted in collisions were removed (Yu et al. 2015). As a result, 500–700 non-coplanar candidate beam firing positions, as reported in table 2, were retained for dose calculation and optimization. Beamlet dose was calculated for all beams within the conformal aperture +5 mm margin using convolution/superposition with a 6 MV polyenergetic kernel (Neylon et al. 2014). The dose calculation resolution was isotropically 2.5 mm. The MLC leaf width at the isocenter was assumed to be 5 mm.
Table 1.
Prescription dose and PTV volume for digital phantom and prostate, lung, and head and neck patients.
| Case | Prescription dose (Gy) | PTV volume (cc) |
|---|---|---|
| PHM | 40 | 28.4 |
| PRT | 40 | 111.2 |
| LNG | 48 | 72.3 |
| H&N | 66 | 33.6 |
Table 2.
Number of fractions, number of candidate beams per fraction, total number of beamlets (for all candidate beams in all fractions), average number of beams selected per fraction, and FISTA runtimes for cases “PHM”, “PRT”, “LNG”, and “H&N”.
| Case | Num. fractions | Num. candidate beams per fraction | Total num. beamlets | Avg. num. of beams selected per fraction | Runtime (hrs) |
|---|---|---|---|---|---|
| PHM | 5 | 60 | 19,185 | 5.8 | 0.18 |
| PRT | 5 | 674 | 569,770 | 9.6 | 1.5 |
| LNG | 5 | 520 | 347,240 | 6.6 | 1.1 |
| H&N | 30 | 741 | 2,013,870 | 6.36 | 6.6 |
For each of the four cases, problem (2) was solved using the FISTA with line search algorithm 1 (see appendix A). The weight parameters η, αi, βi, and γ appearing in the penalty functions and the vectors di were tuned on a case by case basis to achieve high quality treatment plans. The Huber penalty smoothing parameter μ was set to 1. The beam weights wb were chosen as in equation (14), with the parameter c in (14) tuned to yield a reasonable number of active beams per fraction. The optimization variable x was initialized randomly with components between 0 and 1, drawn independently from a uniform distribution. The parameters r and s in algorithm 1 were taken to be r = .5 and s = 1.25. FISTA was run for 2000 iterations for the digital phantom and 5000 iterations for the other cases. This was sufficiently many iterations for the algorithm to converge on a stable selection of beams for each fraction. The FISTA runtimes are shown in table 2.
The resulting FV treatment plans were compared with treatment plans that are conventional in the sense that they use a fixed set of beam angles and fluence maps for all fractions. The conventional plans were computed by setting F = 1 in problem (2), without changing the number of candidate beams per fraction. (These conventional plans will be described as fraction-invariant (FI) to emphasize that they are not FV.) For each case, the fraction-invariant plans were computed using identical OAR weights as were used for the fraction-variant plan, except that for cases “PHM” and “H&N” the skin structure weighting was increased when computing the FI plans to prevent unacceptable hot spots on the skin. Note that both the FV plans and the FI plans use non-coplanar beam angles for cases “PRT”, “LNG”, and “H&N”.
For plan comparison, PTV D98, D99, and PTV homogeneity defined as D95/D5 were evaluated. All treatment plans were scaled so that PTV D95 was equal to the prescription dose. OAR max dose Dmax, mean dose Dmean, and D2 values were also calculated for assessment. Here Dmax refers to the maximum dose received by any voxel in a given OAR, and D2 refers to the maximum dose which was received by at least 2% of the voxels in the OAR. All treatment plans were created on a computer with two Intel Xeon CPU E5-2687W v3 3.10 GHz processors and 512 GB of RAM.
3 Results
3.1 Digital phantom
Figure 1(a) shows dose colormaps for each of the five fractions for the FV digital phantom plan. Notice that despite the variation in dose distributions, the PTV is covered uniformly in all fractions. Each voxel in the PTV receives a dose of approximately 40/5 = 8 Gy per fraction. Dose-volume histograms for each of the five fractions are shown in figure 2. Figure 3 visualizes the beam angles that were selected for each of the five fractions using the FV BOO algorithm. The FV BOO algorithm selected 5.8 beams per fraction, on average. As expected, the algorithm did not select the same set of beam angles for each fraction. In fact, a total of 26 distinct beam firing positions were utilized, as visualized in figure 3.
Figure 1.
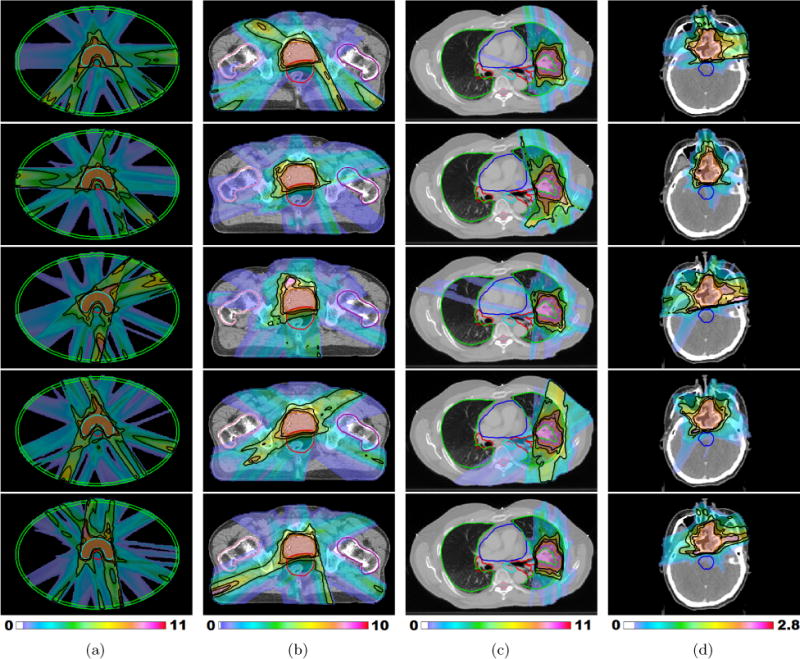
(a) – (c) Fraction-variant treatment plans for each of five fractions for cases “PHM”, “PRT” and “LNG”. The PTV receives a uniform dose of 8 Gy (approximately) at each fraction for cases “PHM” and “PRT” and 9.6 Gy (approximately) for case “LNG”. (d) Dose colormaps for fractions 1, 7, 13, 19, and 25 for case “H&N”. The PTV receives a uniform dose of 2.2 Gy (approximately) throughout the treatment course. Isodose lines for 50%, 80%, and 95% of the per fraction prescription dose are shown in black.
Figure 2.
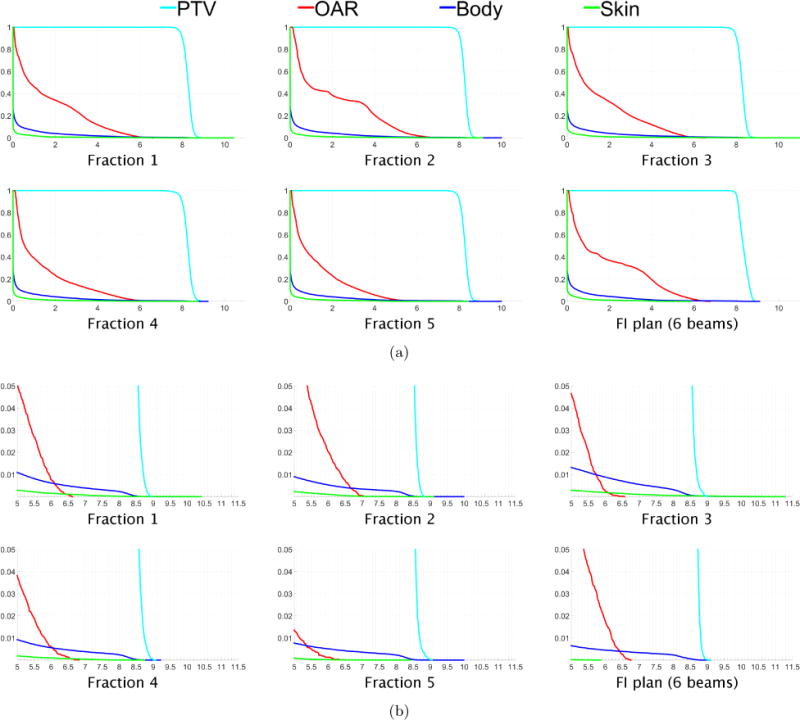
(a) Dose-volume histograms for each of five fractions for the digital phantom case “PHM”. The DVH for one fraction of the 6-beam FI plan is shown in the lower right. (b) Close-up views of the high dose range for the DVHs in (a).
Figure 3.
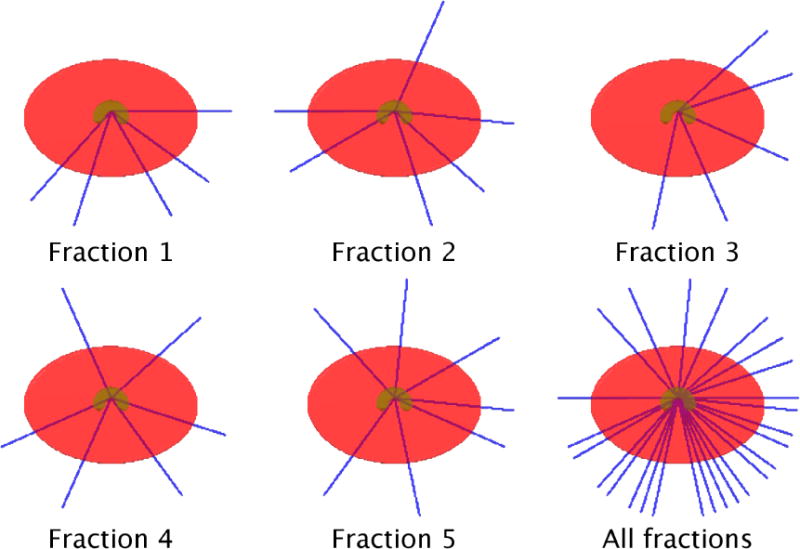
Beam angles selected for each of five fractions for the digital phantom case “PHM”. On average 5.8 beams per fraction were selected. A total of 26 distinct beam firing positions were utilized for case “PHM”.
Figure 4(a) shows the cumulative dose distribution, summed over all five fractions, for the FV plan (top row) as well as a 6-beam FI plan (second row) and a 12-beam FI plan (third row). Corresponding dose-volume histograms, comparing the FV plan with these two FI plans, are shown in figure 4(b)–(c). The Dmean, D2, and Dmax values for the OAR, body, and skin structures are reported for the FV plan and the 6-beam FI plan in table 3. Compared with the 6-beam FI plan, the FV plan reduces dose to the OAR and improves dose compactness. The Dmean and D2 values for the OAR were reduced by 1.7 Gy and 2.5 Gy, respectively. The PTV coverage is more homogeneous for the FV plan. The dosimetric quality of the FV plan is similar to that of the 12-beam FI plan, despite the fact that the FV plan uses only half as many beams per fraction. As an additional point of reference, an FI plan made using the Eclipse treatment planning system with 12 evenly spaced beams is shown in the fourth row of figure 4(a).
Figure 4.
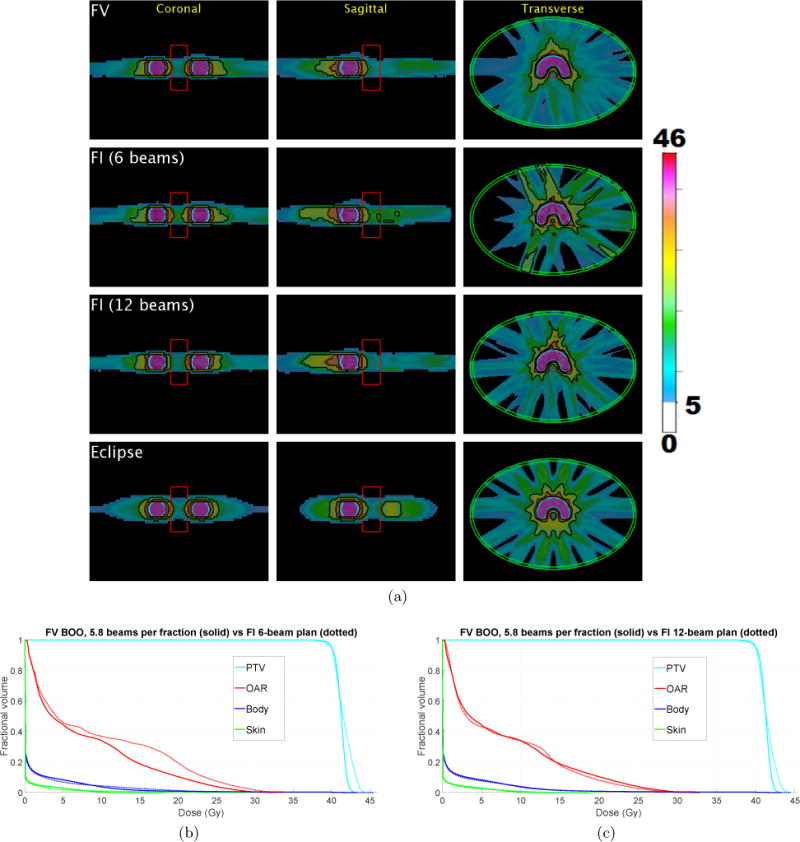
(a) The cumulative dose distribution (summed over all five fractions) for the FV plan using average of 5.8 beams per fraction (first row) as well as a 6-beam FI plan (second row) and a 12-beam FI plan (third row). A plan made using Eclipse with 12 evenly spaced beams is shown in the fourth row. Isodose lines for 50%, 80%, and 95% of the prescription dose are shown in black. Dose below 5 Gy is not shown. (b)–(c) Dose-volume histograms for digital phantom case “PHM”, comparing FV plan that uses 5.8 beams per fraction (solid) with FI plans (dotted) using (b) 6 beams, and (c) 12 beams.
Table 3.
Dmean, D2 and Dmax (in units of Gy) for the OAR, body, and skin structures for both the FV and 6-beam FI cumulative dose distributions. FV BOO results are shown in black and FI results are shown in blue.
| OAR | Body | Skin | |
|---|---|---|---|
| Dmean | 7.5 [9.3] | 1.2 [1.2] | 0.4 [0.4] |
| D2 | 27.1 [29.6] | 13.1 [17.2] | 6.5 [4.6] |
| Dmax | 32.9 [33.7] | 43.3 [45.5] | 18.5 [29.3] |
The tradeoff between minimizing the cumulative dose to critical structures and limiting the dose per fraction can be observed, for example, in figure 2(b), where it can be seen that for the FV plan the maximum dose to the body is 10 Gy in fractions 2 and 5, whereas the 6-beam FI plan limits the maximum per fraction dose to the body to 9.1 Gy. This tradeoff can also be observed in the fact that for the FV plan the maximum dose to the skin is 11.3 Gy in fraction 3, whereas the FI plan limits the per fraction dose to the skin to at most 5.86 Gy. Meanwhile, the maximum cumulative dose to the skin for the FI plan is 5.86 × 5 = 29.3 Gy, whereas the maximum cumulative skin dose for the FV plan is only 18.5 Gy.
3.2 Prostate case
Figure 1(b) shows dose colormaps for each of the five fractions for the FV prostate plan. Despite the variation in dose distributions, the PTV is covered uniformly in all fractions, with each voxel in the PTV receiving a dose of approximately 40/5 = 8 Gy per fraction. Dose-volume histograms for each of the five fractions are shown in figure 5. Figure 6 visualizes the beam angles that were selected for each of five fractions for the prostate case using the FV BOO algorithm. Each beam is specified by a couch angle and a gantry angle. The FV BOO algorithm selected 9.6 beams per fraction, on average. As anticipated, the algorithm did not select the same set of beam angles for each fraction. In fact, a total of 44 distinct beam firing positions were utilized, as visualized in figure 6.
Figure 5.
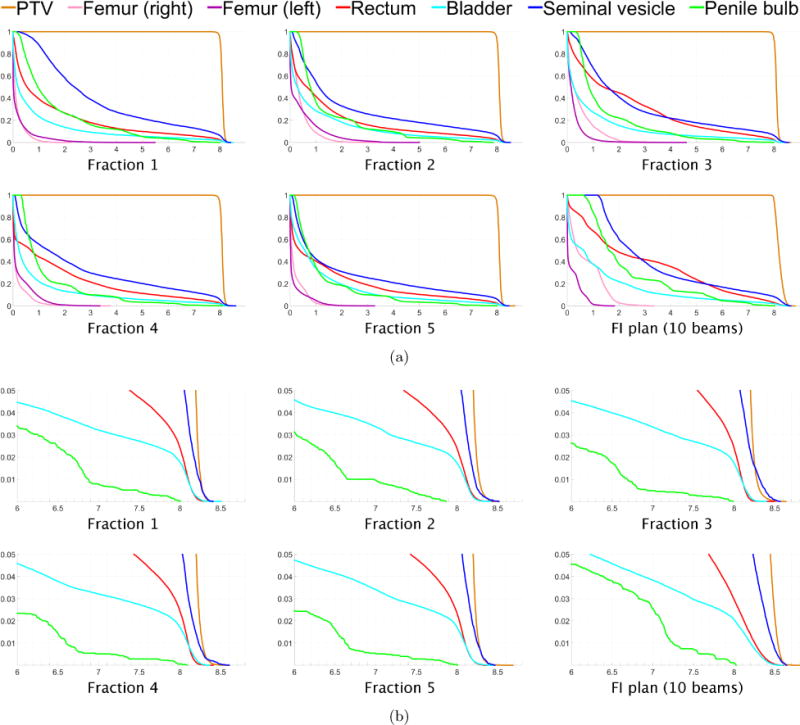
(a) Dose-volume histograms for each of five fractions for prostate case “PRT”. The DVH for one fraction of the 10-beam FI plan is shown in the lower right. (b) Close-up views of the high dose range for the DVHs in (a).
Figure 6.

Beam angles selected for each of five fractions for prostate case “PRT”. On average 9.6 beams per fraction were selected. A total of 44 distinct beam firing positions were utilized for case “PRT”, as shown in the lower right.
Figure 7(a) shows the cumulative dose distribution, summed over all five fractions, for the FV plan (top row) as well as a 10-beam FI plan (second row) and a 20-beam FI plan (third row). Corresponding dose-volume histograms, comparing the FV plan with these two FI plans, are shown in figure 7(b)–(c). The Dmean, D2, and Dmax values for all OARs are reported for the FV plan and the 10-beam FI plan in table 4. Compared with the 10-beam FI plan, the FV plan achieves dosimetric improvements for all OARs except the left femur, which receives similar low doses in both plans. The dosimetric improvement to the anterior rectum is particularly evident. Mean dose Dmean was reduced by 5.7 Gy (rectum), 4.6 Gy (penile bulb), 4.3 Gy (seminal vesicle), and 1.4 Gy (bladder). D2 was reduced by 6.0 Gy (right femur), 3.3 Gy (penile bulb), and 1.3 Gy (seminal vesicle). The PTV coverage is more homogeneous for the FV plan. The dosimetric quality of the FV plan is similar to that of the 20-beam FI plan, despite the fact that the FV plan uses only half as many beams per fraction. As an additional point of reference, a clinical VMAT plan made using the Eclipse treatment planning system with two full coplanar arcs is shown in the fourth row of figure 7(a).
Figure 7.
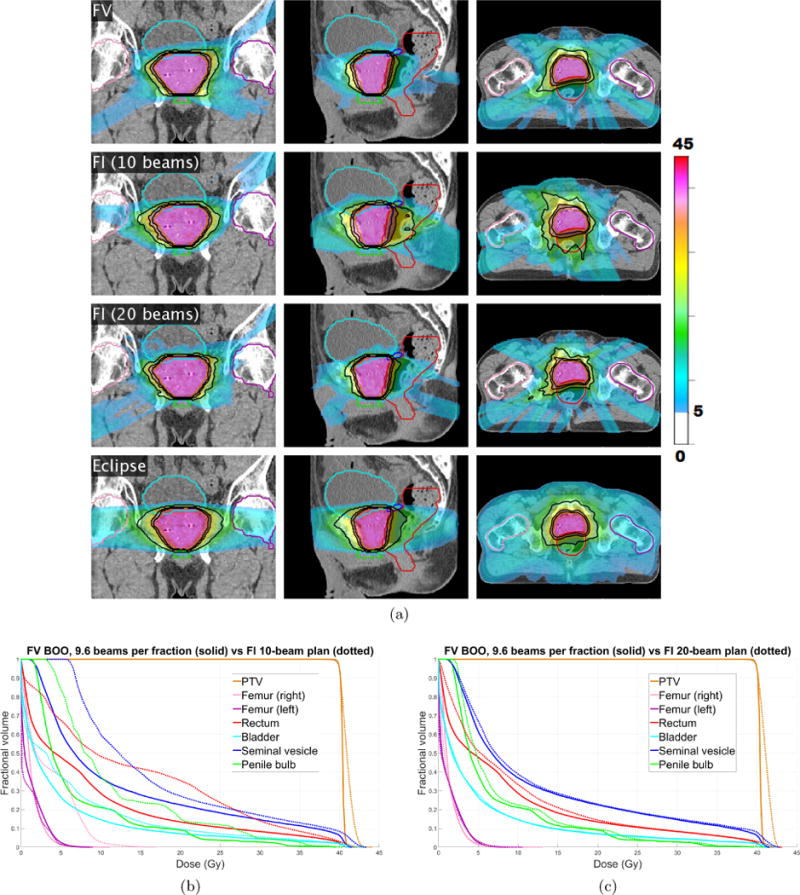
(a) The cumulative dose distribution (summed over all five fractions) for the FV plan using average of 9.6 beams per fraction (first row) as well as a 10-beam FI plan (second row) and a 20-beam FI plan (third row). A VMAT plan made using Eclipse is shown in the fourth row. Isodose lines for 50%, 80%, and 95% of the prescription dose are shown in black. Dose below 5 Gy is not shown. (b)–(c) Dose-volume histograms for prostate case “PRT”, comparing FV plan that uses 9.6 beams per fraction (solid) with FI plans (dotted) using (b) 10 beams, and (c) 20 beams.
Table 4.
Dmean, D2 and Dmax (in units of Gy) for all OARS for the FV and the 10-beam FI cumulative dose distributions. FV BOO results are shown in black and FI results are in blue.
| Femur (R) | Femur (L) | Rectum | Bladder | Seminal vesicle | Penile bulb | |
|---|---|---|---|---|---|---|
| Dmean | 1.4 [3.6] | 1.2 [1.0] | 8.6 [14.4] | 5.2 [6.7] | 12.5 [16.8] | 7.0 [11.7] |
| D2 | 4.6 [10.7] | 5.2 [4.8] | 40.1 [40.6] | 39.7 [40.1] | 40.7 [42.0] | 32.2 [35.5] |
| Dmax | 11.1 [16.7] | 8.7 [9.1] | 41.5 [43.0] | 41.3 [43.0] | 41.5 [43.2] | 39.5 [40.1] |
3.3 Lung case
Figure 1(c) shows dose colormaps for each of the five fractions for the FV lung plan. The PTV is covered uniformly at each fraction, with each voxel in the PTV receiving a dose of approximately 48/5 = 9.6 Gy per fraction. Dose-volume histograms for each of the five fractions are shown in figure 8. On average, only 6.6 beams per fraction were selected. Again, the algorithm did not select the same set of beam angles for any two fractions. A total of 27 distinct beam firing positions were utilized.
Figure 8.
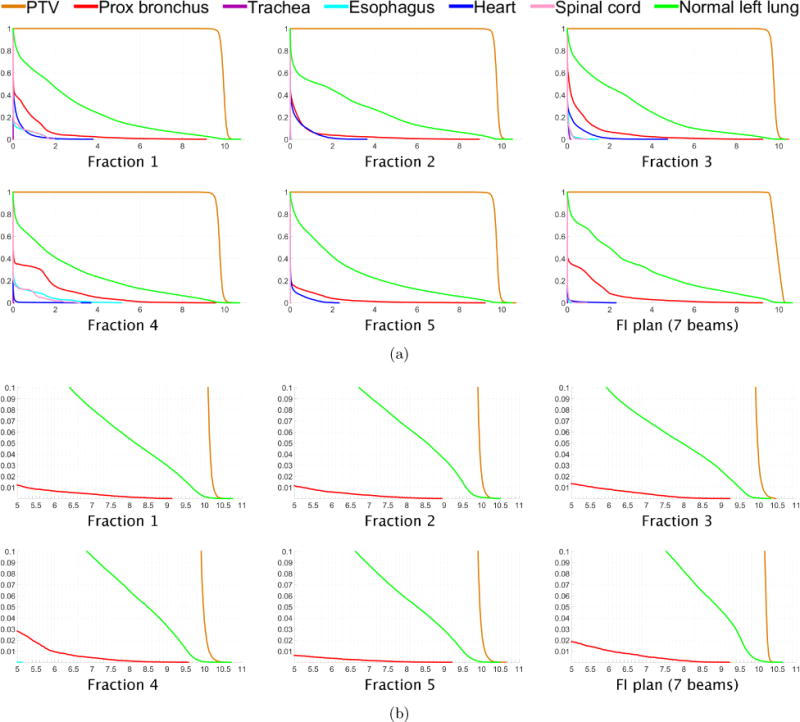
(a) Dose-volume histograms for each of five fractions for lung case “LNG”. The DVH for one fraction of the 7-beam FI plan is shown in the lower right. (b) Close-up views of the high dose range for the DVHs in (a).
Figure 9(a) shows the cumulative dose distribution, summed over all five fractions, for the FV plan (first row) as well as a 7-beam FI plan (second row) and a 13-beam FI plan (third row). Corresponding dose-volume histograms, comparing the FV plan with these two FI plans, are shown in figure 9(b)–(c). The Dmean, D2, and Dmax values for all OARs are reported for the FV plan and the 7-beam FI plan in table 5. Compared with the 7-beam FI plan, the FV plan achieves dosimetric improvements for the proximal bronchus and the normal left lung. Mean dose Dmean was reduced by 1.9 Gy for the normal left lung, while D2 was reduced by 6.0 Gy for the proximal bronchus and by 2.0 Gy for the normal left lung. The R50 values are 2.98 for the FV plan, 4.12 for the 7-beam FI plan, and 3.25 for the 13-beam FI plan. This substantial improvement in dose compactness for the FV plan can be visually appreciated in figure 9(a). The dosimetric quality of the FV plan is similar to that of the 13-beam FI plan, while using only half as many beams per fraction. As an additional point of reference, a clinical coplanar IMRT plan made using Eclipse is shown in the fourth row of figure 9(a).
Figure 9.
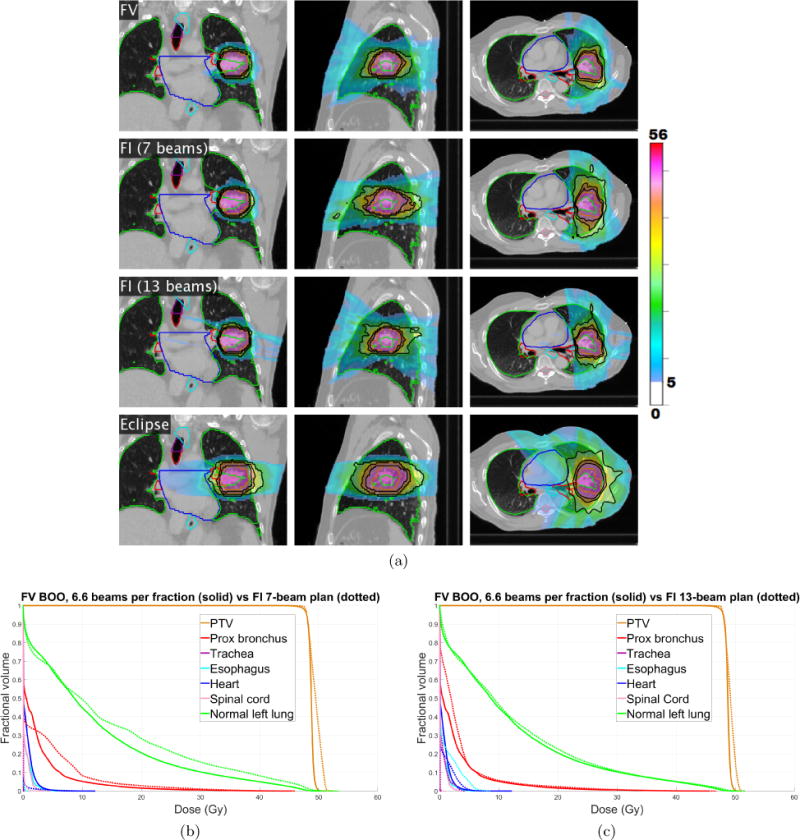
(a) The cumulative dose distribution (summed over all five fractions) for the FV plan using average of 6.6 beams per fraction (first row) as well as a 7-beam FI plan (second row) and a 13-beam FI plan (third row). A coplanar IMRT plan made using Eclipse is shown in the fourth row. Isodose lines for 50%, 80%, and 95% of the prescription dose are shown in black. Dose below 5 Gy is not shown. (b)–(c) Dose-volume histograms for lung case “LNG”, comparing FV plan that uses 6.6 beams per fraction (solid) with FI plans (dotted) using (b) 7 beams, and (c) 13 beams.
Table 5.
Dmean, D2 and Dmax (in units of Gy) for all OARs for both the FV and 7-beam FI cumulative dose distributions. FV BOO results are shown in black and FI results are in blue.
| Prox. bronchus | Trachea | Esophagus | Heart | Spinal cord | Normal left lung | |
|---|---|---|---|---|---|---|
| Dmean | 2.5 [3.2] | .02 [0.0] | 0.4 [.03] | 0.6 [0.1] | 0.3 [0.1] | 12.2 [14.1] |
| D2 | 18.1 [24.1] | 0.1 [.01] | 3.0 [0.3] | 3.3 [0.9] | 2.2 [0.7] | 45.8 [47.7] |
| Dmax | 45.4 [46.1] | 0.2 [.01] | 5.9 [0.9] | 12.1 [11.5] | 3.3 [4.6] | 50.4 [53.1] |
3.4 Head and neck case
Figure 1(d) shows the dose distributions for a selection of five of the 30 treatment fractions for the FV head and neck plan. Despite the variation in dose distributions, the PTV is covered uniformly at each fraction. Each voxel in the PTV receives a dose of approximately 66/30 = 2.2 Gy per fraction. Dose-volume histograms for these five selected fractions are shown in figure 10. The FV BOO algorithm selected only 6.36 beams per fraction, on average. As in all cases, the algorithm did not select the same set of beam angles for any two fractions. A total of 81 distinct beam firing positions were utilized, as illustrated in figure 11.
Figure 10.
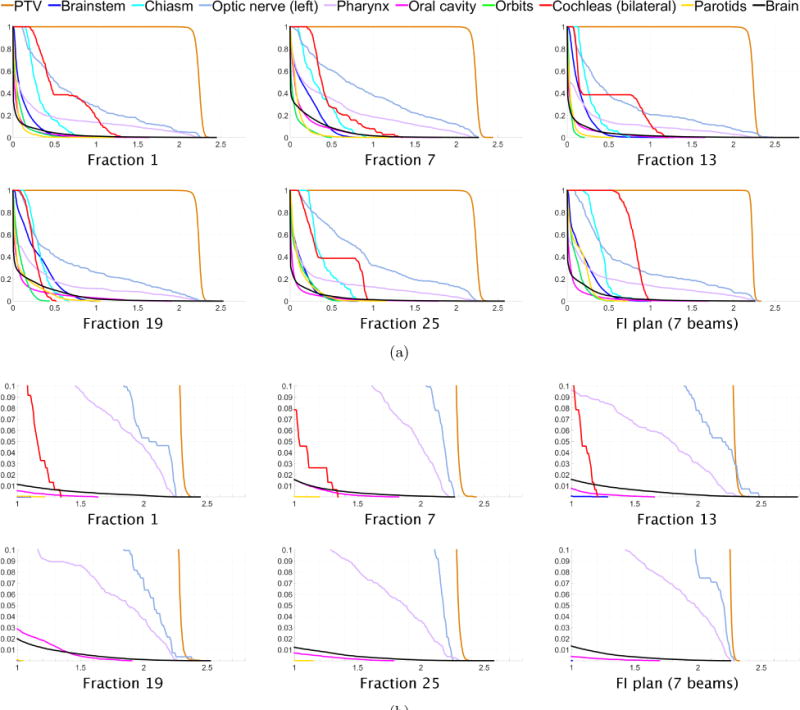
(a) Dose-volume histograms for five of the 30 treatment fractions for head and neck case “H&N”. The DVH for one fraction of the 7-beam FI plan is shown in the lower right. (b) Close-up views of the high dose range for the DVHs in (a).
Figure 11.
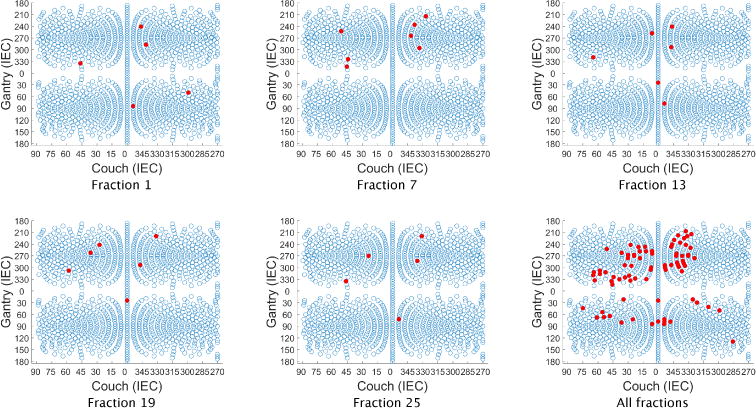
Beam angles selected for five of the 30 treatment fractions for head and neck case “H&N”. Although only 6.36 beams were selected per fraction (on average), a total of 81 distinct beam firing positions were utilized.
Figure 12(a) shows the cumulative dose distribution, summed over all 30 fractions, for the FV plan (first row) as well as a 7-beam FI plan (second row) and a 13-beam FI plan (third row). Corresponding dose-volume histograms are shown in figure 12(b)–(c). The Dmean, D2, and Dmax values for all OARs are reported for the FV plan and the 7-beam FI plan in table 6. Compared with the 7-beam FI plan, the FV plan achieves dosimetric improvements for the cochleas (bilateral), chiasm, brainstem, parotids, and orbits. Mean dose Dmean was reduced by 10.2 Gy (cochleas), 3.4 Gy (chiasm), 1.2 Gy (brainstem), and 1.0 Gy (orbits). D2 was reduced by 10.0 Gy (cochleas), 6.7 Gy (orbits), 5.7 Gy (brainstem), 4.7 Gy (parotids), 1.6 Gy (brain), and 1.4 Gy (pharynx). The dosimetric quality of the FV plan is comparable to that of the 13-beam FI plan. As an additional point of reference, a clinical VMAT plan made using Eclipse with two full coplanar arcs is shown in the fourth row of figure 12(a).
Figure 12.
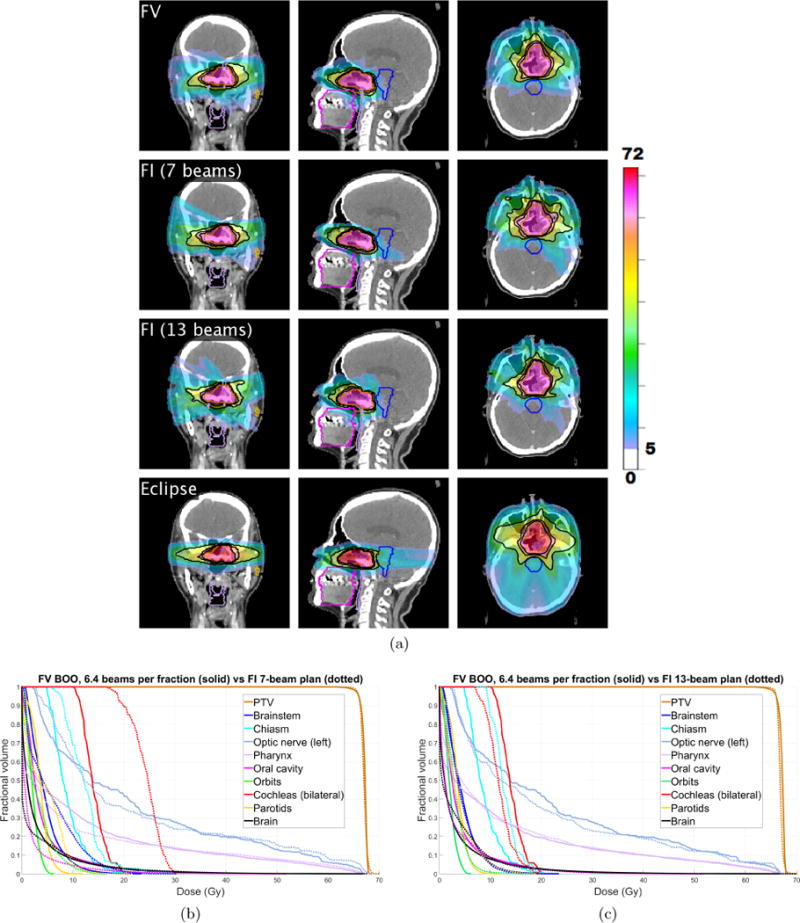
(a) The cumulative dose distribution (summed over all 30 fractions) for the FV plan using average of 6.36 beams per fraction (first row) as well as a 7-beam FI plan (second row) and a 13-beam FI plan (third row). A VMAT plan made using Eclipse is shown in the fourth row. Isodose lines for 50%, 80%, and 95% of the prescription dose are shown in black. Dose below 5 Gy is not shown. (b)–(c) Dose-volume histograms for head and neck case “H&N”, comparing FV plan that uses 6.36 beams per fraction (solid) with FI plans (dotted) using (b) 7 beams, and (c) 13 beams.
Table 6.
Dmean, D2 and Dmax (in units of Gy) for all OARs for both the FV and FI cumulative dose distributions. FV BOO results are shown in black and values for the 7-beam FI plan are in blue.
| Brainstem | Chiasm | Optic nerve (L) | Pharynx | |
|---|---|---|---|---|
| Dmean | 4.6 [5.8] | 8.9 [12.3] | 21.7 [21.9] | 11.5 [10.7] |
| D2 | 13.2 [19.0] | 17.1 [23.2] | 66.5 [67.1] | 63.8 [65.2] |
| Dmax | 23.3 [30.0] | 20.1 [29.7] | 66.9 [68.5] | 67.3 [67.9] |
| Oral cavity | Orbits | Cochleas | Parotids | Brain | |
|---|---|---|---|---|---|
| Dmean | 4.2 [1.9] | 2.2 [3.2] | 14.2 [24.4] | 3.7 [4.4] | 3.2 [2.7] |
| D2 | 22.6 [16.3] | 4.9 [11.6] | 19.4 [29.4] | 7.5 [12.2] | 22.7 [24.3] |
| Dmax | 51.7 [51.0] | 6.1 [16.7] | 20.1 [29.9] | 11.6 [21.7] | 66.6 [67.7] |
The tradeoff between minimizing cumulative OAR dose and limiting the per fraction dose can be observed in figure 10(b), where it can be seen that for the FV plan the maximum dose to the left optic nerve in fraction 13 is 2.5 Gy, compared to the per fraction prescription dose of 66/30 = 2.2 Gy. The 7-beam FI plan limits dose to the left optic nerve to 2.28 Gy per fraction. This tradeoff can also be seen in the fact that for the FV plan the brain receives a maximum dose of 2.8 Gy in fraction 13, whereas the 7-beam FI plan limits the maximum dose to the brain to 2.25 Gy per fraction. Meanwhile, as seen in table 6, the maximum cumulative dose to the left optic nerve and to the brain are slightly reduced for the FV plan.
3.5 PTV coverage and OAR dose reduction metrics
Tables 7 and 8 show treatment plan quality metrics for the cases listed in table 1. For each case, metrics are reported for the FV plan as well as for the corresponding FI plan that uses approximately the same number of beams per fraction as the FV plan. (So for case “PHM” the FV plan is compared against the 6-beam FI plan, for cases “LNG” and “H&N” the FV plan is compared against the 7-beam FI plan, and for case “PRT” the FV plan is compared against the 10-beam FI plan.) The FV plans show improvement in PTV D2 in all cases, as well as improvements in PTV homogeneity (defined as D95/D5) for cases “PHM”, “PRT” and “LNG”. There is a slight decrease in PTV D98 and D99.
Table 7.
PTV coverage metrics for several cases. FV BOO results are shown in black, FI plan results in blue. The homogeneity index HI is defined as D95/D5.
| Case | D95 (Gy) | D98 (Gy) | D99 (Gy) | D2 (Gy) | HI |
|---|---|---|---|---|---|
| PHM | 40.0 [40.0] | 39.4 [39.7] | 38.9 [39.4] | 42.5 [43.8] | .95 [.92] |
| PRT | 40.0 [40.0] | 39.8 [39.9] | 39.6 [39.8] | 40.9 [42.6] | .98 [.95] |
| LNG | 48.0 [48.0] | 47.6 [47.8] | 47.1 [47.7] | 49.6 [51.23] | .97 [.94] |
| H&N | 66.0 [66.0] | 65.3 [65.6] | 64.5 [65.2] | 67.9 [68.3] | .97 [.97] |
Table 8.
OAR dose differences for several cases. For each case, the difference in mean dose is computed for all OARs. The min, max, and average differences in mean dose are listed in columns 2 and 3. Likewise, the min, max, and average values of are listed in columns 4 and 5.
|
|
|
|||||
|---|---|---|---|---|---|---|
|
| ||||||
| Case | average (Gy) | range (Gy) | average (Gy) | range (Gy) | ||
| PRT | −3.0 | [−5.7, .24] | −1.8 | [−6.0, .49] | ||
| LNG | −.27 | [−1.9, .47] | −.25 | [−6.1, 2.7] | ||
| H&N | −1.5 | [−10.2, 2.3] | −3.4 | [−10.0, 6.2] | ||
For a given OAR, let and denote the mean doses delivered to the OAR by the FV plan and FI plans, respectively. Let and denote the maximum doses delivered to at least 2% the OAR by the respective plans. For each case, we computed the difference in mean dose (that is, ) and the difference in D2 value (that is, ) for each OAR. The results are summarized in table 8. (The digital phantom is omitted from table 8 because there is only one OAR aside from the body and skin structures. See section 3.1.)
4 Discussion
By allowing beam angles to vary between fractions, FV BOO exploits degrees of freedom in IMRT which have traditionally been underutilized. As demonstrated by the results in section III, FV plans are able to improve the cumulative dose distribution without increasing the number of beams per fraction, or alternatively to reduce the number of beams per fraction without compromising dosimetry. The FV BOO strategy addresses a main criticism of non-coplanar IMRT treatment plans, which is the long delivery time due to the large number of static beams required to sufficiently sample the vast non-coplanar beam angle space. FV BOO offers the potential to reduce this delivery time by using fewer beams per fraction, while still utilizing a large total number of non-coplanar beam angles. An excellent example is provided by the improvement in dose compactness observed in case “LNG” in section 3. It was shown in (Dong et al. 2013b) that for lung SBRT cases non-coplanar IMRT yields a substantial improvement in dose compactness as measured by R50, but to achieve this improvement it was necessary to utilize well more than 10 non-coplanar beam angles. In the lung SBRT case “LNG” studied here, the FV approach was able to achieve superior dose compactness while using half as many beams per fraction as the FI plan. Therefore, the FV planning method removes a major roadblock to implementing 4π non-coplanar radiotherapy.
A key detail in our approach, as well as in the field rotation approach taken in (Dink et al. 2012), is that the PTV is covered homogeneously in each fraction. In contrast, the spatiotemporally non-uniform fractionation schemes studied in (Unkelbach, Zeng, and Engelsman 2013; Unkelbach 2015; Unkelbach and Papp 2015) target subregions of the PTV at each fraction. While that is an effective strategy for BED-based optimization, questions remain about the robustness of the resulting plans against setup error, and further work is needed to validate the biological effect of the heterogeneous PTV doses on tumor growth. Thus, the FV BOO approach which maintains a uniform tumor dose coverage is potentially more clinically translatable. FV BOO bears a conceptual similarity to SFUD planning, which serves as a demonstration that radiotherapy with large temporal variation in normal tissue doses but uniform PTV coverage has already been practiced safely in a clinical setting. However, the ability of FV BOO to optimize all candidate beams together clearly distinguishes the two methods.
This work is only an initial step towards fraction-variant beam orientation optimization, and there is likely room for improvement in both the problem formulation and the optimization algorithm. For example, if the per fraction dose to certain OARs poses a concern, the objective function can be modified to enforce fraction-wise OAR control as follows:
| (4) |
The parameters αi and βi can be adjusted to explore the tradeoff between minimizing cumulative OAR dose and controlling the per fraction dose.
The FV BOO framework we have presented is unable to enforce dose-volume constraints in the beam angle selection step. However, this is currently a limitation of all beam orientation optimization algorithms based on group sparsity (Jia et al. 2011; Liu, Dong, and Xing 2017). It is likely that standard approaches to handling dose-volume constraints such as (Morrill et al. 1991; Romeijn et al. 2003; Chu et al. 2005; Fu et al. 2017) can be incorporated into the multi-fraction fluence map optimization step (3) which follows the beam angle selection step, as this FMO step is a much smaller, convex problem and is similar to classical FMO formulations.
An additional area for improvement is the optimization runtime, which in our experiments is about 60–90 minutes for non-coplanar five fraction plans and about 7 hours for non-coplanar 30 fraction plans (with 500–700 candidate beams per fraction). The computational expense for each FISTA iteration is dominated by matrix-vector multiplications involving the large sparse matrices Ai and . These matrix-vector multiplications could be made much faster with a GPU implementation. Besides improving the implementation, it may be possible to improve the algorithm as well. While we have found FISTA to be effective for this application, other algorithms should be investigated, such as truncated interior point methods (Kim et al. 2007; Koh, Kim, and Boyd 2007; Portugal et al. 2000), or recently developed proximal quasi-Newton methods (Becker and Fadili 2012; Scheinberg and Tang 2016; Lee, Sun, and Saunders 2014). New algorithmic innovations such as performing column clustering on the dose-calculation matrix to reduce the problem size, as suggested in (Ungun, Xing, and Boyd 2017), will likely be beneficial. Note that we have found that if the OAR weights αi and βi are tuned for the case where there is only one treatment fraction, then the same weights tend to yield a good selection of beams for the full fraction-variant problem with F fractions. This is very helpful because in our experiments it only takes about 5–8 minutes to solve problem (2) when F = 1. Also, based on this observation, advances in automated parameter tuning for the fraction-invariant case will be directly applicable to the fraction-variant case.
One potential burden of fraction-variant BOO is increased patient-specific IMRT quality assurance (QA) load. It would be time-consuming to QA all individual fractions. Measurement of individual beams may be feasible but could lead to difficulty in analyzing the results because of the non-uniform target dose resulting from a single beam. However, this is unlikely to be an insurmountable difficulty as machine log file analysis in combination with independent dose calculation has shown accuracy equivalent to measurement-based QA (Sun et al. 2012). In comparison, the potential of substantially accelerating 4π treatment using many FI beams is limited. Although the individual beam time may be reduced by using the higher dose rate FFF mode, the dose rate is unlikely to be the bottleneck compared with the limited MLC mechanical speed. The couch and gantry motion can be combined to reduce the travel time. However, there is a caveat that not all combined motion trajectories are feasible or safe. This needs to be carefully planned based on a CAD model of the machine and the patient surface as outlined in (Yu et al. 2015) and the detailed trajectory has to be input into the machine control console for delivery, a function currently unavailable in the clinical mode. The total travel time will ultimately be limited by the relatively slow couch and gantry speeds for safety reasons, making the FV approach using fewer beams per fraction a compelling alternative for 4π therapy.
5 Conclusions
This work demonstrates a beam orientation optimization algorithm that simultaneously optimizes beam angles for all IMRT treatment fractions. The resulting fraction-variant plans offer improved dosimetry of the cumulative dose without increasing the beam budget (that is, the number of beams per fraction that are utilized). Alternatively, fraction-variant plans allow the beam budget to be reduced without compromising dosimetry.
Acknowledgments
This research was funded by NIH grants R43CA183390, R44CA183399, R01CA188300, and Department of Energy grants DE-SC0017057 and DE-SC0017687.
A Optimization algorithm
We solve the optimization problem (2) using the Fast Iterative Shrinkage-Thresholding Algorithm (FISTA) (Beck and Teboulle 2009; Scheinberg, Goldfarb, and Bai 2014). FISTA solves optimization problems of the form
| (5) |
where the convex function g is assumed to be differentiable (with a Lipschitz continuous gradient) and the function h is assumed to “simple” in the sense that its proximal operator can be evaluated efficiently. The proximal operator (also known as “prox-operator”) of h, with parameter t > 0, is defined by
| (6) |
Problem (2) has the form (5), where
and
| (7) |
The function h enforces the constraint x ≥ 0 by returning the value ∞ when this constraint is not satisfied.
The FISTA with line search algorithm is recorded in algorithm 1. The key steps in each iteration of FISTA are to evaluate the gradient of g and the proximal operator of h. To compute the gradient of g, we first note three facts that can be shown using basic calculus:
If , then ∇G(y) = y.
If , then ∇G(y) = y+ = max(y, 0) (with maximum taken componentwise).
If G is the Huber penalty function (defined in equation (1)), then , where P[−μ,μ](y) is the projection of the vector y onto the set . (The inequalities are interpreted componentwise.) Projecting onto this set is a simple componentwise “clipping” operation.
Algorithm 1.
FISTA with line search
| Initialize x0 and t0 > 0, set v0 := x0, select 0 < r < 1, s > 1 |
| for k = 1, 2, … do |
| t := s tk−1 |
| repeat |
| break if |
| t := rt |
| tk := t |
| θk := θ |
| xk := x |
| end for |
It now follows from the chain rule that
| (8) |
To state a formula for the prox-operator of h, in the special case that p = 1/2, we first express h as , where
(Recall that the vector xf,b is the fluence map for beam b on treatment day f, and x is the concatenation of the vectors xf,b.) The vector proxth(x) has the same size and block structure as x, and the separable sum rule for prox-operators (Parikh and Boyd 2013) informs us that the (f, b)th block of proxth(x) is given by
| (9) |
We show in appendix B that
| (10) |
Here denotes the prox-operator of the function with parameter twb. An explicit formula for this prox-operator in the special case that p = 1/2 is given in appendix B. Using formulas (8), (9), and (10) to compute the gradient of g and the prox-operator of h, it is now straightforward to solve problem (2) using the FISTA with line search algorithm 1.
B Prox-operator calculation
Here we derive a formula for the prox-operator of the function h : ℝn → ℝ ∪ {∞} defined by
in the special case where p = 1/2. (The inequality x ≥ 0 is interpreted componentwise.) Let t > 0. To evaluate , we must find the minimizer for the optimization problem
| (11) |
First note that if then there is no benefit from taking the component xi to be positive. If xi were positive, then both terms in the objective function could be reduced just by setting xi = 0.
It remains only to select values for the other components of x. This is a smaller optimization problem, with one unknown for each positive component of . The negative components of are irrelevant to the solution of this reduced problem. Thus, we would still arrive at the same final answer if the negative components of were set equal to 0 at the very beginning.
In other words, problem (11) is equivalent to the problem
which in turn is equivalent to the problem
(because there would be no benefit from taking any components of x to be negative). This shows that
| (12) |
Formula (12) is valid for any p > 0. The reason we take p = 1/2 is that a short and explicit (but non-obvious) formula for the prox-operator of the function is available (Möllenhoff et al. 2015). To evaluate proxtψ(y), first let . (If y = 0 then α = ∞.) then
| (13) |
C The choice of group sparsity exponent p
Here we explain why the choice p = 1 for the exponent in the group sparsity penalty function is forbidden. Suppose we take p = 1, so that problem (2) is convex, and let x* be a minimizer for (2). The blocks of x* are denoted . We can obtain another minimizer for problem (2) by permuting the blocks of x*. In other words, the vector defined by
is optimal for (2) for any permutation σ of {1, 2, …, F}. In fact, if SF is the set of all permutations of {1,…, F}, then any convex combination of vectors (with σ ∈ SF) is optimal as well:
is optimal for problem (2) whenever and θσ ≥ 0 for all σ ∈ SF. An optimization algorithm that finds a global minimizer for problem (2) (with p = 1) will almost surely find one of the solutions xθ with θσ > 0 for all σ ∈ SF, and such a solution has the same set of active beams for each fraction. Thus, FV BOO requires the use of a non-convex group sparsity penalty term. We choose p = 1/2 specifically because the proximal operator of the function can be evaluated easily using formula (13) in appendix B.
D Selecting the weights wb in the group sparsity term
In this section we explain our method for choosing the weights wb that appear in the group sparsity term in problem (2). Some beams must only travel a short distance through the body to reach the PTV, whereas other “long path” beams must travel a greater distance through the body before reaching the PTV. To overcome attenuation, a “long path” beam must be fired more intensely than a short path beam in order to deliver the same dose to the PTV. If all the weights wb in the group sparsity term are chosen to be equal, then the group sparsity penalty introduces a bias in favor of short path beams, because a long path beam b requires ‖xb‖2 to be large in order to target the PTV effectively. We choose the weights wb to compensate for this bias.
Let nb be the number of beamlets in beam b with a trajectory that intersects the PTV. Suppose that beam b is fired uniformly, so that , and the scalar λ is chosen so that the mean dose delivered to the PTV by beam b is 1 Gy. Then it is easy to check that , where is the dose-calculation matrix from beam b to the PTV. This quantity is larger for long path beams than for short path beams. Therefore, to level the playing field, we choose the weights wb so that
| (14) |
The scalar c is chosen to be the same for all beams, and c is tuned by trial and error to achieve the desired group sparsity level.
Footnotes
Disclosure of conflicts of interest
The authors have no relevant conflicts of interest to disclose.
References
- Beck A, Teboulle M. A fast iterative shrinkage-thresholding algorithm for linear inverse problems. SIAM Journal on Imaging Sciences. 2009;2(1):183–202. [Google Scholar]
- Becker S, Fadili J. A quasi-Newton proximal splitting method. Advances in Neural Information Processing Systems. 2012:2618–2626. [Google Scholar]
- Chu M, et al. Robust optimization for intensity modulated radiation therapy treatment planning under uncertainty. Physics in Medicine and Biology. 2005;50(23):5463. doi: 10.1088/0031-9155/50/23/003. [DOI] [PubMed] [Google Scholar]
- Dink D, et al. Intensity modulated radiation therapy with field rotation — a time-varying fractionation study. Health Care Management Science. 2012;15(2):138–154. doi: 10.1007/s10729-012-9190-2. [DOI] [PubMed] [Google Scholar]
- Dong P, et al. 4π non-coplanar liver SBRT: A novel delivery technique. International Journal of Radiation Oncology* Biology* Physics. 2013a;85(5):1360–1366. doi: 10.1016/j.ijrobp.2012.09.028. [DOI] [PubMed] [Google Scholar]
- Dong P, et al. 4π non-coplanar stereotactic body radiation therapy for centrally located or larger lung tumors. International Journal of Radiation Oncology* Biology* Physics. 2013b;86(3):407–413. doi: 10.1016/j.ijrobp.2013.02.002. [DOI] [PubMed] [Google Scholar]
- Dong P, et al. Feasibility of prostate robotic radiation therapy on conventional C-arm linacs. Practical Radiation Oncology. 2014a;4(4):254–260. doi: 10.1016/j.prro.2013.10.009. [DOI] [PubMed] [Google Scholar]
- Dong P, et al. Feasibility of using intermediate x-ray energies for highly conformal extracranial radiotherapy. Medical Physics. 2014b;41(4) doi: 10.1118/1.4868464. [DOI] [PubMed] [Google Scholar]
- Fu A, et al. A Convex Optimization Approach to Radiation Treatment Planning with Dose Constraints. 2017 doi: 10.1007/s11081-018-9409-2. [DOI] [PMC free article] [PubMed] [Google Scholar]
- Harding R, et al. Benchmarking of a treatment planning system for spot scanning proton therapy: Comparison and analysis of robustness to setup errors of photon IMRT and proton SFUD treatment plans of base of skull meningioma. Medical Physics. 2014;41(11) doi: 10.1118/1.4897571. [DOI] [PubMed] [Google Scholar]
- Jia X, et al. Beam orientation optimization for intensity modulated radiation therapy using adaptive ℓ2,1-minimization. Physics in Medicine and Biology. 2011;56(19) doi: 10.1088/0031-9155/56/19/004. [DOI] [PubMed] [Google Scholar]
- Kim H, et al. Dose optimization with first-order total-variation minimization for dense angularly sampled and sparse intensity modulated radiation therapy (DASSIM-RT) Medical Physics. 2012;39(7):4316–4327. doi: 10.1118/1.4729717. [DOI] [PMC free article] [PubMed] [Google Scholar]
- Kim M, Ghate A, Phillips M. A stochastic control formalism for dynamic biologically conformal radiation therapy. European Journal of Operational Research. 2012;219(3):541–556. [Google Scholar]
- Kim M, Ghate A, Phillips MH. A Markov decision process approach to temporal modulation of dose fractions in radiation therapy planning. Physics in Medicine and Biology. 2009;54(14):4455. doi: 10.1088/0031-9155/54/14/007. [DOI] [PubMed] [Google Scholar]
- Kim M, Phillips MH. A feasibility study of dynamic adaptive radiotherapy for nonsmall cell lung cancer. Medical Physics. 2016;43(5):2153–2161. doi: 10.1118/1.4945023. [DOI] [PubMed] [Google Scholar]
- Kim M, Stewart R, Phillips MH. A feasibility study: Selection of a personalized radiotherapy fractionation schedule using spatiotemporal optimization. Medical Physics. 2015;42(11):6671–6678. doi: 10.1118/1.4934369. [DOI] [PubMed] [Google Scholar]
- Kim S, et al. An interior-point method for large-scale ℓ1-regularized least squares. IEEE Journal of Selected Topics in Signal Processing. 2007;1(4):606–617. [Google Scholar]
- Kirk M, et al. Comparison of prostate proton treatment planning technique, interfraction robustness, and analysis of single-field treatment feasibility. Practical Radiation Oncology. 2015;5(2):99–105. doi: 10.1016/j.prro.2014.05.008. [DOI] [PubMed] [Google Scholar]
- Koh K, Kim S, Boyd S. An interior-point method for large-scale ℓ1-regularized logistic regression. Journal of Machine Learning Research. 2007 Jul;8:1519–1555. [Google Scholar]
- Lee J, Sun Y, Saunders M. Proximal Newton-type methods for minimizing composite functions. SIAM Journal on Optimization. 2014;24(3):1420–1443. [Google Scholar]
- Liu H, Dong P, Xing L. A new sparse optimization scheme for simultaneous beam angle and fluence map optimization in radiotherapy planning. Physics in Medicine and Biology. 2017;62:6428. doi: 10.1088/1361-6560/aa75c0. [DOI] [PubMed] [Google Scholar]
- Lomax A. Intensity modulation methods for proton radiotherapy. Physics in Medicine and Biology. 1999;44(1):185. doi: 10.1088/0031-9155/44/1/014. [DOI] [PubMed] [Google Scholar]
- Möllenhoff T, et al. Low rank priors for color image regularization. International Workshop on Energy Minimization Methods in Computer Vision and Pattern Recognition Springer. 2015:126–140. [Google Scholar]
- Morrill S, et al. Dose-volume considerations with linear programming optimization. Medical Physics. 1991;18(6):1201–1210. doi: 10.1118/1.596592. [DOI] [PubMed] [Google Scholar]
- Neylon J, et al. A nonvoxel-based dose convolution/superposition algorithm optimized for scalable GPU architectures. Medical Physics. 2014;41(10) doi: 10.1118/1.4895822. [DOI] [PubMed] [Google Scholar]
- Nguyen D, et al. Feasibility of extreme dose escalation for glioblastoma multiforme using 4π radiotherapy. Radiation Oncology. 2014a;9(1) doi: 10.1186/s13014-014-0239-x. [DOI] [PMC free article] [PubMed] [Google Scholar]
- Nguyen D, et al. Integral dose investigation of non-coplanar treatment beam geometries in radiotherapy. Medical Physics. 2014b;41(1) doi: 10.1118/1.4845055. [DOI] [PubMed] [Google Scholar]
- Nguyen D, et al. Dose domain regularization of MLC leaf patterns for highly complex IMRT plans. Medical Physics. 2015;42(4) doi: 10.1118/1.4915286. [DOI] [PubMed] [Google Scholar]
- O’Connor D, et al. 4π Non-Coplanar IMRT Beam Angle Selection by Convex Optimization with Group Sparsity Penalty. Medical Physics. 2016;43(6):3895–3895. [Google Scholar]
- Parikh N, Boyd S. Proximal algorithms. Foundations and Trends in Optimization. 2013;1(3):123–231. [Google Scholar]
- Portugal L, et al. A truncated primal-infeasible dual-feasible network interior point method. Networks. 2000;35(2):91–108. [Google Scholar]
- Ramakrishnan J, et al. A dynamic programming approach to adaptive fractionation. Physics in Medicine and Biology. 2012;57(5):1203. doi: 10.1088/0031-9155/55/5/1203. [DOI] [PubMed] [Google Scholar]
- Romeijn H, et al. A novel linear programming approach to fluence map optimization for intensity modulated radiation therapy treatment planning. Physics in Medicine and Biology. 2003;48(21) doi: 10.1088/0031-9155/48/21/005. [DOI] [PubMed] [Google Scholar]
- Rwigema JM, et al. 4π noncoplanar stereotactic body radiation therapy for head-and-neck cancer: Potential to improve tumor control and late toxicity. International Journal of Radiation Oncology* Biology* Physics. 2015;91(2):401–409. doi: 10.1016/j.ijrobp.2014.09.043. [DOI] [PubMed] [Google Scholar]
- Saberian F, Ghate A, Kim M. Spatiotemporally optimal fractionation in radiotherapy. INFORMS Journal on Computing. 2017;29(3):422–437. [Google Scholar]
- Scheinberg K, Goldfarb D, Bai X. Fast first-order methods for composite convex optimization with backtracking. Foundations of Computational Mathematics. 2014;14(3):389–417. [Google Scholar]
- Scheinberg K, Tang X. Practical inexact proximal quasi-Newton method with global complexity analysis. Mathematical Programming. 2016;160(1–2):495–529. [Google Scholar]
- Stuschke M, et al. Potentials of robust intensity modulated scanning proton plans for locally advanced lung cancer in comparison to intensity modulated photon plans. Radiotherapy and Oncology. 2012;104(1):45–51. doi: 10.1016/j.radonc.2012.03.017. [DOI] [PubMed] [Google Scholar]
- Sun B, et al. Evaluation of the efficiency and effectiveness of independent dose calculation followed by machine log file analysis against conventional measurement based IMRT QA. Journal of Applied Clinical Medical Physics. 2012;13(5):140–154. doi: 10.1120/jacmp.v13i5.3837. [DOI] [PMC free article] [PubMed] [Google Scholar]
- Ungun B, Xing L, Boyd S. Real-time radiation treatment planning with optimality guarantees via cluster and bound methods 2017 [Google Scholar]
- Unkelbach J. Non-uniform spatiotemporal fractionation schemes in photon radiotherapy; World Congress on Medical Physics and Biomedical Engineering; June 7–12, 2015; Toronto, Canada: Springer; 2015. pp. 401–404. [Google Scholar]
- Unkelbach J, Papp D. The emergence of nonuniform spatiotemporal fractionation schemes within the standard BED model. Medical Physics. 2015;42(5):2234–2241. doi: 10.1118/1.4916684. [DOI] [PubMed] [Google Scholar]
- Unkelbach J, Zeng C, Engelsman M. Simultaneous optimization of dose distributions and fractionation schemes in particle radiotherapy. Medical Physics. 2013;40(9) doi: 10.1118/1.4816658. [DOI] [PMC free article] [PubMed] [Google Scholar]
- Woods K, et al. Viability of non-coplanar VMAT for liver SBRT as compared to coplanar VMAT and beam orientation optimized 4π IMRT. Advances in Radiation Oncology. 2016 doi: 10.1016/j.adro.2015.12.004. [DOI] [PMC free article] [PubMed] [Google Scholar]
- Yu V, et al. The development and verification of a highly accurate collision prediction model for automated noncoplanar plan delivery. Medical Physics. 2015;42(11):6457–6467. doi: 10.1118/1.4932631. [DOI] [PMC free article] [PubMed] [Google Scholar]
- Zhu L, et al. Using total-variation regularization for intensity modulated radiation therapy inverse planning with field-specific numbers of segments. Physics in Medicine and Biology. 2008;53(23) doi: 10.1088/0031-9155/53/23/002. [DOI] [PubMed] [Google Scholar]
- Zhu X, et al. Patient-specific quality assurance for prostate cancer patients receiving spot scanning proton therapy using single-field uniform dose. International Journal of Radiation Oncology* Biology* Physics. 2011;81(2):552–559. doi: 10.1016/j.ijrobp.2010.11.071. [DOI] [PubMed] [Google Scholar]


