

Abstract
Estrogen receptor α (ERα) action plays an important role in pancreatic β-cell function and survival; thus, it is considered a potential therapeutic target for the treatment of type 2 diabetes in women. However, the mechanisms underlying the protective effects of ERα remain unclear. Because ERα regulates mitochondrial metabolism in other cell types, we hypothesized that ERα may act to preserve insulin secretion and promote β-cell survival by regulating mitochondrial-endoplasmic reticulum (EndoRetic) function. We tested this hypothesis using pancreatic islet-specific ERα knockout (PERαKO) mice and Min6 β-cells in culture with Esr1 knockdown (KD). We found that Esr1-KD promoted reactive oxygen species production that associated with reduced fission/fusion dynamics and impaired mitophagy. Electron microscopy showed mitochondrial enlargement and a pro-fusion phenotype. Mitochondrial cristae and endoplasmic reticulum were dilated in Esr1-KD compared with ERα replete Min6 β-cells. Increased expression of Oma1 and Chop was paralleled by increased oxygen consumption and apoptosis susceptibility in ERα-KD cells. In contrast, ERα overexpression and ligand activation reduced both Chop and Oma1 expression, likely by ERα binding to consensus estrogen-response element sites in the Oma1 and Chop promoters. Together, our findings suggest that ERα promotes β-cell survival and insulin secretion through maintenance of mitochondrial fission/fusion-mitophagy dynamics and EndoRetic function, in part by Oma1 and Chop repression.
Keywords: apoptosis, endoplasmic reticulum stress (ER stress), estrogen receptor, insulin secretion, mitochondrial metabolism, estrogen action, mitochondrial dynamics
Introduction
Type 2 diabetes manifests in humans when the pancreatic β-cells can no longer compensate to provide sufficient insulin to overcome peripheral insulin resistance. This pancreatic decompensation phase is typically associated with a marked decline in β-cell mass and insulin secretory capacity (1). It is hypothesized that a variety of factors, genetic and environmental, contribute to cellular toxicity, organelle dysfunction, and β-cell apoptosis (2). Thus, novel approaches or strategies to preserve β-cell function and mass are critical for the prevention of diabetes. Considering that there is a reduced prevalence of diabetes in premenopausal women compared with age-matched men (3, 4) and that female versus male ZDF rats are protected against β-cell failure (5) suggests that harnessing the protective effects of estradiol/ERα4 may prove efficacious in the treatment or prevention of type 2 diabetes in women. Moreover, because pancreata biopsies from healthy female subjects showed a significant increase in β-cell number compared with males (6), there is additional evidence of a sex-specific effect enhancing β-cell viability that might serve to improve islet transplantation outcomes for type 1 diabetic subjects.
Through the use of mouse genetics and the development of a pancreatic islet-specific estrogen receptor α knockout (PERαKO) mouse model, researchers have highlighted the mechanistic importance of ERα in islets/β-cells as a regulator of insulin synthesis (7) and protector of β-cell health even during extreme tissue stress (8, 9). Although the protective actions of estrogens/ERα in pancreatic β-cells are well documented, the mechanistic underpinnings remain incompletely understood.
Considering the high secretory burden of the islet, efficient protein synthesis and folding are critical for β-cell function and health. The EndoRetic is an organelle in which secretory proteins are folded to their native conformations; however, when the organelle becomes overwhelmed by unfolded or misfolded proteins, a classical stress response is triggered (10, 11). Endoplasmic reticulum stress activates the unfolded protein response (UPR) signaling network that can, depending upon the severity and duration of stress, initiate cytochrome c release from the mitochondria to trigger β-cell apoptosis. There is a strong collaborative requirement between mitochondria and the endoplasmic reticulum especially in β-cells where proteostasis imposes a high energy demand on the cell. Thus, we hypothesize that chronic mitochondrial-EndoRetic stress as a consequence of impaired ERα action may contribute to apoptosis susceptibility and diminished insulin secretory capacity that underlies glucose intolerance and type 2 diabetes conversion as pathology progresses.
Herein, we show that pancreatic islet expression of ERα promotes β-cell survival by maintaining mitochondrial health while suppressing EndoRetic stress. ERα-deficient Min6 β-cells showed imbalanced mitochondrial fission/fusion-mitophagy dynamics, increased expression of the mitochondrial stress gene Oma1, and excessive production of reactive oxygen species (ROS). We hypothesize that these alterations in mitochondrial function exacerbated EndoRetic stress, including the induction of Chop expression, and this was a primary factor promoting β-cell apoptosis.
Collectively, our findings support the notion that ERα preserves islet β-cell mass and protects against oxidative and EndoRetic stress through Oma1 and Chop repression. These data highlight the important actions of ERα in β-cells and support a potential therapeutic role for ERα in combating the onset of type 2 diabetes in women.
Results
ERα knockout impairs glucose-stimulated insulin secretion and promotes inflammation
Previous studies by Mauvais-Jarvis and co-workers (8) have shown that islets from PERαKO mice are more susceptible to lipid- and streptozotocin-induced damage. Herein, we sought to identify ERα-regulated pathways central in the control of β-cell health. First we confirmed that Esr1 (the gene that encodes ERα) knockdown (KD) reduced glucose-stimulated insulin secretion in Min6 β-cells (Fig. 1, A and B). Consistent with previous findings by Mauvais-Jarvis and co-workers (8) in pancreatic samples obtained from f/f and PERαKO mice (9), we observed no difference in total insulin content between the genotypes of Min6 β-cells (Fig. 1C). Thus, the reduction in glucose-stimulated insulin secretion appears mediated by defects in secretory function and not total insulin content per se. Indeed, the reduction in insulin secretion was associated with a marked increase in inflammation as reflected by elevated expression of IL6, IL1β, and monocyte chemoattractant (Mcp) 1 (Fig. 1D), consistent with previous findings showing defective glucose-stimulated insulin secretion from β-cells under stress (8, 9).
Figure 1.

ERα deletion reduces glucose-stimulated insulin secretion and promotes inflammation. A, lentivirus-mediated introduction of shRNA against Esr1, reduced ERα protein levels in Min6 β-cells versus scramble (Scr) control. B, Min6 β-cells were treated with increasing concentrations of glucose (2–20 mm), and insulin secretion into the media was assessed by ELISA (performed in triplicate). C, total insulin content was not different between the genotypes (n = 3/genotype in triplicate). D, Esr1-KD promotes inflammation in Min6 β-cells as reflected by a 2–4-fold induction of IL6, IL1β, and MCP1 gene expression (n = 6/genotype). E and F, islet-specific deletion of ERα in female mice confirmed a reduction in expression of ERα and known ERα target genes. G and H, reduced expression and protein abundance of key autophagy-related signaling factors (n = 5–6/genotype). Values are mean ± S.E., and significant differences between Esr1-KD and control (Scr) as well as PERαKO and control f/f were detected by Student's t test and one-way ANOVA where appropriate, significance = *, p < 0.05. AU, arbitrary units.
Because mitochondria and the endoplasmic reticulum are important in regulating ATP production, cellular redox, pH, Ca2+ signaling, and cell death (12), maintenance of a healthy mitochondrial network is essential for cellular function. Thus, macroautophagy and more specifically mitophagy (the elimination of damaged or dysfunctional mitochondria) are elemental processes critical for maintaining an optimal mitochondrial reticulum and important for apoptosis prevention. Considering that we have previously shown impaired autophagy signaling in ERα-deficient muscle cells and because autophagy is induced by cellular stress and impaired by elevated lipids, we studied the impact of ERα on the mitochondrial-EndoRetic–autophagy axis in mice and cells.
Following confirmation of ERα protein reduction in islets from PERαKO mice (Fig. 1E), we observed that ERα knockout significantly altered mRNA levels of several known ERα targets (Fig. 1F) as well as autophagy genes, including Atg3, -5, and -7 and Beclin-1 in islets harvested from female PERαKO mice (Fig. 1G). Reduced Atg5 and Beclin-1 protein levels were confirmed by immunoblotting of isolated PERαKO islets (Fig. 1H). Thus, our findings suggest that ERα expression is critical for β-cell macroautophagy by controlling autophagy-related gene expression (i.e. Atg3, -5, -7 and Beclin-1). We pursued these relationships further in Min6 β-cells.
ERα knockdown impairs autophagic flux in Min6 β-cells
To investigate the mechanisms by which ERα regulates autophagy in pancreatic β-cells, we performed Esr1 knockdown (KD) in Min6 β-cells. Shaw and co-workers and Guan and co-workers (13–15) have consistently shown that AMPK is an important cellular energy sensor that regulates both mitochondrial dynamics and macroautophagy. Because it was previously shown that AMPK activity can be driven by estrogen action, we hypothesized that AMPK signaling may be diminished in Esr1-KD cells. Indeed, total AMPKα protein was significantly diminished as was Thr-172 phosphorylation status and AMPKα catalytic subunit mRNA (Prkaa2) in ERα-deficient Min6 β-cells (Fig. 2, A–C). No change was observed in the expression level of Prkaa1, the gene encoding the AMPK α1 catalytic subunit. To confirm the regulation of Prkaa2 expression by ERα, we treated Min6 β-cells with an ERα agonist for 12 and 24 h (Fig. 2D). ERα activation by 4,4′,4″-(4-propyl-[1H]-pyrazole-1,3,5-triyl) trisphenol (PPT; 10 nm) led to a 2–3-fold increase in Prkaa2 expression, and this finding is consistent with observations in other cell types showing a role for ERα in the activation of AMPK (16, 17). In ERα-deficient Min6 β-cells, decreased AMPKα signaling was associated with a reduction in the phosphorylation of Ulk1 Ser-467 (upstream activator of macroautophagy) (Fig. 2, A, E and F).
Figure 2.

Esr1-KD impairs AMPK signaling and autophagy in Min6 β-cells. A, immunoblots. B–F, densitometric analysis of phosphorylated (Thr-172) and total AMPK and phosphorylated (Ser-467) and total ULK1 from control (Scr) and Esr1-KD β-cells (n = 6–9/genotype). C and D, qPCR analysis of AMPK expression, Prkaa1 and Prkaa2, and Pkraa2 mRNA at 0, 12, and 24 h post-treatment with 10 nm PPT (n = 3/condition in triplicate). G and H, immunoblots and densitometric analysis as well as qPCR of select autophagy-related proteins/genes (n = 3/genotype in triplicate). I–K, immunoblots and densitometry of p62 and LC3B I and II as well as mRNA levels in Min6 β-cells with Esr1-KD and in PERαKO islets. L, flow cytometry analyses of dually-labeled RFP-GFP LC3B expressed in control (Scr) and Esr1-KD β-cells. Bars depicting quantification of dual signals represent autophagosome abundance (closed bars); RFP signal represents autolysosome abundance (dotted bars); and cells showing loss of signal represent autophagosome turnover (gray bars). In some cases, immunoblots from different panels were derived from the same membrane of a specific experiment, and protein levels were normalized to either tubulin or β-actin. Values are mean ± S.E., and significant differences between genotypes were detected by Student's t test, significance = *, p < 0.05. AU, arbitrary units.
Similar to our findings for expression of autophagy proteins and transcripts in islets from PERαKO mice, autophagy-related proteins, including Atg3, -5, -7 as well as Beclin-1 total protein, were reduced in ERα knockdown Min6 β-cells (Fig. 2G). In contrast to PERαKO islets, however, mRNA expression levels of Atg3 and -5 were unchanged, whereas expression of Atg7 and -12 was elevated in Esr1-KD versus control (Scr) Min6 β-cells (Fig. 2H). Thus, the differential expression of transcript and protein observed in Esr1-KD cells suggests an alteration in protein translation or turnover.
The processing of LC3B, including conversion of LC3BI to II (LC3B cleavage and lipidation), is often used as a surrogate marker of autophagic flux. Our findings show a significant reduction in both LC3B I and II protein levels as well as abundance of p62 (a polyubiquitin binding protein responsible for recruiting LC3 to autophagosomes) (Fig. 2I). Reduced LC3B and p62 protein levels were likely explained by a reduction in transcription and not accelerated protein turnover, as gene expression levels for both Sqstm1 and Map1lc3b were reduced in Esr1-KD cells versus control (Scr) (Fig. 2J). A similar but more robust reduction in Map1lc3b expression was observed in islets from PERαKO mice compared with ERα replete WT animals (Fig. 2K) suggesting that the impairment in autophagy signaling was conserved between β-cells in culture and islets in mice.
To confirm the impairment in autophagic flux in Esr1-KD Min6 β-cells, we transfected cells with tandem RFP–GFP-labeled LC3B. Because GFP fluorescence is quenched in the acidic pH of the lysosome, the GFP-LC3B signal reflects autophagosomes prior to lysosomal degradation. Because RFP is pH-resistant and continues to fluoresce, the RFP-LC3B signal can be used to quantify both autophagosomes and autolysosomes (18, 19). The apparent reduction in red fluorescence punctae observed in ERα-deficient versus control (Scr) Min6 β-cells is fully consistent with reduced autophagosome turnover, i.e. autophagic flux (Fig. 2L). Collectively, these data indicate that inactivation of ERα suppresses autophagic signaling and autophagosome turnover in part by reduced abundance of autophagy-related proteins and impaired AMPK signaling.
ERα regulates mitochondrial morphology and fission/fusion dynamics in Min6 β-cells
The process of selective mitochondrial degradation is dependent on critical signaling shifts in fission/fusion dynamics and Park family member targeting of damaged or unwanted mitochondria to autophagic turnover by the lysosome (20). Mitochondrial fission proteins, Drp1 (dynamin-related protein) and mitochondrial fission factor (Mff), as well as mitochondrial fusion proteins mitofusin (Mfn)1 and Mfn2, were markedly reduced in ERα-deficient Min6 β-cells (Fig. 3A). OPA1 (optic atrophy type 1) protein was more highly cleaved in Esr1-KD cells, and this is a likely consequence of increased Oma1 (overlapping activity with m-AAA protease) gene and protein expression (Fig. 3, B and C). No difference in the expression of the OPA1-associated protease presenilin-associated rhomboid-like protein, Parl, was detected between the groups (Fig. 3, B and C). Interestingly, although we observed no difference in the mRNA expression of the inner mitochondrial membrane metalloprotease Yme1L1 between Scr versus KD, protein levels of YME1L1 were 50% of control in ERα-deficient cells. Because OPA1 is coordinately controlled by the actions of YME1L1 versus OMA1, our findings are consistent with an increased influence of OMA1 on OPA, and a loss of YME1L1 action to yield mitochondrially-controlled apoptotic resistance, cristae morphogenesis, and cell proliferation as described previously (21–23).
Figure 3.

ERα regulates mitochondrial fission/fusion-mitophagy signaling in β-cells. A, immunoblots of select mitochondrial fission and fusion proteins from control (Scr) and Esr1-KD Min6 β-cells (immunoblots presented in A were obtained from the same experiment as immunoblots presented in Fig. 2G; thus, the β-actin immunoblots were duplicated between the panels). B, Parl, Oma1, and Yme1L1 gene expression. C, immunoblots and densitometry quantifying protein abundance in control (Scr) and Esr1-KD Min6 β-cells (n = 6–9/genotype). D, transmission electron microscopy analysis of mitochondria in control (Scr) and Esr1-KD Min6 β-cells (magnification ×2500). E and F, ImageJ analysis of mitochondrial area, perimeter, number, and size frequency in control (Scr) and Esr1-KD Min6 β-cells (four slides/genotype). G, immunoblots of mitophagy-associated proteins in control (Scr) and Esr1-KD Min6 β-cells (n = 6–9/genotype). H, qPCR analyses of mRNA expression of Pink1 (Park6), Parkin (Park2), and DJ1 (Park7) in control (Scr) and Esr1-KD Min6 cells (n = 6–9/genotype in duplicate). I, immunoblots of Parkin in cytosolic and mitochondrial subcellular fractions from control (Scr) and Esr1-KD Min6 cells. J, mtDNA copy number normalized to nuclear DNA (n = 3/genotype in triplicate); K, genes associated with mitochondrial biogenesis (Pgc1a and Tfam) were elevated in Esr1-KD versus control (Scr) Min6 β-cells. Values are mean ± S.E., and mean differences between the groups were detected by Student's t test and ANOVA where appropriate, *, p < 0.05. AU, arbitrary units.
Considering these robust differences in mitochondrial dynamics signaling between the genotypes, we explored the morphology of mitochondria using transmission electron microscopy. Micrographs of Min6 β-cells showed that ERα deletion promoted an enlarged, elongated, and fused mitochondrial phenotype (Fig. 3, D–F). Morphological quantification indicated a significant increase in the individual mitochondrion area and perimeter in Esr1-KD Min6 β-cells, but without alteration in overall mitochondrial number (Fig. 3, D–F). Of note, mitochondrial cristae were organized into longitudinal ribbons stretching in a head-to-tail configuration in Esr1-KD β-cells. This observation is in contrast to control (Scr) showing the characteristically compact mitochondrial cristae folding (Fig. 3D).
In parallel with this elongated mitochondrial phenotype, we found a reduced abundance of basal Pink1 and Parkin protein in ERα-deficient Min6 β-cells (Fig. 3G). Although we observed no change in Park2 (Parkin) gene expression, Park6 (Pink1) was up-regulated 4-fold (Fig. 3H). Parkin-mediated ubiquitination of outer mitochondrial membrane substrates amplifies Pink1 phosphorylation of ubiquitin to promote mitophagy (24). Consistent with a reduction in Parkin protein levels in whole-cell lysates, we found a reduction in the mitochondrial localization of Parkin protein in ERα-deficient Min6 β-cells (Fig. 3I). Of interest, we detected a small (∼8%) yet significant increase in mitochondrial DNA (mtDNA) copy number (Fig. 3J) that was paralleled by increased expression of mitochondrial biogenesis markers Pgc1a and Tfam (Fig. 3K) in ERα-deficient Min6 β-cells versus control (Scr). Considering the observation of mitochondrial elongation/hyperfusion and the reduction in mitophagy markers in Esr1-KD cells (we previously observed similar findings in ERα-deficient muscle cells (25)), we hypothesize that loss of ERα contributes to a reduction in mitochondrial turnover. We speculate that in the absence of ERα, the cell maintains mtDNA content at the expense of mitochondrial health because mitochondrial health surveillance signaling through Pink1 and Parkin is markedly suppressed. Thus, these data show that ERα is critical in the regulation of β-cell mitochondrial dynamics and mitophagy signaling.
ERα deficiency alters mitochondrial bioenergetics in Min6 β-cells
Mitochondria are highly dynamic organelles that constantly undergo fission/fusion cycling to retain a healthy mitochondrial network allowing for the maintenance of oxidative metabolism. In light of the mitochondrial dysmorphology and reduction of fission/fusion dynamics signaling that we observed in ERα-deficient β-cells, we hypothesized that mitochondrial respiration may also be altered in the absence of ERα. Indeed, we found that cellular oxygen consumption and proton leak were modestly yet significantly elevated in ERα-deficient Min6 β-cells (Fig. 4, A and B). Despite an elevated oxygen consumption rate for Esr1-KD cells, the % ATP-associated respiration, and thus the relative rate of ATP synthesis, was identical between the genotypes (Fig. 4C). Impaired mitochondrial homeostasis is often accompanied by a mitochondrial stress response. Indeed, the increased proton leak was paralleled by elevated levels of H2O2 and O2− (Fig. 4, D and E) in Min6 β-cells lacking ERα. Treatment of Min6 β-cells with the mitochondrial membrane depolarizing agent carbonyl cyanide 3-chlorophenylhydrazone (CCCP) exacerbated the increase in H2O2 production in the context of ERα-deficiency (Fig. 4, D and E). Despite the increase in proton leak in Esr1-KD, we observed no difference in expression of Ucp2 or Ucp3 between the genotypes (Fig. 4F). We have shown previously that scavenging of ROS is impaired in ERα-deficient muscle (25), and indeed we find a similarly reduced expression and failed ERα ligand (PPT)-stimulated induction of Gpx3 in Esr1-KD Min6 β-cells (Fig. 4G). Collectively, in the absence of ERα, there is an increase in cellular respiration and ROS production that is associated with aberrant mitochondrial cristae morphology and imbalanced OPA1 regulation by YME1L1 and OMA1. The increased oxygen consumption by ERα-deficient β-cells is likely an attempt to maintain ATP production.
Figure 4.

ERα deficiency elevates proton leak and ROS production in Min6 β-cells. A–C, real-time respirometry analyses (XF24 Seahorse Biosciences) show increased oxygen consumption rate and proton leak in Esr1-KD versus control (Scr) Min6 β-cells (n = 5/genotype) but matched ATP-linked respiration between the genotypes. D and E, flow cytometry analysis of H2O2 and O2− production shows increased basal and CCCP-induced ROS production in Esr1-KD versus control (Scr) Min6 β-cells (n = 3/genotype in triplicate). F, qPCR analysis of uncoupling protein mRNA expression levels from control (Scr) and Esr1-KD Min6 β-cells. G, expression of ERα target gene and ROS scavenging gene Gpx3 detected by qPCR in control (Scr) and Esr1-KD Min6 β-cells treated with vehicle or with ERα-selective agonist PPT (10 nm) (n = 3/condition in triplicate). Values are mean ± S.E. *, p < 0.05, significantly different from control (Scr) cells; #, p < 0.05 within genotype, between treatment difference (basal versus CCCP; vehicle versus PPT). AU, arbitrary units.
ERα knockdown increases EndoRetic stress and apoptosis in Min6 β-cells
Endoplasmic reticulum (EndoRetic) stress is often accompanied by oxidative stress especially in endocrine cell types responsible for high rates of protein synthesis (26, 27). Excessive ROS production could both directly and indirectly impact EndoRetic homeostasis and protein folding thus contributing to increased susceptibility for cellular apoptosis. Electron micrograph images show a marked dilation of EndoRetic lumen in ERα-deficient Min6 β-cells (Fig. 5A), a classic morphological feature of the UPR. These images led us to examine EndoRetic stress signaling in the context of ERα deficiency. Phosphorylation of PKR-like ER kinase (PERK) and eukaryotic eIF2αSer-51 were markedly elevated in Esr1-KD cells indicating a strong response to reduce translation and protein synthesis (Fig. 5B). Indeed, mRNA expression and protein levels of C/EBP homologous protein (CHOP), a master regulator of EndoRetic stress and apoptosis, were markedly elevated in Esr1-KD cells (Fig. 5, B and C). Of interest, Gadd34 expression was elevated while Atf4 expression was markedly reduced in Esr1-KD cells. Similarly, we observed a marked up-regulation of Chop and Gadd34 expression in islets from female PERαKO mice versus control f/f (Fig. 5D). The differential regulation of Atf4 and Gadd34 may reflect an inadequate compensatory attempt to down-regulate EndoRetic stress by counteracting CHOP action (Fig. 5, C and D). The reduction in Atf4, a transcription factor known to induce Chop expression, suggests that Chop up-regulation is achieved independent of Atf4, and thus a plausible explanation could be by direct derepression of Chop by ERα. No change in upstream stress signaling of p-XBP1 and XBP1 protein levels was observed, despite an ∼80% reduction in spliced XBP1 expression in Esr1-KD versus control (Scr) Min6 β-cells (Fig. 5, B and C).
Figure 5.

ERα knockdown increases endoplasmic reticulum stress and apoptosis in Min6 β-cells. A, electron micrographs showing dilated endoplasmic reticulum in Esr1-KD (right panels; indicated by arrowheads) versus control (Scr) (left panels) Min6 β-cells. Magnification: ×1500 (upper panels) and ×25,000 (lower panels). B, immunoblot analysis of EndoRetic stress markers in control (Scr) and Esr1-KD Min6 β-cells (n = 6/group). C, qPCR analysis of gene expression in control (Scr) and Esr1-KD Min6 β-cells (n = 6/group). D, ERα deletion in PERαKO islets led to increased Chop and Gadd34 expression compared with islets from control f/f (n = 3–4 mice/genotype in triplicate). E, immunoblot of cleaved caspase-3 in control (Scr) and Esr1-KD β-cells with corresponding densitometry (n = 6/group). F and G, fluorescence microscopy analyses of control (Scr) and Esr1-KD Min6 β-cells with nuclei stained blue (DAPI) and apoptotic cells stained red; F, positive and negative control; G, control (Scr) and Esr1-KD. H, apoptosis, assessed by flow cytometry for FITC-BrdU in control (Scr) and Esr1-KD Min6 β-cells and expressed as a percentage of apoptotic cells (n = 3/group in duplicate). In specific instances, immunoblots from different panels were derived from the same membrane of a specific experiment, and protein levels were normalized to either GAPDH or β-actin. Values are mean ± S.E., *, p < 0.05, significant difference from control (Scr) cells or versus control f/f. AU, arbitrary units.
Our finding of increased CHOP expression is internally consistent with the increase in cleaved caspase levels in ERα-deficient Min6 β-cells (Fig. 5E). To confirm the increase in cellular apoptosis, we performed TUNEL staining in control (Scr) and Esr1-KD Min6 β-cells (Fig. 5, F and G). Fluorescence microscopy images indicate an increased number of TUNEL-positive stained cells in ERα-deficient Min6 β-cells (Fig. 5, F and G). Flow cytometry analysis showed nearly a 3-fold increase in the percentage of apoptotic cells in ERα-deficient Min6 β-cells (Fig. 5H). These findings combined with increased cleaved caspase-3 levels are indicative of increased apoptosis susceptibility in ERα-deficient Min6 β-cells. Moreover, because Atf4 is also thought to be involved in stress-induced autophagy gene expression, our findings of a reduction in Atf4 are consistent with findings in Figs. 1 and 2 showing impaired autophagic signaling.
We next determined whether elevated ROS, comparable with levels observed in Esr1-KD cells, alone could induce a similar degree of EndoRetic stress in “control” Min6 β-cells. EndoRetic stress signaling was quantified after exposure to exogenous H2O2, an insult shown to cause β-cell injury in the context of diabetes. In Min6 β-cells, H2O2 treatment increased CHOP and cleaved caspase-3 levels (Fig. 6, A and B). These data prompted us to interrogate whether ERα activation protects β-cells against oxidative stress-induced Chop induction and caspase activation.
Figure 6.
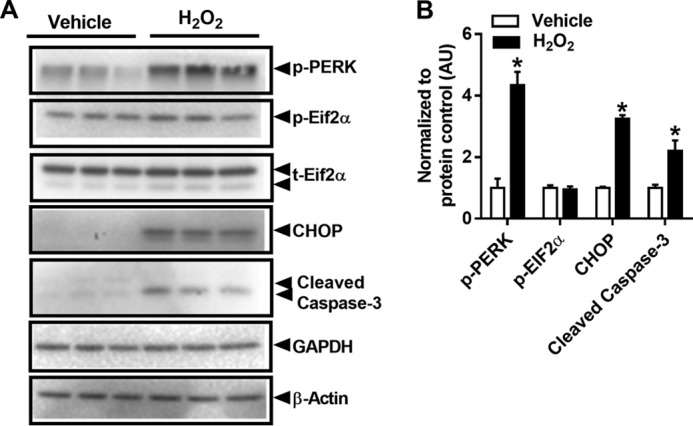
H2O2 treatment increases endoplasmic reticulum stress markers and subsequent apoptosis in Min6 β-cells. A, Western blot analysis of EndoRetic stress markers and cleaved caspase-3 in the presence or absence of H2O2 (100 μm) for 24 h (n = 3/treatment in duplicate). B, values are mean ± S.E., *, p < 0.05, significant difference from vehicle. AU, arbitrary units.
ERα protects against oxidative stress-induced CHOP induction in Min6 β-cells
Because our findings indicate that inactivation of ERα triggers ROS-induced EndoRetic stress and subsequent β-cell apoptosis, we next hypothesized that ERα overexpression could exert a protective role in Min6 β-cells. Moderate overexpression of ERα via plasmid transfection led to increased levels of total AMPKα protein, enhanced LC3B processing, and reduced CHOP protein expression (Fig. 7A). Moreover, we found an ERα dose-dependent reduction in Chop expression in adenovirus-transduced Min6 β-cells (Fig. 7B). Next, we treated GFP or HA-tagged ERα-transfected cells with H2O2 and observed that ERα blunted the induction of CHOP protein (Fig. 7C). Moreover, to determine whether pharmacological activation of ERα exerts a protective effect against oxidative stress, Min6 β-cells were treated with H2O2 and the ERα-specific agonist PPT alone or with the ERα antagonist ICI 182,780 (FulvestrantTM). As hypothesized, PPT treatment suppressed the H2O2-induced increase in CHOP protein, although in contrast, ICI 182,780 blunted the PPT reduction in CHOP protein (Fig. 7D). In addition to blocking H2O2-induced EndoRetic stress, ERα activation by PPT also reversed thapsigargin (Tg)-induced EndoRetic stress phosphorylation of eIF2α and diminished CHOP protein expression (Fig. 7, E–G). Our findings suggest a strong role of ERα action to protect against stimuli that promote EndoRetic stress (i.e. H2O2 and Tg).
Figure 7.

Overexpression of ERα induces AMPK activation, autophagic signaling, and CHOP suppression. A, overexpression of HA-tagged ERα in Min6 β-cells increases AMPK protein and LC3B processing while reducing p62 and CHOP protein levels (n = 3/group in triplicate). B, ERα overexpression (ERα virus administration tested at four doses: 5, 10, 20, and 50 μl) promotes a dose-dependent reduction in CHOP protein (performed in triplicate). C, ERα overexpression (50 μl of virus administered) protects against H2O2-induced increase in CHOP protein (performed in triplicate; H2O2 100 μm, PPT 100 nm, ICI 1 μm for 24 h). D, ERα-specific agonist PPT blunts H2O2-induced increase in CHOP protein, and this effect is blunted by the ERα antagonist ICI (performed in triplicate). E–G, PPT reduces Tg-induced phosphorylation of eIF2α and CHOP protein expression in Min6 β-cells (n = 3/condition in triplicate; Tg 500 nm for 18 h; and PPT 100 nm for 18 h). Values are mean ± S.E., *, p < 0.05, significant difference from control (Scr) cells or vehicle-treated cells; #, p < 0.5, significant difference from thapsigargin-treated cells. AU, arbitrary units.
ERα represses Chop and Oma1 expression
Considering that ERα is a transcription factor shown to induce or repress target gene expression in a cell-specific context, and because Min6 β-cells treated with PPT (10 nm, 6–24 h) show a robust reduction in Chop and Oma1 expression (Fig. 8, A and B), we next interrogated whether Oma1 and Chop (Ddit3) gene expression is directly regulated by ERα. We performed chromatin immunoprecipitation studies to show that ERα robustly binds the Oma1 and Chop promoters in Min6 β-cells (Fig. 8C). Indeed, we found that compared with vehicle treatment, E2 induced ERα binding to an ERE consensus sequence within the Chop promoter (Fig. 8C) and possibly two ERE sites within the Oma1 promoter. Thus, our data suggest that under basal conditions, ERα likely represses Oma1 and Chop expression by direct binding to an estrogen-response element within the respective promoter regions. In the context of Esr1-KD, we hypothesize that the deletion of ERα removes the molecular brake from the promoter thus inducing Oma1 and Chop gene expression by a de-repression mechanism. In addition to the direct action of ERα, we also asked the question as to whether mitochondrial stress induced by Oma1 de-repression could cause activation of CHOP via mitochondrial-EndoRetic cross-talk. To answer this question, we performed gain- and loss-of-Oma1-function studies in Min6 β-cells using adenovirus and siRNA, respectively. We found that overexpression of HA-tagged OMA1 promoted PERK and eIF2α phosphorylation and increased CHOP protein markedly (Fig. 8, D and E). Conversely, Oma1 knockdown reduced CHOP protein and cleaved caspase-3 even under basal conditions (Fig. 8, F and G). Our data strongly suggest that reduced ERα expression promotes the up-regulation of Oma1 and Chop to induce mitochondrial-endoplasmic reticulum stress and heighten apoptosis susceptibility in β-cells (Fig. 8H).
Figure 8.

ERα activation reduces Chop and Oma1 expression. A and B, ERα-specific activation of wildtype Min6 β-cells by PPT treatment reduced Chop (A) and Oma1 (B) expression versus vehicle control (n = 3 group/time point in duplicate). C, chromatin immunoprecipitation studies show that ERα binds the Chop and Oma1 promoters (performed in triplicate). D and E, overexpression of HA-tagged Oma1 promotes PERK and eIF2α phosphorylation and induces CHOP protein expression in Min6 β-cells (n = 3/condition in triplicate). F and G, confirmation studies using siRNA to achieve Oma1 knockdown confirm proof-of-concept that OMA1 expression is linked with EndoRetic stress signaling and cleaved caspase-3 abundance via CHOP, even in the basal state (n = 3/condition in duplicate). H, schematic showing that ERα promotes cellular stress and apoptosis protection by direct repression of Chop and Oma1 expression. Our findings also support the notion that the derepression of Oma1 could contribute to the induction of CHOP1 and, in part, underlie EndoRetic stress associated with impaired ERα action. AU, arbitrary units.
Discussion
Diabetes and its associated comorbidities are a leading cause of death worldwide with both type 1 and type 2 diabetes characterized by progressive β-cell failure (1, 28). Two randomized trials have shown that estrogen replacement therapy promotes an ∼30% reduction in the incidence of type 2 diabetes in postmenopausal women (29, 30), although the mechanism(s) of protection remain incompletely understood. These clinical observations have fueled mechanistic studies aimed at determining the tissue contribution of estradiol action in the maintenance of β-cell mass and the protection against type 2 diabetes progression (9, 31–36). Taken together with the previous work by Mauvais-Jarvis and co-workers (31, 37–39), our findings shed light on additional ERα-regulated targets controlling β-cell apoptosis susceptibility and insulin secretory capacity.
Herein, we studied the protective mechanisms of ERα in pancreatic β-cells using a pancreatic-specific ERα knockout mouse model and ERα-deficient Min6 β-cells. We found that ERα protects β-cells from apoptosis through regulation of mitochondrial function and morphology, autophagy, and EndoRetic stress.
Previous studies have shown increased liver X receptor (LXR)-stimulated lipogenesis in β-cells lacking ERα. An additional mechanism contributing to increased triacylglycerol accumulation is a reduction in the oxidation of fatty acids by islet mitochondria. Indeed we have previously observed that ERα is critical for mitochondrial oxidative metabolism in skeletal muscle (25). Herein, we show a marginal but significant increase in oxygen consumption rate for ERα-deficient cells. Despite this increase in oxygen consumption rate, % ATP-linked respiration was identical between the genotypes, and this was a likely consequence of increased proton leak and elevated production of reactive oxygen species, including H2O2 and O2− due to alterations in mitochondrial morphology in Esr1-KD β-cells.
Moreover, impaired mitochondrial fission/fusion flux may be an important contributor to the altered bioenergetics of ERα-deficient β-cells. Others have shown that imbalanced mitochondrial fission/fusion dynamics promotes the production of ROS. Indeed, we have shown impaired bioenergetic efficiency, increased ROS production, and impaired fission/fusion dynamics previously in ERα-deficient muscle cells (25).
Because mitochondria are highly dynamic organelles that intermix via rapid fission/fusion processing, an imbalance in this process polarizes the organelle in a static state, and this inflexibility in remodeling is often associated with pathology. Reorganization of the mitochondrial network allows for faster and more efficient removal of specific mitochondrial contents or entire organelles via autophagic turnover or mitophagy (40). Immunoblotting analyses revealed a marked reduction in both mitochondrial fission and fusion signaling, and electron microscopy analysis revealed a markedly elongated mitochondrial architecture accompanied by altered cristae structure in ERα-deficient Min6 β-cells. Although mitochondrial fragmentation has often been described in connection with induction of apoptosis (41, 42), some have observed a hyperfused mitochondrial network in connection with increased apoptosis. Thus, resolution of mitochondrial phenotypes contributing to apoptotic susceptibility requires further investigation.
Considering the increase in OPA1 cleavage, the marked reduction in YME1L1, and the significant increase in OMA1 expression, our data indicate a potential increase in inner membrane fragmentation accompanied by enhanced outer membrane associations (23, 43, 44). The imbalance in OMA1/YME1L1 is thought to increase cellular apoptosis susceptibility. It has recently been shown that OMA1 is activated by Bcl2 family members Bax and Bak to promote inner and outer mitochondrial membrane permeabilization and cytochrome c release; thus, OMA1 is now more recently viewed as a molecular switch to engage apoptotic signaling (45).
Previous studies in rodents demonstrated that autophagy plays an important role in the maintenance of pancreatic β-cell mass by regulating cell survival and proliferation (46–48). We found that expression levels of several autophagy-related genes were markedly decreased in islets in the context of ERα deletion, and indeed reduced expression of Atg5 and Atg7 has been previously associated with β-cell dysfunction (49). Our studies in Min6 β-cells also revealed that ERα deficiency interrupts autophagic signaling potentially in part through the suppression of AMPKα signaling (15, 50, 51).
Although the expression of p62 as a marker of autophagy remains controversial, our findings showed that both mRNA and protein levels of p62 were decreased in ERα-deficient β-cells. We believe that the reduction p62 observed in ERα-deficient Min6 β-cells was due to interrupted p62 mRNA expression and not as a consequence of increased p62 degradation by autophagy. The notion of reduced p62 turnover in the context of ERα deficiency is internally consistent with the reduction in Atg5 and -7, and our expression data were confirmed functionally by flow cytometry analyses showing diminished autophagosome degradation.
Mitophagy is an autophagy-dependent mitochondrial quality control mechanism that eliminates dysfunctional organelles through autophagosomal degradation by the lysosome (20, 52). In parallel with diminished macroautophagy and fission/fusion dynamics, a reduction of mitophagy signaling by Pink1 and Parkin was also observed in ERα-deficient Min6 β-cells (24, 53). We hypothesize that reduced mitochondrial turnover coupled with enhanced biogenesis (driven by Pgc1α and Tfam) led to the increase in mtDNA copy number observed in Esr1-KD β-cells. Thus, similar to our findings in ERα-deficient skeletal muscle, the cell maintains or increases mitochondrial DNA content/mitochondrial number in an attempt to preserve metabolism at the expense of mitochondrial DNA health. The mitochondrial architecture observed in Esr1-KD cells supports this notion since mitochondria elongate and fuse to promote coupling efficiency, to escape mitophagic turnover, and to dilute damaged contents across the network; indeed, all of these actions appear engaged in Esr1-KD cells.
In an attempt to mimic the oxidative stress observed in ERα-deficient β-cells, we treated wildtype ERα-replete cells with H2O2. Exposure to ROS increased CHOP and cleaved caspase-3 expression in ERα-replete Min6 β-cells. In agreement with these findings, ERα-deficient Min6 β-cells that basally produce increased ROS showed a similar increase in CHOP expression. Additionally, PERK phosphorylation was significantly increased 4-fold in H2O2-treated cells, and this was associated with a similar induction of cleaved caspase-3 as seen in Esr1-KD cells (54). Moreover, consistent with elevated CHOP, the EndoRetic lumen was noticeably dilated in ERα-deficient Min6 β-cells, an observation consistent with marked EndoRetic stress. This increase in CHOP and caspase-3 expression was linked with increased cellular apoptosis.
In contrast to our findings in KD cells, overexpression of ERα and pharmacological treatment of Min6 β-cells with PPT inhibited basal expression of Oma1 and Chop and prevented H2O2-induced Chop induction. Furthermore, both the Chop and Oma1 promoters contain multiple consensus ERE sequences, and we detected direct ERα binding at a minimum of one site by chromatin immunoprecipitation analysis. Our findings strongly suggest that ERα protects β-cells against EndoRetic-mitochondrial stress through transcriptional repression of Chop and Oma1.
Importantly, previous studies show that Chop inhibition is sufficient to normalize cleaved caspase-3, restore autophagic flux, reduce β-cell apoptosis, and delay the onset of diabetes in human islet amyloid polypeptide (h-IAPP) transgenic mice (55, 56). These data support our findings that in the context of ERα deficiency, activation of Chop by de-repression alone could be sufficient to drive β-cell apoptosis susceptibility. Similarly, Oma1 inhibition has also been shown to protect neuronal cells against oxidative stress-induced apoptosis, and now our findings appear to extend this paradigm to pancreatic β-cells (57). Moreover, we now provide evidence of a novel cross-talk mechanism by which OMA1 induction promotes EndoRetic stress signaling through PERK-CHOP.
Although previous studies have shown that estradiol protects pancreatic β-cells from oxidative injury and apoptosis, our findings point to a mitochondrial-endoplasmic reticulum nexus and specific ERα regulatory networks (including Oma1 and Chop) involved in estradiol-mediated β-cell protection. Overall, our findings support the notion that ERα may be a target of therapeutic potential in preventing type 2 diabetes in women.
Experimental procedures
Animals
Pancreatic islet-specific ERα knockout mice (PERαKO) were generated using the Cre-loxP system by mating a Pdx1-Cre transgenic line with the floxed ERα line (f/f) obtained as a generous gift from Dr. Kenneth Korach as described previously (7, 9). Animals were bred by the Hevener Laboratory at UCLA, and islet protein and mRNA samples from PERαKO and f/f mice were also provided by Dr. Mauvais-Jarvis such that two independent cohorts of mice were studied to ensure reproducibility of findings. Animals had free access to food (normal chow) and water and were housed using a 12-h light/dark cycle. All procedures were performed in accordance with the Guide for Care and Use of Laboratory Animals of the National Institutes of Health and were approved by the Animal Subjects Committee of UCLA.
Islet harvest
Islets from female mice were isolated as described previously by Mauvais-Jarvis and co-workers (7). Briefly, at 11–12 weeks of age, the common bile duct was cannulated in the anterograde direction, and the pancreas was distended with collagenase (type P, 4 mg in 5 ml; Roche Applied Science, Mannheim, Germany), dissected free, and incubated at 37 °C for 12 min. Washed, hand-picked islets (100–200 per chamber) were perifused (0.4 ml/min) with a 50:50 (v/v) mixture of KRB buffer (pH 7.4) and CMRL 1066 media (Gibco BRL, Paisley, UK) plus 2.8 m glucose at 37 °C, gassing with 95% oxygen/5% carbon dioxide.
Cell culture, reagents, and transfections
Min6 β-cells were maintained in high-glucose DMEM, 15% fetal bovine serum, 10 mm Hepes, 50 μm 2-mercaptoethanol with penicillin/streptomycin. For ligand-specific studies, cells were cultured in phenol red-free DMEM with 15% charcoal-stripped fetal bovine serum, 10 mm Hepes, 50 μm 2-mercaptoethanol with penicillin/streptomycin for 3 days prior to treatment with 10–100 nm PPT (as indicated) and 1 μm ICI 182,780. To mimic the oxidative and EndoRetic stress observed as a consequence of ERα deletion, Min6 β-cells were treated with either H2O2 (100 μm for 24 h) or thapsigargin (500 nm for 18 h; EndoRetic Ca2+ -ATPase non-competitive inhibitor).
Adenoviral constructs containing GFP or ERα were generated using the ViraPower adenoviral expression system (Invitrogen) according to the manufacturer's suggestions. pcDNA 6.2-GFP plasmids were purchased from Invitrogen. pBS-HA-ERα plasmids were a gift from Dr. Peter Tontonoz. pcDNA-HA-Oma1 plasmids were a gift from Alexander M. van der Bliek. Scrambled siRNA (sc-37007) and Oma1 siRNA (sc-151297) were purchased from Santa Cruz Biotechnology. Seeded cells were cultured in 6-well plates for 24 h prior to transfection. Transfections were performed using Lipofectamine 2000 and PLUS reagent according to the manufacturer's instructions (Invitrogen).
Construction of lentiviruses
Mixed scramble shRNA or pLKO.1-Esr1 plasmids (Sigma) with packaging plasmid pCMV-dR8.2 (gift from Dr. Peter Tontonoz, UCLA) and envelope-expressing plasmid pMD2.G (Addgene, catalog no. 12259) were transfected into a 293T packaging cell line by calcium phosphate transfection. After 48 and 72 h of transfection, cell culture medium was collected and filtered through a 0.45-μm filter.
ERα knockdown in Min6 β-cells
To achieve Esr1 knockdown, lentiviral particles (Sigma) carrying shRNA targeted to Esr1 or scramble shRNA were used to transduce Min6 cells.
After selecting positive transformants with puromycin (4 μg/ml) for 4 weeks, the selected clones were expanded and analyzed for KD efficiency by qPCR and immunoblotting. The resulting cultures were then used for subsequent assays.
Insulin secretion and content
Min6 β-cells were seeded in 96-well plates and maintained in culture medium for 3 days. The cells were washed twice by glucose-free KRH buffer (129.4 mm NaCl, 3.7 mm KCl, 2.7 mm CaCl2, 1.3 mm KH2PO4, 1.3 mm MgSO4, 24.8 mm NaHCO3 at pH 7.4) with 0.1% radioimmunoassay grade BSA and cultured for 1 h in KRH buffer with 1 mmol/liter glucose. After washing, cells were incubated with KRH buffer with 0, 2, 5, and 20 mm glucose for 1 h. Cell-free media were collected and diluted 10-fold with KRH buffer prior to assaying for insulin concentration using the ultra-sensitive mouse insulin ELISA kit (catalog no. 90082, Crystal Chem Inc.). To measure total insulin content, Min6 cells were cultured in 6-cm dishes for 3–5 days. The cells were trypsinized and washed twice with PBS and then divided into 2 equal aliquots. One aliquot was extracted with acid/ethanol (0.18 m HCl in 75% ethanol) overnight at −20 °C, followed by centrifugation and supernatant collection. The insulin level in the supernatants was determined as indicated above. The other aliquot was lysed with RIPA buffer, and the protein concentration of the extract was determined as described above. The insulin content was expressed as the amount of insulin (μg) per mg of protein.
Mitochondrial isolation
Mitochondrial isolation was performed using a kit for cultured cells (Thermo Fisher Scientific, Waltham, MA). Briefly, 2 × 10⁷ pelleted cells were vortexed at medium speed for 5 s in Reagent A and incubated on ice for 2 min. Next, cells were vortexed with 10 μl of Reagent B for 5 s and incubated on ice for 5 min with intermittent vortexing at maximum speed every minute. After addition of Reagent C and mixing by inversion, cell homogenates were centrifuged at 700 × g for 10 min at 4 °C. Supernatants were further centrifuged at 12,000 × g for 15 min at 4 °C to separate cytosolic (supernatant) and mitochondrial (pellet) fractions. Washed mitochondrial pellets were lysed by RIPA buffer prior to immunoblotting.
Mitochondrial DNA
Total DNA was extracted from cells using DNeasy blood and tissue kit (Qiagen, Valencia, CA). Expression levels of mtCO3 for mtDNA and 18S for nuclear DNA were assessed by real-time qPCR. The ratio of mtDNA (mtCO3) to nuDNA (18S) was used as an estimate for comparison of mtDNA content between the genotypes.
Immunoblot analyses
Mouse islets and Min6 β-cells were homogenized in RIPA lysis buffer containing complete EDTA-free protease (Roche Applied Science) and phosphatase inhibitor mixture 2 (Sigma). All lysates were centrifuged, clarified, and resolved by SDS-PAGE. Samples were transferred to polyvinylidene difluoride membranes and subsequently probed with the following antibodies for protein and phosphoprotein detection: ERα (Santa Cruz Biotechnology); Mfn1 (Neuromab, Davis, CA); Mfn 2, t-Ulk1 (Sigma); Mff (Abcam); LC3B (Novus, Saint Charles, MO); Fis1 (Genetex); OPA1 (BD Biosciences); Pink1 (Cayman Chemicals); DJ-1 (R&D Systems); p62 (Progen Biotechnik GmbH); pan-actin, Parkin, DRP1, phospho-AMPKα Thr-172, total AMPK, phospho-Ulk1 Ser-555 (catalog no. 5869), Atg3, Atg5, Atg7, Atg12, Phospho-eIF2αSer-51, and total eIF2α (Cell Signaling, Danvers, MA). ERα protein in Min6 β-cells was compared with a whole-cell lysate control sample of ovary to confirm protein molecular weight. The OMA1 antibody was a gift from Alexander M. van der Bliek, and the YME1L1 antibody was a gift from Carla Koehler. In several instances, membranes were sectioned, stripped (Restore Plus, Thermo Fisher Scientific), and re-probed with different primary antibodies so that the maximum amount of data could be obtained from a specific experiment. We have indicated in the figure legends where panel immunoblots from different figures were obtained from the same experiment and thus normalized to the same β-actin loading control. Densitometric analyses were performed using Quantity One image software (Bio-Rad).
Quantitative RT-PCR
Mouse islets and Min6 β-cells were homogenized using TRIzol reagent, and RNA was isolated and further cleaned using RNeasy columns (Qiagen, Valencia, CA) with DNase digestion. Cells were lysed using RLT buffer (Qiagen, Valencia, CA) with 2-mercaptoethanol. For RNA isolation from lysed cells, the RNeasy Plus kit was used as per the manufacturer's instructions. cDNA synthesis was performed using 1 μg of RNA with iSuperscript reverse transcriptase (Bio-Rad). PCRs were prepared using iQ SYBR Green Supermix (Bio-Rad). All PCRs are performed in a MyiQ real-time detection system (Bio-Rad). Quantification of a given gene, expressed as relative mRNA level compared with control, was calculated after normalization to a standard housekeeping gene (Ppia or 18S). Separate control experiments were performed to ensure that the efficiencies of target and reference amplification were equal, as described in User Bulletin 2 from Applied Biosystems. Primer pairs were designed using Primer Express 2.0 software (Applied Biosystems, Waltham, MA) or obtained as previously published sequences. Primer sets were selected spanning at least one exon–exon junction when possible and were confirmed for specificity using BLAST (Basic Local Alignment Search Tool, NCBI) and melting curve analysis to ensure that a single product with its characteristic melting temperature was obtained.
TUNEL assay
Cell proliferation and apoptosis were quantitatively determined using the APC BrdU flow kit (Pharmingen) according to the manufacturer's instructions. Briefly, both scramble and Esr1-KD Min6 β-cells were pulsed with 10 μl/ml of BrdU solution for 1.5 h at 37 °C with 5% CO2. Trypsinized cells were stained with BrdU and 7-aminoactinomycin D (7ADD). Cells were resuspended in FACS buffer (PBS 3% BSA) with DAPI (25 μg/ml) and analyzed immediately by flow cytometry on an LSRII (BD Biosciences) instrument with FlowJo software (Treestar Inc).
In situ cell death detection
Programmed cell death in Min6 β-cells was detected by in situ cell death detection kit (Roche Applied Science). Briefly, air-dried cells were fixed with freshly prepared 4% paraformaldehyde and permeabilized on ice with a solution containing 0.1% Triton X-100 and 0.1% sodium citrate. PBS-washed cells were incubated with Tunel reaction mix (1: 50 mixture of enzyme solution and label solution) at 37 °C for 1 h. Negative control cells were incubated with label solution only. For positive controls, cells were treated with 3 units/ml DNase I in 50 mm Tris and 1 mg/ml BSA buffer before being incubated with the Tunel reaction mix. Cells were mounted with Vectashield mounting medium for fluorescence detection with DAPI (H-1200, Vector). Images were acquired using a Leica LMD 7000 fluorescence microscope.
Reactive oxygen species production
Min6 β-cells were washed and incubated in low-glucose DMEM at 37 °C, 5% CO2 in the dark with either 25 μm 2′,7′-dichlorodihydrofluorescein diacetate (carboxy-H2DCF-DA) (Molecular Probes, Eugene, OR) or 5 μm mitoSOX for 15 min (Molecular Probes, Eugene, OR), with or without 5 μm CCCP for 30 min. Cells were washed with PBS and quickly trypsinized, pelleted, and retained on ice. Samples were resuspended in FACS buffer (PBS 3% BSA) with DAPI (25 μg/ml) and analyzed immediately by flow cytometry on an LSRII (BD Biosciences) with FlowJo software (Treestar Inc). Unstained and single-stained cells were used for establishing compensation and gates, and only live cells were analyzed by the software as described previously (25).
Transmission electron microscopy (TEM)
Min6 β-cells were fixed with freshly prepared, pre-warmed (37 °C) fixative containing 2.5% glutaraldehyde and 2% paraformaldehyde in 0.15 m cacodylate buffer. After fixation, cells were processed for TEM analysis as described previously (58). Ultrathin (∼60 nm) sections were viewed using a JEOL 1200EX II (JEOL, Peabody, MA) electron microscope and photographed using a Gatan digital camera (Gatan, Pleasanton, CA) as described previously. Micrographs were obtained for control (Scr) and Esr1-KD Min6 β-cells.
Mitochondrial respiration
Mitochondrial respiration in cultured Min6 β-cells was measured using an XF24 extracellular flux analyzer (Seahorse Biosciences, North Billerica, MA). Briefly, cells were plated to confluence on a 24-well plate. Measurements of oxygen consumption were made continuously, and cells were sequentially treated with oligomycin (ATP synthase inhibitor), carbonyl cyanide p-trifluoromethoxyphenylhydrazone (an uncoupling agent), and rotenone/myxothiazol (inhibitors of complex I/III of the electron transport chain) (10).
Flow cytometry
To detect autophagy, both control scramble (Scr) and Esr1-KD Min6 β-cells were incubated with RFP-GFP-LC3B (Tandem-LC3B) adenovirus generated using the ViraPower adenoviral expression system (Invitrogen) according to the manufacturer's instructions. Briefly, the coding sequence for Tandem-LC3B with flanking BP sites was amplified from the Addgene plasmid no. 21074 using High Fidelity Pfx50 DNA polymerase (Invitrogen). Entry clones for tandem-LC3B were obtained by recombination of the purified DNA fragment with pDONR221 vector using Gateway BP clonase II. Tandem-LC3B insert was transferred from the entry clones into the pAd/CMV/V5-DEST vector (Invitrogen) using the Gateway LR clonase II enzyme mix. Recombinant adenovirus-purified plasmid was used to generate adenoviral particles according to the manufacturer's instructions (Invitrogen). Adenoviral titer was determined using the AdenoX rapid titer kit (Clontech). Autophagy was induced by nutrient starvation in Hanks'balanced salt solution (Gibco) for 4 or 8 h followed with or without autophagy inhibition by 25 nm bafilomycin A1 (Sigma) for an additional 4 h. Following treatment, cells were washed twice with PBS, fixed in 4% paraformaldehyde for 15 min at room temperature, and resuspended in FACS buffer for analysis using an LSRII (BD Biosciences) cytometer with FlowJo software (Treestar Inc). Untreated cells and cells infected with adenovirus carrying EGFP-LC3B and transfected with mRFP-LC3B plasmid were used for establishing compensation and gates.
Chromatin immunoprecipitation (ChIP)
ChIP experiments were performed as before (59). Briefly, 8 × 10⁷ Min6 β-cells were cultured in phenol red-free and charcoal-treated fetal bovine serum medium for at least 3 days before a 40-min treatment of 10 nm β-estradiol. Antibodies against normal mouse IgG (SC-2025, Santa Cruz Biotechnology) and ERα (SC-8005X, Santa Cruz Biotechnology) were used to pull down cross-linked chromatin in Min6 β-cells. Select primers were designed for detection of the presence of the Chop and Oma1 promoters by qPCR. ChIP primers used are as follows: Oma1-9KB, forward 5′-TCGATTCTTGCATTCTCTGC-3′ and reverse 5′-TGGCAAATGAGTGCTTCTCC-3′; Chop, forward 5′-CCGGGTAGTGTGCAGAGACT-3′ and reverse 5′-TTCGCTCCAGACCTTCATTT-3′.
Statistics
Values presented are expressed as means ± S.E. Statistical analyses were performed using Student's t test when comparing two groups of samples or one-way analysis of variance (ANOVA) with Tukey's post hoc comparison for identification of significance within and between groups using SPSS and GraphPad Prism 5 (GraphPad Software, San Diego). Significance was set a priori at p < 0.05.
Author contributions
The project was conceived by A. L. H. and F. M. J.; Z. Z., A. M. v. d. B., V. R., P. R., B. G. D., T. M. M., A. H. F., B. R. R., K. A. W., S. G., L. V., K. R., S. K. M., N. W. C., M. L., O. S., S. M., and J. P. T. were involved in data collection and data interpretation associated with this project. A. L. H., K. R., P. T., O. S., and F. M. J. were responsible for overseeing the data collection and for the data presented herein. K. S. K. and S. C. H. provided the ERα floxed mouse model to A. L. H. and F. M. J., and K. S. K. participated in the drafting and final editing of this manuscript. All authors were involved in editing the revised manuscript and approved the final draft for journal submission.
Acknowledgments
We are thankful for the technical support in performing islet isolations from mouse pancreata by Jonathan Hoang (UCLA Larry Hillblom Islet Research Center) and β-cell image analysis by the UCSD Electron Microscopy Core.
This work was supported in part by the UCLA Department of Medicine, the UCLA Iris Cantor Women's Health Foundation, UCLA CTSI Grant ULTR000124, the UCLA Claude D. Pepper Older Americans Independence Center, UCSD-UCLA Diabetes Research Center, and National Institutes of Health Grants DK060484, DK109724, and P30DK063491, and NURSA NDSP U24DK097748 (to A. L. H.). The authors declare that they have no conflicts of interest with the contents of this article. The content is solely the responsibility of the authors and does not necessarily represent the official views of the National Institutes of Health.
- ERα
- estrogen receptor α
- EndoRetic
- mitochondrial-endoplasmic reticulum
- PERαKO
- pancreatic islet-specific ERα knockout
- KD
- knockdown
- KO
- knockout
- ERE
- estrogen-response element
- UPR
- unfolded protein response
- ROS
- reactive oxygen species
- AMPK
- AMP-activated protein kinase
- PPT
- 4,4′,4″-(4-propyl-[1H]-pyrazole-1,3,5-triyl) trisphenol
- CCCP
- carbonyl cyanide 3-chlorophenylhydrazone
- PERK
- PKR-like ER kinase
- CHOP
- C/EBP homologous protein
- ANOVA
- analysis of variance
- TUNEL
- terminal deoxynucleotidyltransferase dUTP nick-end labeling
- DMEM
- Dulbecco's modified Eagle's medium
- RFP
- red fluorescent protein
- qPCR
- quantitative PCR
- TEM
- transmission electron microscopy
- Tg
- thapsigargin
- ICI
- ICI 182,780
- DAPI
- 4,6-diamidino-2-phenylindole.
References
- 1. Butler A. E., Janson J., Bonner-Weir S., Ritzel R., Rizza R. A., and Butler P. C. (2003) Beta-cell deficit and increased beta-cell apoptosis in humans with type 2 diabetes. Diabetes 52, 102–110 10.2337/diabetes.52.1.102 [DOI] [PubMed] [Google Scholar]
- 2. Halban P. A., Polonsky K. S., Bowden D. W., Hawkins M. A., Ling C., Mather K. J., Powers A. C., Rhodes C. J., Sussel L., and Weir G. C. (2014) Beta-cell failure in type 2 diabetes: postulated mechanisms and prospects for prevention and treatment. J. Clin. Endocrinol. Metab. 99, 1983–1992 10.1210/jc.2014-1425 [DOI] [PMC free article] [PubMed] [Google Scholar]
- 3. Gale E. A., and Gillespie K. M. (2001) Diabetes and gender. Diabetologia 44, 3–15 10.1007/s001250051573 [DOI] [PubMed] [Google Scholar]
- 4. Wild S., Roglic G., Green A., Sicree R., and King H. (2004) Global prevalence of diabetes: estimates for the year 2000 and projections for 2030. Diabetes Care 27, 1047–1053 10.2337/diacare.27.5.1047 [DOI] [PubMed] [Google Scholar]
- 5. Clark J. B., Palmer C. J., and Shaw W. N. (1983) The diabetic Zucker fatty rat. Proc. Soc. Exp. Biol. Med. 173, 68–75 10.3181/00379727-173-41611 [DOI] [PubMed] [Google Scholar]
- 6. Marchese E., Rodeghier C., Monson R. S., McCracken B., Shi T., Schrock W., Martellotto J., Oberholzer J., and Danielson K. K. (2015) Enumerating beta-cells in whole human islets: sex differences and associations with clinical outcomes after islet transplantation. Diabetes Care 38, e176–e177 10.2337/dc15-0723 [DOI] [PMC free article] [PubMed] [Google Scholar]
- 7. Wong W. P., Tiano J. P., Liu S., Hewitt S. C., Le May C., Dalle S., Katzenellenbogen J. A., Katzenellenbogen B. S., Korach K. S., and Mauvais-Jarvis F. (2010) Extranuclear estrogen receptor-α stimulates NeuroD1 binding to the insulin promoter and favors insulin synthesis. Proc. Natl. Acad. Sci. U.S.A. 107, 13057–13062 10.1073/pnas.0914501107 [DOI] [PMC free article] [PubMed] [Google Scholar]
- 8. Le May C., Chu K., Hu M., Ortega C. S., Simpson E. R., Korach K. S., Tsai M. J., and Mauvais-Jarvis F. (2006) Estrogens protect pancreatic beta-cells from apoptosis and prevent insulin-deficient diabetes mellitus in mice. Proc. Natl. Acad. Sci. U.S.A. 103, 9232–9237 10.1073/pnas.0602956103 [DOI] [PMC free article] [PubMed] [Google Scholar]
- 9. Kilic G., Alvarez-Mercado A. I., Zarrouki B., Opland D., Liew C. W., Alonso L. C., Myers M. G. Jr, Jonas J. C., Poitout V., Kulkarni R. N., and Mauvais-Jarvis F. (2014) The islet estrogen receptor-α is induced by hyperglycemia and protects against oxidative stress-induced insulin-deficient diabetes. PLoS ONE 9, e87941 10.1371/journal.pone.0087941 [DOI] [PMC free article] [PubMed] [Google Scholar]
- 10. Papa F. R. (2012) Endoplasmic reticulum stress, pancreatic beta-cell degeneration, and diabetes. Cold Spring Harb. Perspect. Med. 2, a007666 [DOI] [PMC free article] [PubMed] [Google Scholar]
- 11. Engin F., Nguyen T., Yermalovich A., and Hotamisligil G. S. (2014) Aberrant islet unfolded protein response in type 2 diabetes. Sci. Rep. 4, 4054 [DOI] [PMC free article] [PubMed] [Google Scholar]
- 12. Marchi S., Patergnani S., and Pinton P. (2014) The endoplasmic reticulum-mitochondria connection: one touch, multiple functions. Biochim. Biophys. Acta 1837, 461–469 10.1016/j.bbabio.2013.10.015 [DOI] [PubMed] [Google Scholar]
- 13. Toyama E. Q., Herzig S., Courchet J., Lewis T. L. Jr., Losón O. C., Hellberg K., Young N. P., Chen H., Polleux F., Chan D. C., and Shaw R. J. (2016) Metabolism. AMP-activated protein kinase mediates mitochondrial fission in response to energy stress. Science 351, 275–281 10.1126/science.aab4138 [DOI] [PMC free article] [PubMed] [Google Scholar]
- 14. Kim J., Kundu M., Viollet B., and Guan K. L. (2011) AMPK and mTOR regulate autophagy through direct phosphorylation of Ulk1. Nat. Cell Biol. 13, 132–141 10.1038/ncb2152 [DOI] [PMC free article] [PubMed] [Google Scholar]
- 15. Egan D. F., Shackelford D. B., Mihaylova M. M., Gelino S., Kohnz R. A., Mair W., Vasquez D. S., Joshi A., Gwinn D. M., Taylor R., Asara J. M., Fitzpatrick J., Dillin A., Viollet B., Kundu M., et al. (2011) Phosphorylation of ULK1 (hATG1) by AMP-activated protein kinase connects energy sensing to mitophagy. Science 331, 456–461 10.1126/science.1196371 [DOI] [PMC free article] [PubMed] [Google Scholar]
- 16. Rogers N. H., Witczak C. A., Hirshman M. F., Goodyear L. J., and Greenberg A. S. (2009) Estradiol stimulates Akt, AMP-activated protein kinase (AMPK) and TBC1D1/4, but not glucose uptake in rat soleus. Biochem. Biophys. Res. Commun. 382, 646–650 10.1016/j.bbrc.2009.02.154 [DOI] [PMC free article] [PubMed] [Google Scholar]
- 17. Ribas V., Nguyen M. T., Henstridge D. C., Nguyen A. K., Beaven S. W., Watt M. J., and Hevener A. L. (2010) Impaired oxidative metabolism and inflammation are associated with insulin resistance in ERα-deficient mice. Am. J. Physiol. Endocrinol. Metab. 298, E304–E319 10.1152/ajpendo.00504.2009 [DOI] [PMC free article] [PubMed] [Google Scholar]
- 18. Kimura S., Noda T., and Yoshimori T. (2007) Dissection of the autophagosome maturation process by a novel reporter protein, tandem fluorescent-tagged LC3. Autophagy 3, 452–460 10.4161/auto.4451 [DOI] [PubMed] [Google Scholar]
- 19. Klionsky D. J., Abdalla F. C., Abeliovich H., Abraham R. T., Acevedo-Arozena A., Adeli K., Agholme L., Agnello M., Agostinis P., Aguirre-Ghiso J. A., Ahn H. J., Ait-Mohamed O., Ait-Si-Ali S., Akematsu T., Akira S., et al. (2012) Guidelines for the use and interpretation of assays for monitoring autophagy. Autophagy 8, 445–544 10.4161/auto.19496 [DOI] [PMC free article] [PubMed] [Google Scholar]
- 20. Youle R. J., and Narendra D. P. (2011) Mechanisms of mitophagy. Nat. Rev. Mol. Cell Biol. 12, 9–14 10.1038/nrm3028 [DOI] [PMC free article] [PubMed] [Google Scholar]
- 21. Wai T., García-Prieto J., Baker M. J., Merkwirth C., Benit P., Rustin P., Rupérez F. J., Barbas C., Ibañez B., and Langer T. (2015) Imbalanced OPA1 processing and mitochondrial fragmentation cause heart failure in mice. Science 350, aad0116 10.1126/science.aad0116 [DOI] [PubMed] [Google Scholar]
- 22. Stiburek L., Cesnekova J., Kostkova O., Fornuskova D., Vinsova K., Wenchich L., Houstek J., and Zeman J. (2012) YME1L controls the accumulation of respiratory chain subunits and is required for apoptotic resistance, cristae morphogenesis, and cell proliferation. Mol. Biol. Cell 23, 1010–1023 10.1091/mbc.E11-08-0674 [DOI] [PMC free article] [PubMed] [Google Scholar]
- 23. McBride H., and Soubannier V. (2010) Mitochondrial function: OMA1 and OPA1, the grandmasters of mitochondrial health. Curr. Biol. 20, R274–R276 10.1016/j.cub.2010.02.011 [DOI] [PubMed] [Google Scholar]
- 24. Narendra D., Tanaka A., Suen D. F., and Youle R. J. (2008) Parkin is recruited selectively to impaired mitochondria and promotes their autophagy. J. Cell Biol. 183, 795–803 10.1083/jcb.200809125 [DOI] [PMC free article] [PubMed] [Google Scholar]
- 25. Ribas V., Drew B. G., Zhou Z., Phun J., Kalajian N. Y., Soleymani T., Daraei P., Widjaja K., Wanagat J., de Aguiar Vallim T. Q., Fluitt A. H., Bensinger S., Le T., Radu C., Whitelegge J. P., et al. (2016) Skeletal muscle action of estrogen receptor α is critical for the maintenance of mitochondrial function and metabolic homeostasis in females. Sci. Transl. Med. 8, 334 10.1126/scitranslmed.aad3815 [DOI] [PMC free article] [PubMed] [Google Scholar]
- 26. Malhotra J. D., and Kaufman R. J. (2007) Endoplasmic reticulum stress and oxidative stress: a vicious cycle or a double-edged sword? Antioxid. Redox. Signal. 9, 2277–2293 10.1089/ars.2007.1782 [DOI] [PubMed] [Google Scholar]
- 27. Chaudhari N., Talwar P., Parimisetty A., Lefebvre d'Hellencourt C., and Ravanan P. (2014) A molecular web: endoplasmic reticulum stress, inflammation, and oxidative stress. Front. Cell. Neurosci. 8, 213 [DOI] [PMC free article] [PubMed] [Google Scholar]
- 28. Cnop M., Welsh N., Jonas J. C., Jorns A., Lenzen S., and Eizirik D. L. (2005) Mechanisms of pancreatic beta-cell death in type 1 and type 2 diabetes: many differences, few similarities. Diabetes 54, Suppl. 2, S97–S107 [DOI] [PubMed] [Google Scholar]
- 29. Margolis K. L., Bonds D. E., Rodabough R. J., Tinker L., Phillips L. S., Allen C., Bassford T., Burke G., Torrens J., Howard B. V., and Women's Health Initiative Investigators. (2004) Effect of oestrogen plus progestin on the incidence of diabetes in postmenopausal women: results from the Women's Health Initiative Hormone Trial. Diabetologia 47, 1175–1187 10.1007/s00125-004-1448-x [DOI] [PubMed] [Google Scholar]
- 30. Kanaya A. M., Herrington D., Vittinghoff E., Lin F., Grady D., Bittner V., Cauley J. A., and Barrett-Connor E. (2003) Glycemic effects of postmenopausal hormone therapy: the Heart and Estrogen/progestin Replacement Study. A randomized, double-blind, placebo-controlled trial. Ann. Intern. Med. 138, 1–9 10.7326/0003-4819-138-1-200301070-00005 [DOI] [PubMed] [Google Scholar]
- 31. Liu S., Kilic G., Meyers M. S., Navarro G., Wang Y., Oberholzer J., and Mauvais-Jarvis F. (2013) Oestrogens improve human pancreatic islet transplantation in a mouse model of insulin deficient diabetes. Diabetologia 56, 370–381 10.1007/s00125-012-2764-1 [DOI] [PMC free article] [PubMed] [Google Scholar]
- 32. Zhu L., Martinez M. N., Emfinger C. H., Palmisano B. T., and Stafford J. M. (2014) Estrogen signaling prevents diet-induced hepatic insulin resistance in male mice with obesity. Am. J. Physiol. Endocrinol. Metab. 306, E1188–E1197 10.1152/ajpendo.00579.2013 [DOI] [PMC free article] [PubMed] [Google Scholar]
- 33. Zhu L., Brown W. C., Cai Q., Krust A., Chambon P., McGuinness O. P., and Stafford J. M. (2013) Estrogen treatment after ovariectomy protects against fatty liver and may improve pathway-selective insulin resistance. Diabetes 62, 424–434 10.2337/db11-1718 [DOI] [PMC free article] [PubMed] [Google Scholar]
- 34. Morselli E., Fuente-Martin E., Finan B., Kim M., Frank A., Garcia-Caceres C., Navas C. R., Gordillo R., Neinast M., Kalainayakan S. P., Li D. L., Gao Y., Yi C. X., Hahner L., Palmer B. F., et al. (2014) Hypothalamic PGC-1α protects against high-fat diet exposure by regulating ERα. Cell Rep. 9, 633–645 10.1016/j.celrep.2014.09.025 [DOI] [PMC free article] [PubMed] [Google Scholar]
- 35. Kim M., Neinast M. D., Frank A. P., Sun K., Park J., Zehr J. A., Vishvanath L., Morselli E., Amelotte M., Palmer B. F., Gupta R. K., Scherer P. E., and Clegg D. J. (2014) ERα upregulates Phd3 to ameliorate HIF-1 induced fibrosis and inflammation in adipose tissue. Mol. Metab. 3, 642–651 10.1016/j.molmet.2014.05.007 [DOI] [PMC free article] [PubMed] [Google Scholar]
- 36. Frank A., Brown L. M., and Clegg D. J. (2014) The role of hypothalamic estrogen receptors in metabolic regulation. Front. Neuroendocrinol. 35, 550–557 10.1016/j.yfrne.2014.05.002 [DOI] [PMC free article] [PubMed] [Google Scholar]
- 37. Liu S., Le May C., Wong W. P., Ward R. D., Clegg D. J., Marcelli M., Korach K. S., and Mauvais-Jarvis F. (2009) Importance of extranuclear estrogen receptor-α and membrane G protein-coupled estrogen receptor in pancreatic islet survival. Diabetes 58, 2292–2302 10.2337/db09-0257 [DOI] [PMC free article] [PubMed] [Google Scholar]
- 38. Liu S., and Mauvais-Jarvis F. (2009) Rapid, nongenomic estrogen actions protect pancreatic islet survival. Islets 1, 273–275 10.4161/isl.1.3.9781 [DOI] [PMC free article] [PubMed] [Google Scholar]
- 39. Liu S., and Mauvais-Jarvis F. (2010) Minireview: Estrogenic protection of beta-cell failure in metabolic diseases. Endocrinology 151, 859–864 10.1210/en.2009-1107 [DOI] [PMC free article] [PubMed] [Google Scholar]
- 40. Youle R. J., and van der Bliek A. M. (2012) Mitochondrial fission, fusion, and stress. Science 337, 1062–1065 10.1126/science.1219855 [DOI] [PMC free article] [PubMed] [Google Scholar]
- 41. Karbowski M., Lee Y. J., Gaume B., Jeong S. Y., Frank S., Nechushtan A., Santel A., Fuller M., Smith C. L., and Youle R. J. (2002) Spatial and temporal association of Bax with mitochondrial fission sites, Drp1, and Mfn2 during apoptosis. J. Cell Biol. 159, 931–938 10.1083/jcb.200209124 [DOI] [PMC free article] [PubMed] [Google Scholar]
- 42. Breckenridge D. G., Stojanovic M., Marcellus R. C., and Shore G. C. (2003) Caspase cleavage product of BAP31 induces mitochondrial fission through endoplasmic reticulum calcium signals, enhancing cytochrome c release to the cytosol. J. Cell Biol. 160, 1115–1127 10.1083/jcb.200212059 [DOI] [PMC free article] [PubMed] [Google Scholar]
- 43. Patten D. A., Wong J., Khacho M., Soubannier V., Mailloux R. J., Pilon-Larose K., MacLaurin J. G., Park D. S., McBride H. M., Trinkle-Mulcahy L., Harper M. E., Germain M., and Slack R. S. (2014) OPA1-dependent cristae modulation is essential for cellular adaptation to metabolic demand. EMBO J. 33, 2676–2691 10.15252/embj.201488349 [DOI] [PMC free article] [PubMed] [Google Scholar]
- 44. Frezza C., Cipolat S., Martins de Brito O., Micaroni M., Beznoussenko G. V., Rudka T., Bartoli D., Polishuck R. S., Danial N. N., De Strooper B., and Scorrano L. (2006) OPA1 controls apoptotic cristae remodeling independently from mitochondrial fusion. Cell 126, 177–189 10.1016/j.cell.2006.06.025 [DOI] [PubMed] [Google Scholar]
- 45. Jiang X., Jiang H., Shen Z., and Wang X. (2014) Activation of mitochondrial protease OMA1 by Bax and Bak promotes cytochrome c release during apoptosis. Proc. Natl. Acad. Sci. U.S.A. 111, 14782–14787 10.1073/pnas.1417253111 [DOI] [PMC free article] [PubMed] [Google Scholar]
- 46. Wu J. J., Quijano C., Chen E., Liu H., Cao L., Fergusson M. M., Rovira I. I., Gutkind S., Daniels M. P., Komatsu M., and Finkel T. (2009) Mitochondrial dysfunction and oxidative stress mediate the physiological impairment induced by the disruption of autophagy. Aging 1, 425–437 10.18632/aging.100038 [DOI] [PMC free article] [PubMed] [Google Scholar]
- 47. Rivera J. F., Costes S., Gurlo T., Glabe C. G., and Butler P. C. (2014) Autophagy defends pancreatic beta cells from human islet amyloid polypeptide-induced toxicity. J. Clin. Invest. 124, 3489–3500 10.1172/JCI71981 [DOI] [PMC free article] [PubMed] [Google Scholar]
- 48. Watada H., and Fujitani Y. (2015) Minireview: autophagy in pancreatic beta-cells and its implication in diabetes. Mol. Endocrinol. 29, 338–348 10.1210/me.2014-1367 [DOI] [PMC free article] [PubMed] [Google Scholar]
- 49. Ebato C., Uchida T., Arakawa M., Komatsu M., Ueno T., Komiya K., Azuma K., Hirose T., Tanaka K., Kominami E., Kawamori R., Fujitani Y., and Watada H. (2008) Autophagy is important in islet homeostasis and compensatory increase of beta cell mass in response to high-fat diet. Cell Metab. 8, 325–332 10.1016/j.cmet.2008.08.009 [DOI] [PubMed] [Google Scholar]
- 50. Egan D., Kim J., Shaw R. J., and Guan K. L. (2011) The autophagy initiating kinase ULK1 is regulated via opposing phosphorylation by AMPK and mTOR. Autophagy 7, 643–644 10.4161/auto.7.6.15123 [DOI] [PMC free article] [PubMed] [Google Scholar]
- 51. Mihaylova M. M., and Shaw R. J. (2011) The AMPK signalling pathway coordinates cell growth, autophagy and metabolism. Nat. Cell Biol. 13, 1016–1023 10.1038/ncb2329 [DOI] [PMC free article] [PubMed] [Google Scholar]
- 52. Kubli D. A., and Gustafsson Å. B. (2012) Mitochondria and mitophagy: the yin and yang of cell death control. Circ. Res. 111, 1208–1221 10.1161/CIRCRESAHA.112.265819 [DOI] [PMC free article] [PubMed] [Google Scholar]
- 53. Narendra D. P., Jin S. M., Tanaka A., Suen D. F., Gautier C. A., Shen J., Cookson M. R., and Youle R. J. (2010) PINK1 is selectively stabilized on impaired mitochondria to activate Parkin. PLoS Biol. 8, e1000298 10.1371/journal.pbio.1000298 [DOI] [PMC free article] [PubMed] [Google Scholar]
- 54. Novoa I., Zeng H., Harding H. P., and Ron D. (2001) Feedback inhibition of the unfolded protein response by GADD34-mediated dephosphorylation of eIF2α. J. Cell Biol. 153, 1011–1022 10.1083/jcb.153.5.1011 [DOI] [PMC free article] [PubMed] [Google Scholar]
- 55. Gurlo T., Rivera J. F., Butler A. E., Cory M., Hoang J., Costes S., and Butler P. C. (2016) CHOP contributes to, but is not the only mediator of, IAPP induced beta-cell apoptosis. Mol. Endocrinol. 30, 446–454 10.1210/me.2015-1255 [DOI] [PMC free article] [PubMed] [Google Scholar]
- 56. Rivera J. F., Gurlo T., Daval M., Huang C. J., Matveyenko A. V., Butler P. C., and Costes S. (2011) Human-IAPP disrupts the autophagy/lysosomal pathway in pancreatic beta-cells: protective role of p62-positive cytoplasmic inclusions. Cell Death Differ. 18, 415–426 10.1038/cdd.2010.111 [DOI] [PMC free article] [PubMed] [Google Scholar]
- 57. Korwitz A., Merkwirth C., Richter-Dennerlein R., Tröder S. E., Sprenger H. G., Quirós P. M., López-Otín C., Rugarli E. I., and Langer T. (2016) Loss of OMA1 delays neurodegeneration by preventing stress-induced OPA1 processing in mitochondria. J. Cell Biol. 212, 157–166 10.1083/jcb.201507022 [DOI] [PMC free article] [PubMed] [Google Scholar]
- 58. Pasqua T., Mahata S., Bandyopadhyay G. K., Biswas A., Perkins G. A., Sinha-Hikim A. P., Goldstein D. S., Eiden L. E., and Mahata S. K. (2016) Impact of chromogranin A deficiency on catecholamine storage, catecholamine granule morphology and chromaffin cell energy metabolism in vivo. Cell Tissue Res. 363, 693–712 10.1007/s00441-015-2316-3 [DOI] [PMC free article] [PubMed] [Google Scholar]
- 59. Drew B. G., Hamidi H., Zhou Z., Villanueva C. J., Krum S. A., Calkin A. C., Parks B. W., Ribas V., Kalajian N. Y., Phun J., Daraei P., Christofk H. R., Hewitt S. C., Korach K. S., Tontonoz P., et al. (2015) Estrogen receptor (ER) α-regulated lipocalin 2 expression in adipose tissue links obesity with breast cancer progression. J. Biol. Chem. 290, 5566–5581 10.1074/jbc.M114.606459 [DOI] [PMC free article] [PubMed] [Google Scholar]