Abstract
C‐type regenerating islet derived‐3 (Reg3) lectins defend against pathogens and keep commensal bacteria at a distance. Deficiency of Reg3g and Reg3b facilitates alcohol‐induced bacterial translocation and alcoholic liver disease. Intestinal Reg3g is down‐regulated in animal models of diet‐induced obesity, but the functional consequences for nonalcoholic steatohepatitis (NASH) are unknown. The aim of this study was to investigate the role of Reg3 lectins in NASH. NASH was induced by a Western‐style fast‐food diet in mice deficient for Reg3g or Reg3b and in transgenic mice overexpressing Reg3g in intestinal epithelial cells (Reg3gTg). Glucose tolerance was assessed after 18 weeks and insulin resistance after 19 weeks of feeding. After 20 weeks, mice were assessed for features of the metabolic syndrome. Obesity was not different in genetically modified mice compared with their respective wild‐type littermates. Glucose intolerance, liver injury, hepatic inflammation, steatosis, fibrosis, and bacterial translocation to mesenteric lymph nodes and to the liver were not different in Reg3g‐deficient mice compared with wild‐type littermates. Plasma endotoxin levels were higher in Reg3g‐deficient mice. Reg3b deficiency protected against glucose intolerance, but liver disease, bacterial translocation, and plasma endotoxin levels were similar to wild‐type littermates. Absence of either REG3G or REG3B protein in the ileum was not compensated for by up‐regulation of the respective other REG3 protein. Transgenic Reg3g mice also developed liver injury, steatosis, and fibrosis similar to their wild‐type littermates. Conclusion: In contrast to alcoholic liver disease, loss of intestinal Reg3 lectins is not sufficient to aggravate diet‐induced obesity and NASH. This supports a multi‐hit pathogenesis in NASH. Only glucose metabolism is affected by Reg3b deficiency. (Hepatology Communications 2018;2:393‐406)
Abbreviations
- AST
aspartate aminotransferase
- Ctrl
control chow
- FFD
Western style fast food diet
- GTT
glucose tolerance test
- IL
interleukin
- ITT
insulin tolerance test
- LPS
lipopolysaccharide
- MLN
mesenteric lymph nodes
- NAFLD
nonalcoholic fatty liver disease
- NASH
nonalcoholic steatohepatitis
- Reg3b
regenerating islet‐derived protein 3 beta
- Reg3g
regenerating islet‐derived protein 3 gamma
- Tg
transgenic
- TGFβ
transforming growth factor β
- TLR‐4
toll‐like receptor 4
- TNF‐α
tumor necrosis factor α
- WT
wild type
Introduction
Obesity and its complications are a globally increasing epidemic. Nonalcoholic fatty liver disease (NAFLD) has a prevalence of >70% in adults who are obese. Disease progression to nonalcoholic steatohepatitis (NASH), fibrosis, cirrhosis, and finally hepatocellular carcinoma worsens the prognosis, and therefore NASH is on the rise to become the leading indication for liver transplantation.1 It is not well understood why some individuals with NAFLD develop progressive liver disease with inflammation and fibrosis.
Intestinal dysbiosis contributes to the development of NAFLD and NASH.2, 3, 4 Transmission of the hepatic phenotype by microbiota transplantation to germ‐free mice or cohousing of mice underlines the role of intestinal dysbiosis for liver disease.5 Dysbiosis and/or poor nutrition can damage the intestinal epithelial barrier and lead to endotoxemia.6 Lipopolysaccharide (LPS; or endotoxin) is a component in the outer membrane of gram‐negative bacteria. Systemic LPS‐binding protein is increased in patients with NAFLD compared to controls who are obese.7 LPS binds and activates toll‐like receptor (TLR)‐4. TLR‐4 expression in liver biopsies is elevated in patients with NASH compared with NAFLD.8 Downstream signals of TLR activation, such as release of tumor necrosis factor α (TNFα) or transforming growth factor β (TGFβ), contribute to liver inflammation, fibrosis, and hepatocellular death.9, 10
Maintaining the strict separation of resident bacteria in the intestinal lumen is mandatory for a healthy host. The C‐type lectins regenerating islet‐derived protein 3 beta (Reg3b) and 3 gamma (Reg3g) are antimicrobial molecules highly expressed especially in the intestine. REG3B and REG3G are up‐regulated upon bacterial colonization of the gut and during intestinal infection and inflammation, thereby contributing to the spatial segregation of intestinal bacteria and the epithelium.11, 12, 13 Bacteria are in closer contact to intestinal epithelial cells in the absence of REG3G.14, 15 Activation of TLR in both intestinal epithelial cells and Paneth cells stimulates expression of REG3G and REG3B in either cell type.12, 16 In colonic epithelial cells, REG3G and REG3B are also up‐regulated by interleukin (IL)‐22 that is mainly released from innate lymphoid cells upon stimulation of dendritic cells with IL‐23.17, 18 We have recently demonstrated that ethanol‐fed Reg3b−/− and Reg3g−/− mice have increased mucosa‐associated bacteria and bacterial translocation. Absence of REG3B or REG3G renders mice more susceptible to alcoholic liver disease.19 Intestine‐specific overexpression of REG3G reduced mucosa adherent bacteria, decreased bacterial translocation, and protected mice from liver disease following chronic ethanol administration.19 In animal models of diet‐induced obesity, intestinal Il‐22 and Reg3g are down‐regulated.4, 20, 21 Here, we investigated the role of REG3B and REG3G on bacterial translocation and liver disease in a mouse model of diet‐induced NASH.
Materials and Methods
MICE
Reg3g−/−, Reg3b−/−, and transgenic Reg3g (Reg3gTg) mice with intestinal overexpression of Reg3g on a C57BL/6 background have been described.14, 19 Heterozygous Reg3g+/− and Reg3b+/− mice were bred to generate wild‐type (WT) and knockout littermates. Reg3gTg mice were bred to WT C57BL/6 mice to generate transgenic and WT littermates. Male mice were housed with littermates of the same genotype after weaning. At age 8 weeks, mice were started on a Western‐style fast‐food diet (FFD) (AIN‐76A; TestDiet, St. Louis, MO) for 20 weeks. Drinking water was supplemented with 18.9 g/L glucose (G8270; Sigma Aldrich, St. Louis, MO) and 23.1 g/L fructose (F0127; Sigma Aldrich) to mimic soft drinks containing high‐fructose corn syrup with 42% fructose.22 Control mice (Ctrl) received standard chow (5053 PicoLab Rodent Diet; LabDiet, St. Louis, MO) and autoclaved tap water. Mice had free access to food and water and were kept with 7090 Teklad sani‐chips bedding (Envigo, East Millstone, NJ). Animals were maintained on a 12‐h:12‐h light–dark cycle; experiments were performed during the light cycle.
A glucose tolerance test (GTT) was performed after 18 weeks of feeding by injecting 1 μg glucose/g body weight intraperitoneally. After 19 weeks of feeding, an insulin tolerance test (ITT) was performed by injecting insulin (Novolin N NPH; Novo Nordisk Inc., Princeton, NJ) at a concentration of 0.5 mU/g body weight intraperitoneally. Prior to GTT and ITT, mice were fasted for 6 hours. Tail vein blood for blood glucose levels was obtained before injection (t = 0 minutes) and at t = 15, 30, 60, 90, 120 minutes following the injection.
All animal studies were reviewed and approved by the Institutional Animal Care and Use Committee of the University of California, San Diego.
GENE EXPRESSION ANALYSIS
RNA of mouse liver and ileum was extracted using Ambion Trizol Reagent (15596; Thermo Fisher Scientific, Waltham, MA) following the manufacturer's protocol. Deoxyribonuclease treatment of RNA was performed using the RQ1 RNase‐Free DNase (M6101; Promega, Madison, WI), and RNA was reverse transcribed using the Applied Biosystems High‐Capacity Complementary DNA Reverse Transcription Kit (43688; Thermo Fisher Scientific). Real‐time quantitative polymerase chain reaction was performed with iTaq Universal SYBR Green Supermix (Bio‐Rad, Hercules, CA) using an Applied Biosystems StepOnePlus thermocycler (4376600; Thermo Fisher Scientific). Primer sequences were obtained from the National Institutes of Health mouse qPrimerDepot. Gene expressions were normalized to the mouse 18S gene and expressed relative to Ctrl‐fed or FFD‐fed WT mice.
GENOMIC DNA ANALYSIS
Genomic DNA was isolated from sterile mouse liver to quantify bacterial 16S. The liver was homogenized in 1 mL sterile Hanks' balanced salt solution without calcium/magnesium/phenol red (14175; Thermo Fisher Scientific) using lysing matrix C tubes (MP116912; MP Biomedicals, Santa Ana, CA) and a Mini‐BeadBeater‐96 (GlenMills, Clifton, NJ). This was followed by digestion with ribonuclease A (19101; Qiagen, Valencia, CA), 10% sodium dodecyl sulfate (L3771; Sigma‐Aldrich) and proteinase K (Am2546; Thermo Fisher Scientific) at 55°C for 1 hour. After adding phenol (15513; Thermo Fisher Scientific), suspensions were transferred to individual lysing matrix B tubes (MP116911; MP Biomedicals) and homogenized. The lysate was then extracted 3 times using phenol/chloroform/isoamyl alcohol (15593; Thermo Fisher Scientific) and once with chloroform with the addition of sodium acetate buffer solution (S7899; Sigma‐Aldrich). DNA was finally precipitated and washed with ethanol and resuspended in sterile water (BP561; Thermo Fisher Scientific). The 16S ribosomal RNA gene was amplified using established primers (forward, 5′‐GTG STG CAY GGY TGT CGT CA‐3′; reverse, 5′‐ACG TCR TCC MCA CCT TCC TC‐3′),23 and then gene expression was normalized to host 18S.
ANAEROBIC BACTERIAL CULTURES
At the time of harvesting, mesenteric lymph nodes (MLNs) were homogenized in sterile phosphate‐buffered saline (BP661; Thermo Fisher Scientific) and plated on brucella agar with 5% sheep blood, hemin, and vitamin K1 (297848; Becton, Dickinson and Company, Franklin Lakes, NJ). The plates were incubated for 72 hours at 37°C under strict anoxic conditions in an anaerobic chamber (Coy Lab Products, Grass Lake, MI) followed by the counting of colony‐forming units.
PROTEIN ANALYSIS
Intestinal tissue was homogenized in Dignam C buffer.24 We used 50 μg of protein homogenate for immunoblotting and the following primary antibodies: anti‐Reg3b (MAB5110; R&D Systems, Inc., Minneapolis, MN), anti‐Reg3g,14 and anti‐β‐actin (A5441; Sigma‐Aldrich). Immunoblots were developed using chemiluminescence (34580; Thermo Fisher Scientific) with a charge‐coupled device camera (Gel Doc XR+ System; Bio‐Rad), and bands were analyzed by densitometry using Image J version 1.49 (National Institutes of Health, Bethesda, MD).
BIOCHEMICAL ANALYSES
Biochemical analyses were performed according to the manufacturers' protocols. Aspartate aminotransferase (AST) was measured from plasma obtained from the inferior vena cava, using a kinetic assay (TR70121; Thermo Fisher Scientific). Plasma LPS levels were measured using a reporter cell line (hkb‐htlr4; Invivogen, San Diego, CA).25 LPS results were confirmed in FFD‐fed animals (data not shown), using a commercially available enzyme‐linked immunosorbent assay (CEB526Ge; Cloud‐Clone Corp., Katy, TX). Liver lipids were isolated from caudate lobes. The tissue was homogenized in phosphate‐buffered saline, and lipids were precipitated using methanol and chloroform. Triglyceride levels were measured with a colorimetric endpoint assay (T7532; Pointe Scientific, Canton, MI). Liver hydroxyproline was extracted from 150‐250 mg of mixed liver specimens from left and right liver lobes. The tissue was homogenized in 6 N HCl (3750‐32; USABlueBook), using lysing matrix C tubes with the Mini‐BeadBeater‐96, and subsequently incubated at 110°C for 18 hours. The lysate was obtained using Whatman filter paper, grade 595 1/2 (WHA10311644; Sigma Aldrich). After incubation with chloramine T– (C9887; Sigma Aldrich) and Ehrlich's perchloric acid solution (AC168760250; Thermo Fisher Scientific), triplicates were measured at 558 nm (SpectraMax 190 Microplate Reader; Molecular Devices LLC, Sunnyvale, CA).26, 27
TISSUE STAINING
At harvesting, the median liver lobe, including gall bladder, was fixed in 10% formalin (HT501128; Sigma‐Aldrich) for 24 to 48 hours, then transferred to 70% ethanol and embedded in paraffin. We stained 3‐μm paraffin sections with hematoxylin and eosin (38015 and 380161, SelecTech; Leica Biosystems Inc., Buffalo Grove, IL) or 0.1% picrosirius red (color index 35780, 365548; Sigma‐Aldrich).
STATISTICAL ANALYSES
Numbers of biological replicates for each experiment are given in http://onlinelibrary.wiley.com/doi/10.1002/hep4.1165/full. Area under the curve and area over baseline of blood glucose levels were analyzed for ITT and GTT, respectively. Outliers were detected using the Tukey method. Normal distribution of values was assessed with the D'Agostino and Pearson omnibus normality test. Normally distributed groups were compared by the unpaired t test; non‐normally distributed groups were compared by the Mann‐Whitney test. All results are expressed as mean ± SEM. Analyses and data plots were done with GraphPad Prism 6.01 (GraphPad Software, Inc., La Jolla, CA). Differences are considered significant if P < 0.05.
Results
Reg3g−/−, Reg3b−/−, and Reg3gTg mice were fed for 20 weeks with a Western‐style FFD to test if Reg3 lectins are protective in diet‐induced NASH.
Reg3g‐DEFICIENT MICE DEVELOP SIMILAR METABOLIC FEATURES AS THEIR WT LITTERMATES
Reg3g deficiency did not affect body weight, epididymal fat weight, or brown fat weight (Fig. 1A), although food intake of FFD‐fed Reg3g−/− mice was about 10% higher compared to their WT littermates (Fig. 1B). GTTs were performed after 18 weeks of feeding (Fig. 1C). FFD‐fed cohorts had worse glucose tolerance than their Ctrl‐fed littermates; differences between Reg3g−/− and WT mice did not exist. The effect of insulin on blood glucose levels was attenuated in the FFD‐fed cohorts; this effect was also independent from the genotype (Fig. 1D). Taken together, metabolic features were mainly influenced by the type of diet and did not differ between Reg3g‐deficient and WT littermate mice.
Figure 1.
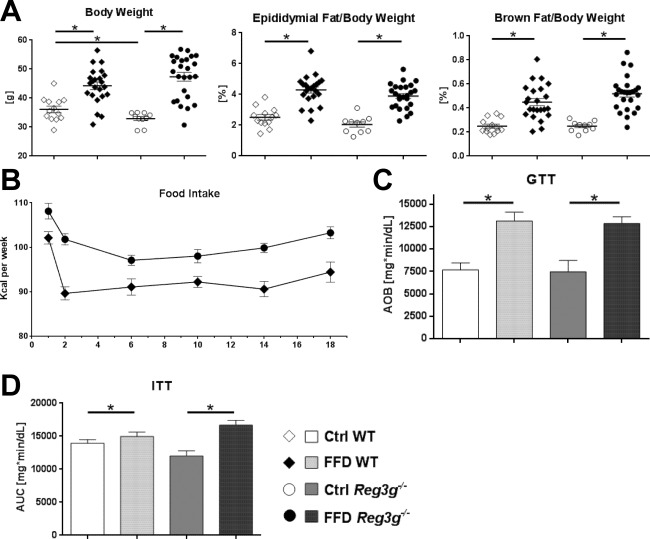
Effect of Reg3g deficiency on body weight and metabolic function. (A) Body weight, and relative weights of epididymal and brown fat tissues after 20 weeks of feeding. (B) Food intake per group over the course of the experiment. (C) Glucose tolerance test performed after 18 weeks of feeding. (D) Insulin tolerance test performed after 19 weeks of feeding. Data represent mean ± SEM; *P < 0.05. Refer to http://onlinelibrary.wiley.com/doi/10.1002/hep4.1165/full for numbers of biological replicates. Abbreviation: AUC, area under the curve.
ABSENCE OF Reg3g MODESTLY ENHANCES FEATURES OF NASH
To determine the significance of REG3G for the development of NASH, parameters of liver injury, inflammation, steatosis, and fibrosis were investigated. Hepatic injury, expressed as plasma AST, was not significantly different between FFD‐fed WT littermates and Reg3g−/− mice (Fig. 2B). The expression of inflammatory genes downstream of TLR activation (C‐C motif chemokine ligand 2 [Ccl2] and Tnf) did not differ between FFD‐fed Reg3g‐deficient mice and their WT littermates (Fig. 2C,D). Similarly, hepatic steatosis, expressed as total liver triglycerides and relative liver weight, did not differ between FFD‐fed Reg3g−/− mice and their WT littermates (Fig. 2E,F). Representative liver sections are depicted in Fig. 2B. Hepatic expression of genes related to fibrosis, including collagen type 1 α1 (Col1a1) and smooth muscle alpha‐actin (Acta2), did not differ between FFD‐fed WT littermates and Reg3g−/− mice (Fig. 2G,H). Fibrosis, expressed as total liver hydroxyproline, was highest in FFD‐fed Reg3g−/− mice but not significantly different from their WT littermates (Fig. 2I,J). Taken together, Reg3g deficiency weakly affected liver injury and fibrosis following FFD feeding. The liver phenotype appeared to be more affected by the type of diet than by the deficiency of Reg3g.
Figure 2.
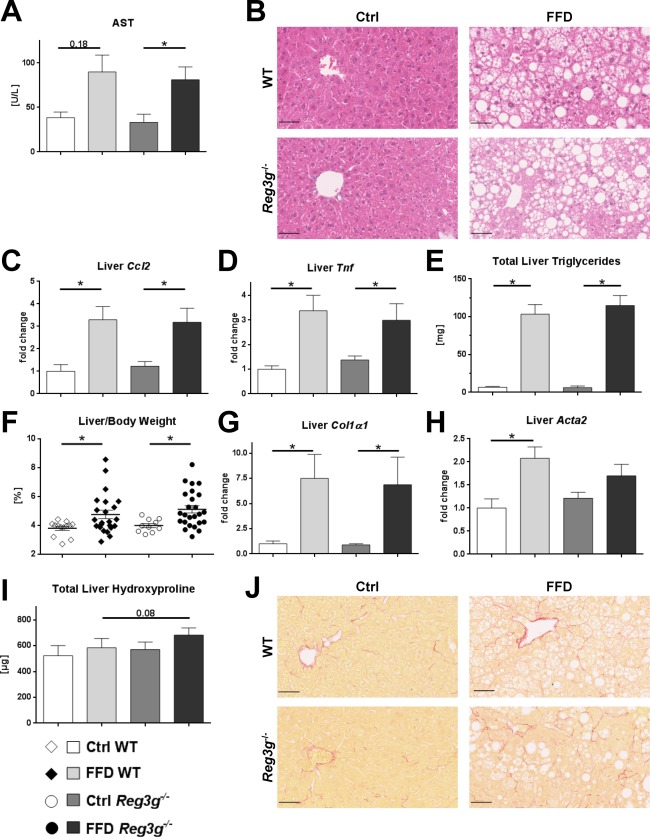
Effect of Reg3g deficiency on liver phenotype. (A) AST plasma levels. (B) Representative hematoxylin and eosin‐stained liver sections. (C,D) Expression of inflammatory genes in liver samples. (E) Total amount of triglycerides per liver. (F) Relative liver weight. (G,H) Expression of fibrosis‐related genes in liver samples. (I) Total amount of hydroxyproline per liver. (J) Representative sirius red‐stained liver sections. Scale bars, 50 μm. Data represent mean ± SEM; *P < 0.05. Refer to http://onlinelibrary.wiley.com/doi/10.1002/hep4.1165/full for numbers of biological replicates.
EFFECT OF FFD‐FEEDING ON BACTERIAL TRANSLOCATION IN Reg3g‐DEFICIENT MICE
We next assessed if intestinal REG3G is restricting bacterial translocation with a Western‐style diet. The translocation of bacteria to MLNs and the liver was not increased in Reg3g−/− mice compared to their FFD‐fed wild‐type littermates (Fig. 3A). In contrast, translocation of bacterial endotoxins was elevated in FFD‐fed Reg3g−/− mice but not in the Ctrl‐fed littermate groups (Fig. 3B). As LPS is a ligand for the TLR‐4, we examined Tlr4 expression in the liver. However, while FFD increased hepatic Tlr4, Reg3g deficiency did not increase it further (Fig. 3C). To explain the unexpectedly weak effect of Reg3g deficiency, a possible intestinal compensation by REG3B was investigated. Ileal expression of REG3B did not differ between FFD‐fed Reg3g−/− mice and their WT littermates (Fig. 3D). A representative western blot is depicted in Fig. 3E. There was also no difference in REG3B in the Ctrl‐fed littermate groups (data not shown). Taken together, REG3G could not protect from translocation of bacteria and hepatic Tlr4 expression but might be important for the reduction of endotoxemia in a model of diet‐induced NASH. REG3G deficiency was not compensated by an increase in REG3B.
Figure 3.
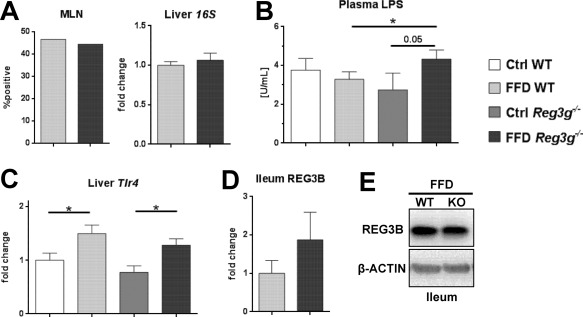
Effect of Reg3g deficiency on bacterial translocation. (A) Results of anaerobic mesenteric lymph node cultures and total bacteria in liver specimens. (B) Plasma lipopolysaccharide levels. (C) Expression of Tlr4 in liver samples. (D) REG3B protein expression in ileal samples. (E) Representative REG3B expression in ileal samples of FFD‐fed WT and Reg3g−/− mice. Data represent mean ± SEM; *P < 0.05. Refer to http://onlinelibrary.wiley.com/doi/10.1002/hep4.1165/full for numbers of biological replicates. Abbreviation: KO, knockout.
METABOLIC PHENOTYPE IN Reg3b‐DEFICIENT MICE
Reg3b deficiency did not affect body weight, epididymal fat weight, or brown fat weight (Fig. 4A). Food intake of FFD‐fed Reg3b−/− mice was similar to their WT littermates (Fig. 4B). In contrast to the Reg3g experiment, the FFD‐fed Reg3b−/− mice did not develop glucose intolerance compared to their Ctrl‐fed littermates over the course of the feeding experiment (Fig. 4C). This resulted in better glucose tolerance of FFD‐fed Reg3b−/− mice compared to their WT littermates (Fig. 4C). The result was confirmed with the ITT that showed a higher drop of blood glucose levels after insulin injections in FFD‐fed Reg3b−/− mice compared to their WT littermates (Fig. 4D). Taken together, Western‐style diet equally induced obesity in Reg3b‐deficient and WT littermate mice. Interestingly, Reg3b−/− mice were resistant to the development of diet‐induced glucose intolerance and insulin resistance.
Figure 4.
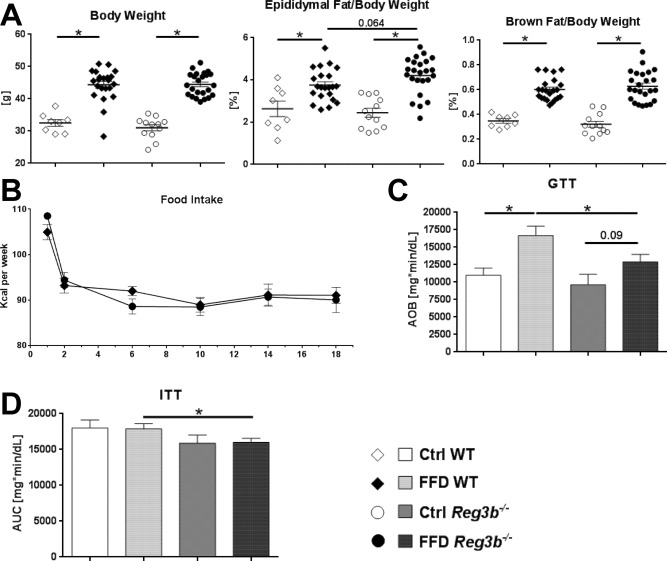
Effect of Reg3b deficiency on body weight and metabolic function. (A) Body weight and relative weights of epididymal and brown fat tissues after 20 weeks of feeding. (B) Food intake per group over the course of the experiment (C) Glucose tolerance test performed after 18 weeks of feeding. (D) Insulin tolerance test performed after 19 weeks of feeding. Data represent mean ± SEM; *P < 0.05. Refer to http://onlinelibrary.wiley.com/doi/10.1002/hep4.1165/full for numbers of biological replicates. Abbreviations: AOB, area over baseline; AUC, area under the curve.
NASH FEATURES IN Reg3b‐DEFICIENT MICE
To determine the significance of REG3B for the development of NASH, parameters of liver injury, inflammation, steatosis, and fibrosis were investigated. Plasma AST and the expression of inflammatory genes encoding for Ccl2, Tnf, and Tgfb1 were elevated in the FFD‐fed cohorts but did not differ between WT littermate and Reg3b−/− mice (Fig. 5A‐E). Hepatic steatosis, expressed as total liver triglycerides (Fig. 5F) and relative liver weight (Fig. 5G), also did not differ between FFD‐fed Reg3b−/− mice and their WT littermates. Representative liver sections are depicted in Fig. 5B. Measures of liver fibrosis were induced in FFD‐fed animals. Total liver hydroxyproline was highest in FFD‐fed Reg3b−/− mice but not statistically different to WT littermates (Fig. 5H). Representative liver sections are depicted in Fig. 5I. The investigated fibrosis‐related genes were induced in FFD‐fed animals (Fig. 5J,K). The expression of Col1a1 did not differ between Reg3b−/− and WT littermate mice (Fig. 5J). Tissue inhibitor of metalloproteinase 1 (Timp1) expression was highest in FFD‐fed Reg3b−/−mice but also did not differ from WT littermates (Fig. 5K). Taken together, Reg3b deficiency does not aggravate diet‐induced NASH.
Figure 5.
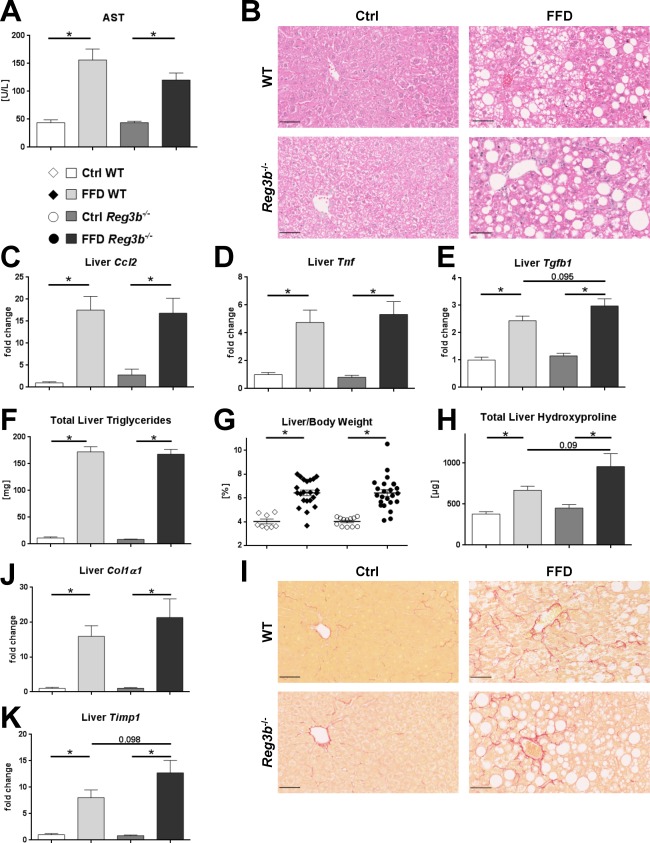
Effect of Reg3b deficiency on liver phenotype. (A) AST plasma levels. (B) Representative hematoxylin and eosin‐stained liver sections. (C‐E) Expression of inflammatory genes in liver samples. (F) Total amount of triglycerides per liver. (G) Relative liver weight. (H) Total amount of hydroxyproline per liver. (I) Representative sirius red‐stained liver sections. (J,K) Expression of fibrosis‐related genes in liver samples. Scale bars, 50 μm. Data represent mean ± SEM; *P < 0.05. Refer to http://onlinelibrary.wiley.com/doi/10.1002/hep4.1165/full for numbers of biological replicates.
EFFECT OF INTESTINAL REG3B ON BACTERIAL TRANSLOCATION
We next investigated if intestinal REG3B is restricting bacterial translocation with a Western‐style diet. Bacterial translocation to MLNs rarely occurred and was not different between groups (data not shown). Bacterial translocation to the liver was also not affected by Reg3b deficiency in FFD‐fed mice (Fig. 6A). In contrast to the Reg3g‐deficient mice, absence of Reg3b did not lead to an increase of plasma LPS levels (Fig. 6B). Hepatic expression of Tlr4 was increased with the FFD but not with Reg3b deficiency (Fig. 6C). Comparable to the Reg3g cohort, there was no compensation by REG3G in the ileum of FFD‐fed Reg3b‐deficient mice (Fig. 6D). A representative western blot is depicted in Fig. 6E. There was also no difference in REG3G in the Ctrl‐fed littermate groups (data not shown). Taken together, this study could not find evidence that REG3B protects from translocation of bacteria and endotoxins in a model of diet‐induced NASH. The deficiency of REG3B was not compensated by an increase of REG3G in the ileum.
Figure 6.
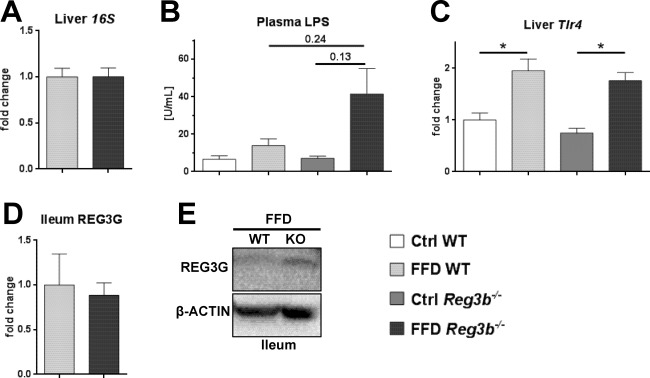
Effect of Reg3b deficiency on bacterial translocation. (A) Total bacteria in liver specimens. (B) Plasma LPS levels. (C) Expression of Tlr4 in liver samples. (D) REG3G protein expression in ileal samples. (E) Representative REG3G expression in ileal samples of FFD‐fed WT and Reg3g−/− mice. Data represent mean ± SEM; *P < 0.05. Refer to http://onlinelibrary.wiley.com/doi/10.1002/hep4.1165/full for numbers of biological replicates. Abbreviation: KO, knockout.
INTESTINAL Reg3g OVEREXPRESSION DOES NOT PROTECT FROM DIET‐INDUCED NASH
To cross‐validate the findings, an identical feeding experiment was performed in Reg3gTg mice, overexpressing Reg3g in intestinal epithelial cells under the control of the villin promoter.19
Body weight and epididymal fat weight did not differ between the FFD‐fed cohorts. Only the relative brown fat weight was lower in FFD‐fed Reg3gTg mice compared to their WT littermates (Fig. 7A). Food intake of the FFD‐fed cohorts was identical (Fig. 7B).
Figure 7.
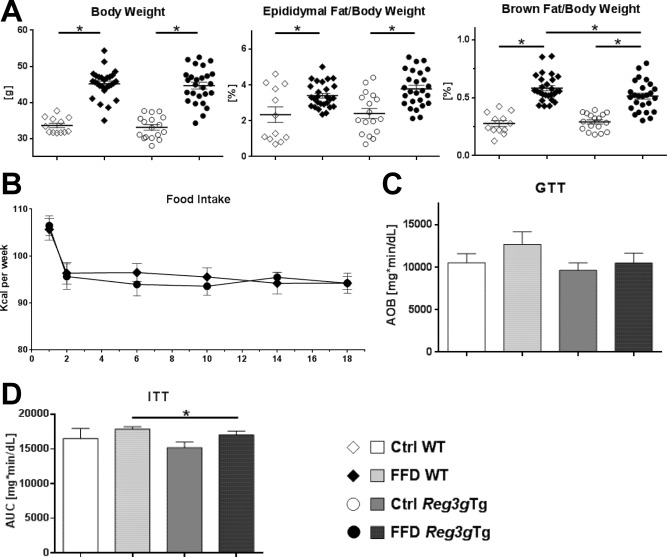
Effect of Reg3g overexpression on body weight and metabolic function. (A) Body weight and relative weights of epididymal and brown fat tissues after 20 weeks of feeding. (B) Food intake per group over the course of the experiment. (C) Glucose tolerance test performed after 18 weeks of feeding. (D) Insulin tolerance test performed after 19 weeks of feeding. Data represent mean ± SEM; *P < 0.05. Refer to http://onlinelibrary.wiley.com/doi/10.1002/hep4.1165/full for numbers of biological replicates. Abbreviations: AOB, area over baseline; AUC, area under the curve.
Interestingly, Ctrl‐ and FFD‐fed cohorts showed similar glucose tolerance after 18 weeks of feeding (Fig. 7C). The overexpression of Reg3g was not beneficial. However, the FFD‐fed Reg3gTg mice showed more sensitivity to insulin than their WT littermates (Fig. 7D).
Liver injury was equally present in the WT and Reg3gTg littermate mice (Fig. 8A). Similarly, hepatic steatosis did not differ between the FFD‐fed cohorts (Fig. 8B,C). FFD equally induced fibrosis in the transgenic and the WT animals. According to the liver hydroxyproline levels, FFD‐fed Reg3gTg mice were not protected from liver fibrosis compared to their WT littermates (Fig. 8E). Bacterial translocation to MLNs rarely occurred and was not lower in the FFD‐fed transgenic Reg3g mice (data not shown).
Figure 8.
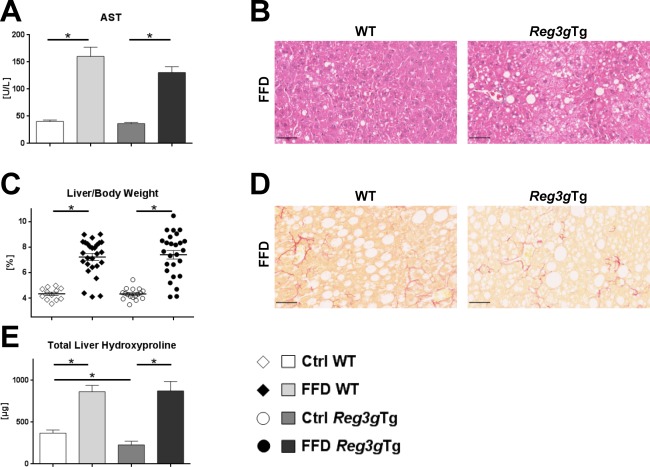
Effect of Reg3g overexpression on liver phenotype and bacterial translocation. (A) AST plasma levels. (B) Representative hematoxylin and eosin‐stained liver sections. (C) Relative liver weight. (D) Representative sirius red‐stained liver sections. (E) Total amount of hydroxyproline per liver. Scale bars, 50 μm. Data represent mean ± SEM; *P < 0.05. Refer to http://onlinelibrary.wiley.com/doi/10.1002/hep4.1165/full for numbers of biological replicates.
Taken together, FFD‐fed Reg3gTg mice were only protected from insulin resistance but not from all other parameters of diet‐induced metabolic syndrome; a protection from bacterial translocation or NASH was also not present in FFD‐fed Reg3gTg mice.
Discussion
The role of Reg3 lectins in diet‐induced NASH was investigated in Reg3g−/−, Reg3b−/−, and Reg3gTg mice. Despite elevated endotoxemia, Reg3g‐deficient mice did not develop more liver disease than their WT littermates. Both Reg3b‐deficient and Reg3gTg mice had similar liver phenotypes as their WT littermates. Reg3b‐deficient mice were protected from glucose intolerance and insulin resistance. Overall, our results do not indicate that loss of Reg3g or Reg3b is sufficient to aggravate NAFLD or that intestinal overexpression of Reg3g can protect against NASH.
We have recently demonstrated a protective role of Reg3 lectins in alcoholic liver disease.19 After ethanol feeding, Reg3g−/− and Reg3b−/− mice had increased bacterial translocation to mesenteric lymph nodes and liver and mice were more susceptible to ethanol‐induced liver disease.19 Intestinal overexpression of REG3G reduced bacterial translocation and protected mice from alcoholic liver disease. A possible explanation for the relevance of Reg3 lectins in alcoholic liver disease but not in NASH might originate from the toxic effects of ethanol or its metabolites on the intestinal epithelium. Increased gastrointestinal permeability has long been recognized in acute and chronic alcohol consumption.28 Alcohol‐associated gut dysbiosis induces intestinal inflammation and increases intestinal permeability in mice.29 Acetaldehyde, which is a product of ethanol metabolism, and the generation of reactive oxygen species through cytochrome P450 2E1 induction might contribute to tight junction disruption leading to increased permeability.6 Increased bacterial translocation adds to chronic ethanol‐induced hepatic inflammation long before chronic liver disease occurs. Absence of Reg3 lectins enhances this mechanism.19 In NAFLD and NASH, mechanistic data of dietary effects on the intestinal barrier are less stringent. While several mouse models with gene knockouts of intestinal defense mechanisms, such as junctional adhesion molecule A and myeloid differentiation protein 88, provide hints for the interrelation of intestine and liver in NASH, the causality of diet‐induced damage of the intestinal barrier and subsequent liver disease is not as clear as in alcohol consumption.30, 31 Investigation of the gut–liver axis in fatty liver disease might, in part, be hampered by numerous dietary regimes that are used to experimentally induce NASH in rodents.22 In human studies, the investigation of endotoxemia using LPS or LPS‐binding protein showed inconsistent results for NAFLD and NASH.7, 8, 32, 33, 34 Data on bacterial translocation in human NAFLD or NASH are scarce. Recently, increased 16S gene copies and reduced bacterial diversity were reported in the blood‐obtained buffy coat of patients with biopsy‐confirmed liver fibrosis compared to fatty liver alone.35 To the best of our knowledge, no paper investigating bacterial translocation to livers of patients with NAFLD or NASH has been published. We used a Western diet model for 20 weeks to induce NASH in mice.36 The Western diet did not induce translocation of viable bacteria to mesenteric lymph nodes or increase 16S gene copies in the liver in WT mice compared with Ctrl‐fed mice (data not shown). Although systemic endotoxin levels were elevated in Reg3g‐deficient mice, this did not result in enhanced features of NASH. Alcohol‐associated liver disease is dependent on increased translocation of microbial products 29, 37 or viable bacteria,19, 38 while our current data indicate that increased intestinal permeability for endotoxins is not a major contributor to NAFLD disease progression. Both alcoholic liver disease and NASH are dysbiosis‐driven diseases and can be transmitted by microbiota transfer.2, 39, 40 It is likely that functional microbiota changes associated with dysbiosis, such as ethanol production, choline metabolism, and trimethylamine synthesis, and changes in bile acids are more important for the pathogenesis of NAFLD and NASH progression.41, 42, 43 With regard to our findings, changes in intestinal Reg3g expression in previous mouse studies applying either harmful high‐fat diet or beneficial fibers 20, 21, 44 might be of minor meaning for the progression of NAFLD.
An interesting finding was the reduced glucose intolerance and insulin resistance in obese, FFD‐fed, Reg3b‐deficient mice. REG3B might influence the development of diabetes as it is expressed not only in the intestine but also in the pancreas, acting in pancreatic β‐cell proliferation and regeneration.45, 46 Goto‐Kakizaki rats that spontaneously develop diabetes showed overexpression of islet Reg3b.47 This was explained as a response to the inflammation leading to islet injury.48 In addition, human beta‐cell tissues of type 2 diabetics had increased expression of human Reg family members, presumably as a response to inflammation.49 This further supports a possible role of REG3B in islet injury. Using a high‐fat diet to induce type 2 diabetes, obese mice with pancreatic β‐cell‐specific overexpression of REG3B had higher blood glucose levels than their obese WT controls.50 In summary, Reg3b deficiency might be protective in diet‐induced type 2 diabetes, as it ameliorates the inflammation leading to islet injury and subsequent decrease of insulin secretion over time.
In conclusion, deficiency of Reg3 lectins alone is not sufficient to influence the gut–liver axis in the development of NASH by facilitated bacterial translocation. Reg3‐deficient mice do not develop more severe liver disease, and intestinal overexpression of Reg3g does not protect from NASH. This is in contrast to alcoholic liver disease and supports a multi‐hit pathogenesis in NASH. Reg3b might be important for the development of type 2 diabetes, but this requires further investigation.
Author names in bold designate shared co‐first authorship.
Supporting information
Additional Supporting Information may be found at http://onlinelibrary.wiley.com/doi/10.1002/hep4.1165/full.
Supplementary Table 1
Acknowledgment
We thank Phillipp Hartmann, Tim Hendrikx, Kathrin Hochrath, Tatsuo Inamine, Kuei‐Chuan Lee, Cristina Llorente, Susanne Schuster, and An‐Ming Yang for helpful discussions on methods and sharing of laboratory resources.
Potential conflict of interest: Nothing to report.
Supported by grants from the Swiss National Science Foundation (P2SKP3_158649, P3400PB_171581, and P3P3PB_171582 to S.B.); the National Institutes of Health (grants R01 AA020703, U01 AA021856, and U01 AA24726 to B.S.); and the Biomedical Laboratory Research and Development Service of the VA Office of Research and Development (award number I01BX002213 to B.S.).
REFERENCES
- 1. Diehl AM, Day C. Cause, pathogenesis, and treatment of nonalcoholic steatohepatitis. N Engl J Med 2017;377:2063‐2072. [DOI] [PubMed] [Google Scholar]
- 2. Llopis M, Cassard AM, Wrzosek L, Boschat L, Bruneau A, Ferrere G, et al. Intestinal microbiota contributes to individual susceptibility to alcoholic liver disease. Gut 2016;65:830‐839. [DOI] [PubMed] [Google Scholar]
- 3. Boursier J, Mueller O, Barret M, Machado M, Fizanne L, Araujo‐Perez F, et al. The severity of nonalcoholic fatty liver disease is associated with gut dysbiosis and shift in the metabolic function of the gut microbiota. Hepatology 2016;63:764‐775. [DOI] [PMC free article] [PubMed] [Google Scholar]
- 4. Hartmann P, Seebauer CT, Mazagova M, Horvath A, Wang L, Llorente C, et al. Deficiency of intestinal mucin‐2 protects mice from diet‐induced fatty liver disease and obesity. Am J Physiol Gastrointest Liver Physiol 2016;310:G310‐G322. [DOI] [PMC free article] [PubMed] [Google Scholar]
- 5. Le Roy T, Llopis M, Lepage P, Bruneau A, Rabot S, Bevilacqua C, et al. Intestinal microbiota determines development of non‐alcoholic fatty liver disease in mice. Gut 2013;62:1787‐1794. [DOI] [PubMed] [Google Scholar]
- 6. Bluemel S, Williams B, Knight R, Schnabl B. Precision medicine in alcoholic and nonalcoholic fatty liver disease via modulating the gut microbiota. Am J Physiol Gastrointest Liver Physiol 2016;311:G1018‐G1036. [DOI] [PMC free article] [PubMed] [Google Scholar]
- 7. Ruiz AG, Casafont F, Crespo J, Cayon A, Mayorga M, Estebanez A, et al. Lipopolysaccharide‐binding protein plasma levels and liver TNF‐alpha gene expression in obese patients:evidence for the potential role of endotoxin in the pathogenesis of non‐alcoholic steatohepatitis. Obes Surg 2007;17:1374‐1380. [DOI] [PubMed] [Google Scholar]
- 8. Sharifnia T, Antoun J, Verriere TG, Suarez G, Wattacheril J, Wilson KT, et al. Hepatic TLR4 signaling in obese NAFLD. Am J Physiol Gastrointest Liver Physiol 2015;309:G270‐G278. [DOI] [PMC free article] [PubMed] [Google Scholar]
- 9. Seki E, De Minicis S, Osterreicher CH, Kluwe J, Osawa Y, Brenner DA, et al. TLR4 enhances TGF‐beta signaling and hepatic fibrosis. Nat Med 2007;13:1324‐1332. [DOI] [PubMed] [Google Scholar]
- 10. Leist M, Gantner F, Jilg S, Wendel A. Activation of the 55 kDa TNF receptor is necessary and sufficient for TNF‐induced liver failure, hepatocyte apoptosis, and nitrite release. J Immunol 1995;154:1307‐1316. [PubMed] [Google Scholar]
- 11. Cash HL, Whitham CV, Behrendt CL, Hooper LV. Symbiotic bacteria direct expression of an intestinal bactericidal lectin. Science 2006;313:1126‐1130. [DOI] [PMC free article] [PubMed] [Google Scholar]
- 12. Vaishnava S, Behrendt CL, Ismail AS, Eckmann L, Hooper LV. Paneth cells directly sense gut commensals and maintain homeostasis at the intestinal host‐microbial interface. Proc Natl Acad Sci U S A 2008;105:20858‐20863. [DOI] [PMC free article] [PubMed] [Google Scholar]
- 13. Stelter C, Kappeli R, Konig C, Krah A, Hardt WD, Stecher B, et al. Salmonella‐induced mucosal lectin RegIIIbeta kills competing gut microbiota. PloS One 2011;6:e20749. [DOI] [PMC free article] [PubMed] [Google Scholar]
- 14. Vaishnava S, Yamamoto M, Severson KM, Ruhn KA, Yu X, Koren O, et al. The antibacterial lectin RegIIIgamma promotes the spatial segregation of microbiota and host in the intestine. Science 2011;334:255‐258. [DOI] [PMC free article] [PubMed] [Google Scholar]
- 15. Loonen LM, Stolte EH, Jaklofsky MT, Meijerink M, Dekker J, van Baarlen P, et al. REG3gamma‐deficient mice have altered mucus distribution and increased mucosal inflammatory responses to the microbiota and enteric pathogens in the ileum. Mucosal Immunol 2014;7:939‐947. [DOI] [PubMed] [Google Scholar]
- 16. Brandl K, Plitas G, Schnabl B, DeMatteo RP, Pamer EG. MyD88‐mediated signals induce the bactericidal lectin RegIII gamma and protect mice against intestinal Listeria monocytogenes infection. J Exp Med 2007;204:1891‐1900. [DOI] [PMC free article] [PubMed] [Google Scholar]
- 17. Zheng Y, Valdez PA, Danilenko DM, Hu Y, Sa SM, Gong Q, et al. Interleukin‐22 mediates early host defense against attaching and effacing bacterial pathogens. Nat Med 2008;14:282‐289. [DOI] [PubMed] [Google Scholar]
- 18. Klose CS, Artis D. Innate lymphoid cells as regulators of immunity, inflammation and tissue homeostasis. Nat Immunol 2016;17:765‐774. [DOI] [PubMed] [Google Scholar]
- 19. Wang L, Fouts DE, Starkel P, Hartmann P, Chen P, Llorente C, et al. Intestinal REG3 lectins protect against alcoholic steatohepatitis by reducing mucosa‐associated microbiota and preventing bacterial translocation. Cell Host Microbe 2016;19:227‐239. [DOI] [PMC free article] [PubMed] [Google Scholar]
- 20. Everard A, Geurts L, Caesar R, Van Hul M, Matamoros S, Duparc T, et al. Intestinal epithelial MyD88 is a sensor switching host metabolism towards obesity according to nutritional status. Nat Commun 2014;5:5648. [DOI] [PMC free article] [PubMed] [Google Scholar]
- 21. Everard A, Lazarevic V, Gaia N, Johansson M, Stahlman M, Backhed F, et al. Microbiome of prebiotic‐treated mice reveals novel targets involved in host response during obesity. ISMEJ 2014;8:2116‐2130. [DOI] [PMC free article] [PubMed] [Google Scholar]
- 22. Charlton M, Krishnan A, Viker K, Sanderson S, Cazanave S, McConico A, et al. Fast food diet mouse:novel small animal model of NASH with ballooning, progressive fibrosis, and high physiological fidelity to the human condition. Am J Physiol Gastrointest Liver Physiol 2011;301:G825‐G834. [DOI] [PMC free article] [PubMed] [Google Scholar]
- 23. Maeda H, Fujimoto C, Haruki Y, Maeda T, Kokeguchi S, Petelin M, et al. Quantitative real‐time PCR using TaqMan and SYBR Green for Actinobacillus actinomycetemcomitans, Porphyromonas gingivalis, Prevotella intermedia, tetQ gene and total bacteria. FEMS Immunol Med Microbiol 2003;39:81‐86. [DOI] [PubMed] [Google Scholar]
- 24. Dignam JD, Lebovitz RM, Roeder RG. Accurate transcription initiation by RNA polymerase II in a soluble extract from isolated mammalian nuclei. Nucleic Acids Res 1983;11:1475‐1489. [DOI] [PMC free article] [PubMed] [Google Scholar]
- 25. Lemesch S, Ribitsch W, Schilcher G, Spindelbock W, Hafner‐Giessauf H, Marsche G, et al. Mode of renal replacement therapy determines endotoxemia and neutrophil dysfunction in chronic kidney disease. Sci Rep 2016;6:34534. [DOI] [PMC free article] [PubMed] [Google Scholar]
- 26. Jamall IS, Finelli VN, Que Hee SS. A simple method to determine nanogram levels of 4‐hydroxyproline in biological tissues. Anal Biochem 1981;112:70‐75. [DOI] [PubMed] [Google Scholar]
- 27. Iwaisako K, Haimerl M, Paik YH, Taura K, Kodama Y, Sirlin C, et al. Protection from liver fibrosis by a peroxisome proliferator‐activated receptor delta agonist. Proc Natl Acad Sci U S A 2012;109:E1369‐E1376. [DOI] [PMC free article] [PubMed] [Google Scholar]
- 28. Keshavarzian A, Fields JZ, Vaeth J, Holmes EW. The differing effects of acute and chronic alcohol on gastric and intestinal permeability. Am J Gastroenterol 1994;89:2205‐2211. [PubMed] [Google Scholar]
- 29. Chen P, Starkel P, Turner JR, Ho SB, Schnabl B. Dysbiosis‐induced intestinal inflammation activates tumor necrosis factor receptor I and mediates alcoholic liver disease in mice. Hepatology 2015;61:883‐894. [DOI] [PMC free article] [PubMed] [Google Scholar]
- 30. Rahman K, Desai C, Iyer SS, Thorn NE, Kumar P, Liu Y, et al. Loss of junctional adhesion molecule A promotes severe steatohepatitis in mice on a diet high in saturated fat, fructose, and cholesterol. Gastroenterology 2016;151:733‐746.e712. [DOI] [PMC free article] [PubMed] [Google Scholar]
- 31. Okubo H, Kushiyama A, Sakoda H, Nakatsu Y, Iizuka M, Taki N, et al. Involvement of resistin‐like molecule beta in the development of methionine‐choline deficient diet‐induced non‐alcoholic steatohepatitis in mice. Sci Rep 2016;6:20157. [DOI] [PMC free article] [PubMed] [Google Scholar]
- 32. Giorgio V, Miele L, Principessa L, Ferretti F, Villa MP, Negro V, et al. Intestinal permeability is increased in children with non‐alcoholic fatty liver disease, and correlates with liver disease severity. Dig Liver Dis 2014;46:556‐560. [DOI] [PubMed] [Google Scholar]
- 33. Wong VW, Wong GL, Chan HY, Yeung DK, Chan RS, Chim AM, et al. Bacterial endotoxin and non‐alcoholic fatty liver disease in the general population: a prospective cohort study. Aliment Pharmacol Ther 2015;42:731‐740. [DOI] [PubMed] [Google Scholar]
- 34. Yuan J, Baker SS, Liu W, Alkhouri R, Baker RD, Xie J, et al. Endotoxemia unrequired in the pathogenesis of pediatric nonalcoholic steatohepatitis. J Gastroenterol Hepatol 2014;29:1292‐1298. [DOI] [PubMed] [Google Scholar]
- 35. Lelouvier B, Servant F, Paisse S, Brunet AC, Benyahya S, Serino M, et al. Changes in blood microbiota profiles associated with liver fibrosis in obese patients: a pilot analysis. Hepatology 2016;64:2015‐2027. [DOI] [PubMed] [Google Scholar]
- 36. Krishnan A, Abdullah TS, Mounajjed T, Hartono S, McConico A, White T, et al. A longitudinal study of whole body, tissue, and cellular physiology in a mouse model of fibrosing NASH with high fidelity to the human condition. Am J Physiol Gastrointest Liver Physiol 2017;312:G666‐G680. [DOI] [PMC free article] [PubMed] [Google Scholar]
- 37. Yang AM, Inamine T, Hochrath K, Chen P, Wang L, Llorente C, et al. Intestinal fungi contribute to development of alcoholic liver disease. J Clin Invest. 2017;127:2829‐2841. [DOI] [PMC free article] [PubMed] [Google Scholar]
- 38. Llorente C, Jepsen P, Inamine T, Wang L, Bluemel S, Wang HJ, et al. Gastric acid suppression promotes alcoholic liver disease by inducing overgrowth of intestinal Enterococcus. Nat Commun 2017;8:837. Publisher Correction in: Nat Commun 2017;8:2137. [DOI] [PMC free article] [PubMed] [Google Scholar]
- 39. Henao‐Mejia J, Elinav E, Jin C, Hao L, Mehal WZ, Strowig T, et al. Inflammasome‐mediated dysbiosis regulates progression of NAFLD and obesity. Nature 2012;482:179‐185. [DOI] [PMC free article] [PubMed] [Google Scholar]
- 40. Jiao N, Baker SS, Chapa‐Rodriguez A, Liu W, Nugent CA, Tsompana M, et al. Suppressed hepatic bile acid signalling despite elevated production of primary and secondary bile acids in NAFLD. Gut, 2017; doi: 10.1136/gutjnl-2017-314307. [DOI] [PubMed] [Google Scholar]
- 41. Zhu L, Baker SS, Gill C, Liu W, Alkhouri R, Baker RD, et al. Characterization of gut microbiomes in nonalcoholic steatohepatitis (NASH) patients: a connection between endogenous alcohol and NASH. Hepatology 2013;57:601‐609. [DOI] [PubMed] [Google Scholar]
- 42. Schnabl B, Brenner DA. Interactions between the intestinal microbiome and liver diseases. Gastroenterology 2014;146:1513‐1524. [DOI] [PMC free article] [PubMed] [Google Scholar]
- 43. Fang S, Suh JM, Reilly SM, Yu E, Osborn O, Lackey D, et al. Intestinal FXR agonism promotes adipose tissue browning and reduces obesity and insulin resistance. Nat Med 2015;21:159‐165. [DOI] [PMC free article] [PubMed] [Google Scholar]
- 44. Barouei J, Bendiks Z, Martinic A, Mishchuk D, Heeney D, Hsieh YH, et al. Microbiota, metabolome, and immune alterations in obese mice fed a high‐fat diet containing type 2 resistant starch. Mol Nutr Food Res 2017; doi: 10.1002/mnfr.201700184. [DOI] [PubMed] [Google Scholar]
- 45. Narushima Y, Unno M, Nakagawara K, Mori M, Miyashita H, Suzuki Y, et al. Structure, chromosomal localization and expression of mouse genes encoding type III Reg, RegIII alpha, RegIII beta, RegIII gamma. Gene 1997;185:159‐168. [DOI] [PubMed] [Google Scholar]
- 46. Takasawa S. Regenerating gene (REG) product and its potential clinical usage. Expert Opin Ther Targets 2016;20:541‐550. [DOI] [PubMed] [Google Scholar]
- 47. Calderari S, Irminger JC, Giroix MH, Ehses JA, Gangnerau MN, Coulaud J, et al. Regenerating 1 and 3b gene expression in the pancreas of type 2 diabetic Goto‐Kakizaki (GK) rats. PloS One 2014;9:e90045. [DOI] [PMC free article] [PubMed] [Google Scholar]
- 48. Luo C, Li B, Liu L, Yin HP, Wang M, Liu JL. Transcriptional activation of Reg2 and Reg3beta genes by glucocorticoids and interleukin‐6 in pancreatic acinar and islet cells. Mol Cell Endocrinol 2013;365:187‐196. [DOI] [PubMed] [Google Scholar]
- 49. Marselli L, Thorne J, Dahiya S, Sgroi DC, Sharma A, Bonner‐Weir S, et al. Gene expression profiles of beta‐cell enriched tissue obtained by laser capture microdissection from subjects with type 2 diabetes. PloS One 2010;5:e11499. [DOI] [PMC free article] [PubMed] [Google Scholar]
- 50. Xiong X, Li Q, Cui W, Gao ZH, Liu JL. Deteriorated high‐fat diet‐induced diabetes caused by pancreatic beta‐cell‐specific overexpression of Reg3beta gene in mice. Endocrine 2016;54:360‐370. [DOI] [PubMed] [Google Scholar]
Associated Data
This section collects any data citations, data availability statements, or supplementary materials included in this article.
Supplementary Materials
Additional Supporting Information may be found at http://onlinelibrary.wiley.com/doi/10.1002/hep4.1165/full.
Supplementary Table 1


