
Figure 2.
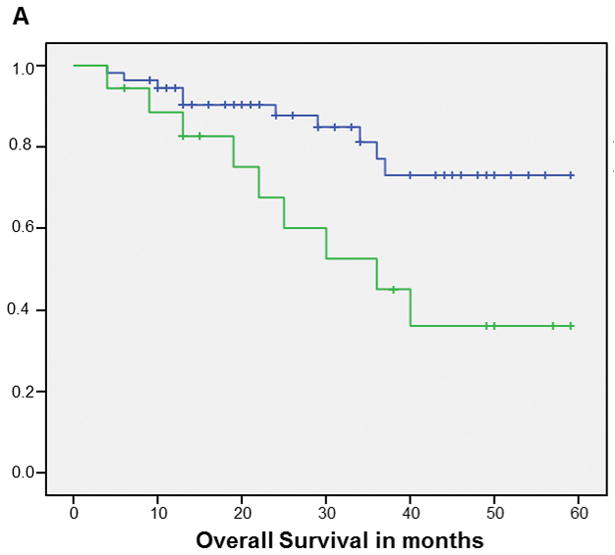
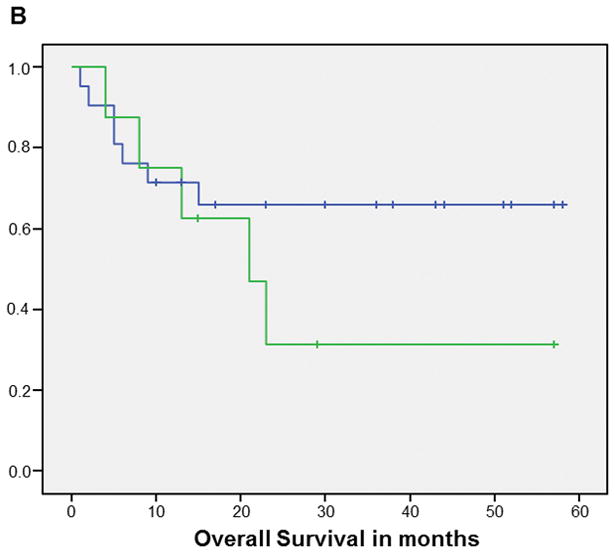
Kaplan-Meier curves of overall survival for HPV+ (A) (p=0.01) and HPV− (B) (p=0.28) patients: never/former smokers (Blue line) vs current smokers (Green line)
Official websites use .gov
A
.gov website belongs to an official
government organization in the United States.
Secure .gov websites use HTTPS
A lock (
) or https:// means you've safely
connected to the .gov website. Share sensitive
information only on official, secure websites.
Kaplan-Meier curves of overall survival for HPV+ (A) (p=0.01) and HPV− (B) (p=0.28) patients: never/former smokers (Blue line) vs current smokers (Green line)