Abstract
Although it is well documented that abnormal levels of either intraocular (IOP) or intracranial pressure (ICP) can lead to potentially blinding conditions, such as glaucoma and papilledema, little is known about how the pressures actually affect the eye. Even less is known about potential interplay between their effects, namely how the level of one pressure might alter the effects of the other. Our goal was to measure in-vivo the pressure-induced stretch and compression of the lamina cribrosa due to acute changes of IOP and ICP. The lamina cribrosa is a structure within the optic nerve head, in the back of the eye. It is important because it is in the lamina cribrosa that the pressure-induced deformations are believed to initiate damage to neural tissues leading to blindness. An eye of a rhesus macaque monkey was imaged in-vivo with optical coherence tomography while IOP and ICP were controlled through cannulas in the anterior chamber and lateral ventricle, respectively. The image volumes were analyzed with a newly developed digital image correlation technique. The effects of both pressures were highly localized, nonlinear and non-monotonic, with strong interactions. Pressure variations from the baseline normal levels caused substantial stretch and compression of the neural tissues in the posterior pole, sometimes exceeding 20%. Chronic exposure to such high levels of biomechanical insult would likely lead to neural tissue damage and loss of vision. Our results demonstrate the power of digital image correlation technique based on non-invasive imaging technologies to help understand how pressures induce biomechanical insults and lead to vision problems.
Keywords: OCT, intraocular pressure, intracranial pressure, biomechanics, elastography, glaucoma, VIIP, lamina cribrosa
1. INTRODUCTION
Loss of vision in glaucoma, a leading cause of blindness worldwide, is due to damage to the retinal ganglion cell axons that transmit visual information from the light-sensitive retina to the brain1. Damage to these axons is believed to initiate within the lamina cribrosa, a structure in the back of the eye through which the axons pass to exit the eye on their way to the brain (Figure 1)1,2. The primary risk factor for glaucoma is elevated intraocular pressure (IOP). Although the mechanisms by which elevated IOP leads to vision loss are not completely understood, it is widely thought that this is through pressure-induced deformations of the neural tissues within the lamina cribrosa.
Figure 1.
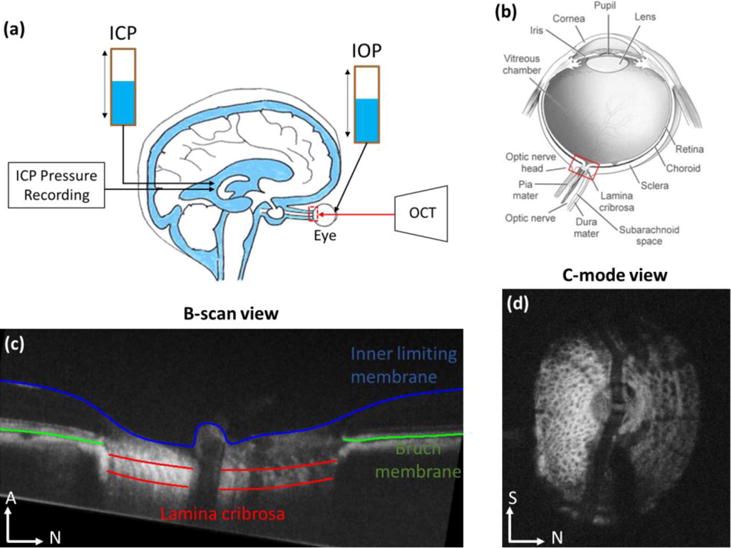
In vivo experiment set up (a), showing the animal in a prone position and imaged with OCT while both pressures, IOP and ICP, were controlled using gravity perfusion (Modified from7). (b) Schematic of the eye, showing the optic nerve head region (red box) and the lamina cribrosa. IOP acts on the lamina cribrosa from the vitreous chamber inside the eye, whereas ICP acts from the subarachnoid space from behind the eye. (c) Example OCT B–scan with manual marks indicating the lamina cribrosa (red) spanning across the scleral canal, as well as Bruch membrane (green) and the inner limiting membrane (blue) in contact with the vitreous. (d) Example C-mode cross section at the level of the lamina cribrosa. N: nasal; S: superior; A: Anterior.
In recent years, evidence has been mounting that the risk of neural tissue damage in glaucoma may depend not only on IOP from within the globe, as is generally accepted, but also on the level of intracranial pressure (ICP) transmitted through the optic nerve subarachnoidal space to the posterior pole of the eye, and the lamina cribrosa within3–6. Thus, accurate prediction of the risk of glaucomatous vision loss requires a thorough understanding of the effects of both IOP and ICP on the lamina cribrosa. The lamina cribrosa is small and frail, which makes it difficult to study. Hence, the effects of IOP and ICP on the lamina cribrosa have not been measured directly and remain unknown.
Our goal in this project was to measure directly the effects of IOP and ICP on the lamina cribrosa, specifically the acute pressure-induced tissue stretch and compression. We use a non-human primate model, in-vivo optical coherence tomography (OCT) and image analysis to map with high level of detail the effects of IOP and ICP on the lamina cribrosa. Herein, we describe the methodology we have developed to this effect, including the experimental component and the image analysis techniques, and present initial findings of pressure effects.
2. METHODS
2.1. Animal handling and image acquisition
All experimental procedures were approved by the University of Pittsburgh’s Institutional Animal Care and Use Committee (IACUC), and adhered to the guidelines set forth by the National Institute of Health’s for the care and use of laboratory animals and by the Association of Research in Vision and Ophthalmology (ARVO) statement for the use of animals in ophthalmic and vision research.
A healthy, adult, rhesus macaque monkey was anesthetized with ketamine (20 mg/kg), midazolam (0.25 mg/kg) or diazepam (1mg/kg) and atropine (0.12mg/kg). The animal was then intubated and maintained under isoflurane anesthesia (1–3%) for the duration of the experiment. To reduce ocular movements that could lead to artifacts in the analyses, before imaging the animal was paralyzed using vecuronium bromide (2mg/hr), and was artificially ventilated to maintain an end-tidal CO2 around 35 mmHg. After imaging, the animal was euthanized using pentobarbital sodium dosed at approximately 85mg/kg.
IOP was controlled using a 27-gauge needle inserted into the anterior chamber of the eye. ICP was controlled via a lumber catheter inserted into the lateral ventricle of the brain (Figure 1a). An additional fiber-optic pressure sensor was inserted into the parenchyma to monitor ICP (Medtronic, Minneapolis, MN). The IOP needle and ICP catheter were connected to separate saline reservoirs and the pressures controlled via gravity perfusion by adjusting the height of each reservoir. IOP was set at 5 (low), 15 (baseline), 30 (high or elevated) mmHg. ICP was set at 3 (low), 10 (baseline), and 25 (high or elevated) mmHg (Figure 2).
Figure 2.
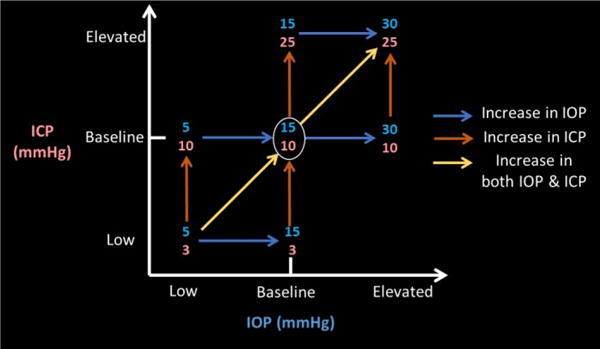
Experimental pressure combinations. Intraocular (IOP, blue, x-axis) and intracranial (ICP, orange, y-axis) were manipulated to be at low, baseline, or elevated levels. Baseline condition is defined at IOP at 15mmHg and ICP at 10mmHg. Scans from condition pairs were analyzed to determine the effects of pressure changes in the direction of the arrows.
Tropicamide drops (0.5%, Bausch & Lomb, Rochester, NY) were used to dilate the pupils and the animals were placed in a prone position during OCT imaging (Figure 1a). The eyes were kept open using a wire speculum. The cornea was fitted with a rigid gas-permeable contact lens (Boston EO, Boston, MA) to improve image quality and kept hydrated throughout the experiment with artificial tears.
Spectral domain OCT (Bioptigen, Research Triangle, NC), with a broadband superluminescent diode (Superlum, Dublin, Ireland; λ=870 nm, Δλ=200 nm) light source, was used to acquire 3D volume scans (3mm × 3mm × 2mm or 512×512×1024 samplings) of the optic nerve head region, focused on the lamina cribrosa (Figure 1a–b). These scans were first acquired at baseline IOP and ICP, and then at all combinations of IOP and ICP. To avoid potential viscoelastic effects8, all scans analyzed in this work were acquired at least 5 minutes after a given pressure change. Multiple scans were collected at each pressure condition with, various focal depth settings. The scans with best lamina cribrosa microstructure visualization were selected from analysis. We focused the analysis on pressure combinations relative to the baseline (Figure 2).
Scan noise was reduced using a Gaussian filter in axial direction. We then aligned in 3D all OCT scans to the baseline pressures. For this, we determined the orientation/angle of the Bruch membrane in a peripheral B-scan, making sure that it did not pass through the canal, of each volume scan, and then performed 3D rotations such that the Bruch membrane had the same orientation across all scans within each eye. We then focused on the lamina cribrosa, applying translations and rotations until the lamina cribrosa of the volumes were in close correspondence. We then selected C-mode sections through the lamina cribrosa of each volume. Correspondence between these sections was ensured using multiple anatomical landmarks of optic nerve head structures, such as the bifurcation of the retinal blood vessels, major beams and/or pores of the lamina cribrosa. The rationale for this method and the consequences will be addressed later in the Discussion.
2.2. Image analysis – Digital image correlation technique
To determine the tissue deformations between conditions, we utilized a multilevel finite element-based digital image correlation technique. We have previously reported on the use of this technique for the analysis of IOP-induced lamina cribrosa deformations measured using second harmonic generated (SHG) images9. The technique was proven robust to noise of various types, an important capability considering the high amount of noise in OCT images. The technique works on image pairs, with one image as the one to deform and the other as the “target” image (Figure 3). For registration, the image to deform is overlaid with a finite element mesh. In an iterative process the gradient of a similarity function is used to define forces acting on the mesh to bring the image into closer correspondence with a target image. As similarity measure we used the normalized cross-correlation function:
where Θ(X) is the neighborhood of a point X at which the similarity is being computed, F and M are the fixed (target) and moving (deforming) images, respectively, and is the displacement field. Registering the images is the process of finding the which minimizes the potential energy ∏ over the domain Ω, as given by:
where ∏~ is defined as above, and
The stress (σ) and strain (ε) are related by σij = Cijklεkl. As in our previous work, assuming simplified materials, the tensor C reduces to 2 coefficients. Thus, the forces guiding the registration can be computed with:
The iterative process of registering the images proceeds until the energy between deformed and target images reaches a minimum, at least in the local sense.
Figure 3.
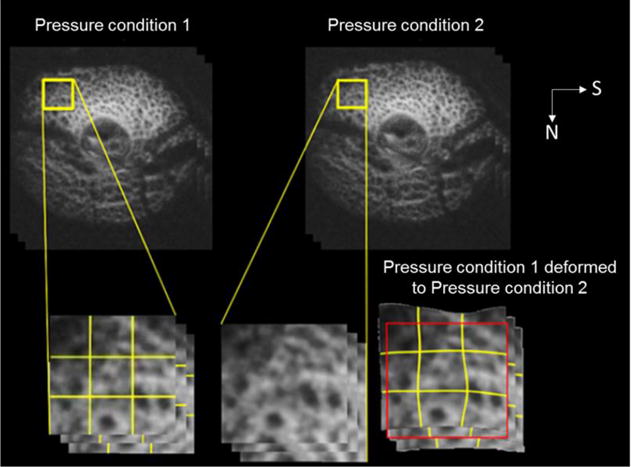
Digital image correlation technique. This technique measures the deformation between OCT images acquired atone pressure condition (Top left) and another (Top right). The image from condition 1 is overlaid with a mesh (call out, bottom left). The local differences between images are then used to define forces that deform the mesh in a direction that reduces the differences with the second image (call-out, bottom center). The mesh is then, in turn, used to deform the image into a candidate match (call-out, bottom right). Through an iterative process, this technique produces a deformed baseline image with excellent agreement to the image at altered pressures. This figure is a simplification of a process implemented at multiple scales, illustrated with two c-mode views. N: nasal. S: superior.
The cross-correlation function chosen was selected because it can take into account the local image structure, without the assumption that image intensity remains constant between images. This is important for analysis of OCT images acquired in-vivo in which the intensity can vary substantially due to factors like cornea or lens opacity, or changes in prelaminar neural tissue scattering10,11. The measure can account for image differences due to noise, image angle and other conditions that are arise in the real settings. Another useful property of the FE-based image registration technique is that it enforces continuity and smoothness, consistent the properties of the soft tissues studied.
For numerical efficiency, and to provide more flexibility to the method, without compromising on accuracy, we implemented the method described above within a multigrid approach. In this approach, the images are registered at multiple levels, with a solution first identified on a coarse-grid on a low resolution image, to obtain a match for the large-scale features. The solution is then passed to a more refined grids and higher resolution images to obtain progressively more refined matches of smaller features. Elsewhere we have discussed the advantages and limitations of this technique9. The higher noise and lower contrast of OCT images compared with previous second-harmonic generation required some adaptations to the method. Specifically, we found it better to use four grid levels, instead of five, removing the smallest grids, so that element sizes ranged from 8 to 44 pixels (versus 3 to 40 in SHG), and similarity neighborhood widths between 15 and 30 pixels (versus 10 and 20 pixels in SHG). These were helpful to increase robustness to noise. From the shape functions of the highest resolution mesh we computed at each pixel an in-plane deformation matrix, and from this matrix, in turn, the first (maximum) and second (minimum) principal strains9. These were further slightly smoothed to remove very large deformations caused by outlier high-aspect ratio elements12.
The image registration technique was applied to scan pairs (Figure 3). This produced maps of deformation between IOP and ICP combinations. We used these to evaluate the effects of changing pressures away from the baseline, as well as between two off-baseline pressures. Analyzing the effects of the pressure changes it is possible to infer interactions between the pressure effects13. These represent how the effects of one pressure depend on the level of the other pressure. For example, how the effects of changing IOP vary depending on the level of ICP, and vice-versa. For visualization, but not for analysis, the images were processed to improve brightness and contrast using previously reported algorithms, and contour levels of strain masked using OCT-based intensity masking14. Image processing, visualization and analysis were done using open source software (ITK15, Fiji16, Paraview17, and R18).
3. RESULTS
Images of the lamina cribrosa region were obtained at all combinations of IOP and ICP. The images show the pore and trabecular structure traditionally defined as the lamina cribrosa (Figure 1c–d), with the usual blood vessel “shadowing” occluding parts of the lamina cribrosa, but with the majority of the lamina trabecular structure still clearly distinguishable. Our digital image correlation technique produced an excellent match between images with overlapping regions of lamina beams and pores after registration (Figure 4).
Figure 4.
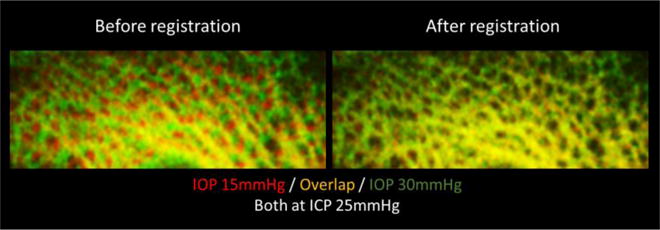
Example green/yellow/red plots showing no match before registration (Left column), but excellent match after registration (Right column) with our digital image correlation technique. Note how variations in image intensity between scans cause local red and green “hot-spots”.
The effects of both pressures were highly localized, nonlinear, and non-monotonic (Figure 5). The pressure changes caused tissue stretch and compression sometimes exceeding 20%. At baseline ICP of 10mmHg, increasing IOP from 15 to 30mmHg caused more stretch but less compression than increasing IOP from 5 to 15mmHg (Figure 5). At baseline ICP, some regions of the lamina cribrosa were not stretched as IOP increased from 5 to 15mmHg, but suffered up to 10% stretch when IOP increased from 15 to 30mmHg (Figure 5a, orange boxes). In contrast, some other regions of the lamina cribrosa suffered stretches up to 15–20% when IOP increased from 5 to 15mmHg, but these stretches were roughly 10% when IOP increased from 15 to 30mmHg (Figure 5a, blue boxes). At baseline IOP of 15mmHg, increasing ICP resulted in much higher compression in the lamina cribrosa than stretch (Figure 5b). For changes in ICP: increasing ICP from 10 to 25 mmHg caused less stretch and more compression than increasing ICP from 3 and 10 mmHg.
Figure 5.
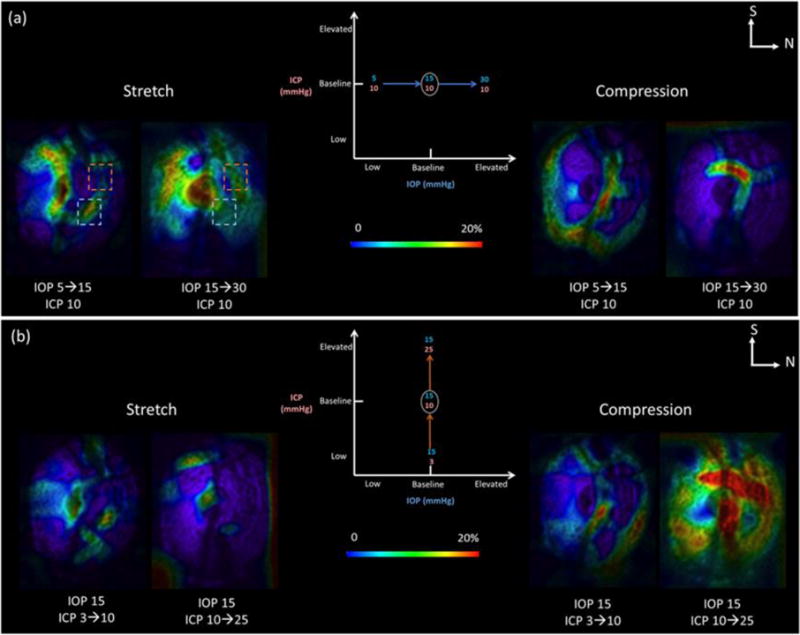
Effects of increases in IOP at baseline ICP (a) or in ICP at baseline IOP (b). For either IOP or ICP, three scans were analyzed at low, baseline and elevated pressures. This produced two maps of pressure change: from the low to the baseline pressure and between the baseline and the elevated pressure. We computed maps of local pressure-induced tissue stretch and compression. In this figure we show C-mode cross sections at the lamina cribrosa colored according to the magnitude of tissue stretch (Left) and compression (Right). The pressure effects were non-linear (blue rectangle) and non-monotonic (orange rectangle). N: nasal. S: superior.
Considering all seven pressure conditions analyzed (Figure 2), increases in IOP caused larger tissue stretch than compression, whereas increases in ICP caused larger compression than stretch. Changes between baseline and elevated pressures were larger than between low and baseline pressures. There were strong interactions between the effects of IOP and ICP on lamina deformations (Figure 6). For example, 15mmHg of increase in IOP induced more stretch in the lamina at elevated ICP than those at baseline ICP (Figure 6, I-I′). In contrast, 10mmHg of increase in ICP induced more stretch in the lamina at baseline IOP than at elevated IOP (Figure 6, II-II′).
Figure 6.
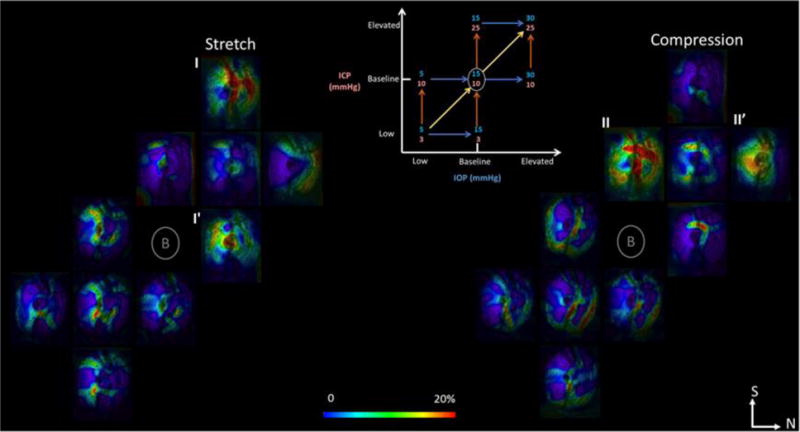
Mapping of lamina cribrosa deformations resulting from in vivo variations in intraocular (IOP) and/or intracranial (ICP) pressures obtained with our digital image correlation technique. Shown are C-mode sections of the scans at the lamina cribrosa colored by the magnitude of the tissue stretch (left) or compression (right). Seven IOP and ICP combinations were studied following the diagram in the top center. For each of the pressure change arrows in the diagram there are corresponding maps of stretch and compression. There were strong interactions between the effects of IOP and ICP. I, I′, II, II′ denote examples of strong interactions between IOP and ICP effects. N: nasal. S: superior.
4. DISCUSSIONS AND CONCLUSIONS
Our goal was to introduce a technique for measuring directly lamina cribrosa deformations in-vivo, and to apply this technique to study the interplay between IOP and ICP effects on the optic nerve head. We utilized a nonhuman primate animal model with images of the lamina cribrosa captured with OCT at controlled combinations of IOP and ICP.
The main result of this work is that we have demonstrated that it is possible to measure in-vivo deformations of the lamina cribrosa caused by controlled variations in IOP and ICP. We have shown that variations in IOP and/or ICP can cause highly localized, non-linear and non-monotonic deformations. In the animal studied, mechanical insult induced by the pressure changes reached very high levels, sometimes up to 20%. This is important because such changes have the potential to cause focal neural tissue damage in the short term, and perhaps trigger remodeling of the connective tissues in the longer term19,20. We have demonstrated that our digital image correlation technique originally developed for the study of multiphoton images also produces excellent registration of OCT images.
IOP and ICP had different effects on the lamina cribrosa, with these effects interacting strongly with each other. In other words, the effects of IOP were different depending on the level of ICP, and the effects of ICP varied with the level of IOP. In the animal studied in this work, increases in IOP caused primarily tissue stretch, whereas increases in ICP caused primarily tissue compression. Decreases in either IOP or ICP below the baseline caused smaller effects that were also highly variable. We also noticed that the locations of largest stretch and compression also varied depending on the pressure changes. Depending on the specific pressure changes, and the levels of IOP and ICP, different regions of the lamina cribrosa would be subjected to various levels of stretch and compression. These results are important because they suggest that the effects of IOP and ICP are highly complex, affecting different aspects of the lamina cribrosa, potentially representing different paths for neural tissue damage. IOP and ICP did not balance each other, and instead interact in complex ways that must be better understood.
The highly localized deformations observed are consistent with previous experimental studies and high-resolution numerical models9,21–23. Our previous study in human eyes ex-vivo demonstrated that IOP increases at multiple levels from 10 to 50mmHg induced large and localized stretch and compression up to 20–30%9. In an in-vivo study, Strouthidis and colleagues found that IOP increase from 10 to 45mmHg in a rhesus macaque monkey model deformed the lamina cribrosa to be significantly deeper, from 24 μm to 48μm or 50%22. Their methodology, however, did not allow calculation of local tissue stretch or compression. Using a tracking technique, Girard and colleagues have demonstrated that the decreases in IOP caused by trabeculectomy are sometimes associated with relatively large deformations of the tissues of the optic nerve head and lamina cribrosa24. In some eyes, the decreases in IOP caused much smaller deformations of the lamina cribrosa. Our results in this work suggest that this could be due to differences in ICP, in addition to the postulated differences in tissue mechanical properties24.
An important strength of our study is that it was carried out in vivo. This means that our measurements incorporate potentially critical factors not possible in ex-vivo work, such as vascular and orbit pressures, and the effects of muscles (although these are somewhat reduced due to the use of the paralyzing agents). Further, our measurements in this work do not suffer from potential artifacts like tissue deterioration or loss of hydration that affect ex-vivo work. Another advantage was our use of a non-human primate model, which is generally recognized to be the model closest to humans25. Many previous studies of IOP or ICP effects have been done in non-primate models, such as dog, rat, or pig3,26–28. This is particularly problematic for animal models that do not have a collagenous lamina cribrosa, and which may therefore not have the same biomechanical response to variations in pressure. Similarly, physiologic ICP gradients in dogs, rabbits and other species are likely to be different from those of humans as they do not maintain a vertical position, like humans do.
Another strength of our work is that we acquired full 3D volumes of the optic nerve head. This was possible due to the high-speed and light penetration of the scanner. Without full volumes, it is impossible to visualize the detail of the lamina cribrosa pores and beams, and measurements are less detailed. Our use of 3D volumes, however, has to be weighed with an important limitation of this work: the analysis was done utilizing 2D C-mode sections. Even though we spent a considerable amount of time obtaining corresponding sections, if the deformations are 3D, this will be imperfect. We are currently working to extend the image analysis to 3D volumes. Nevertheless, we point out that recent studies of ex-vivo lamina cribrosa mechanics utilizing synchrotron12 or multiphoton imaging29, found that 2D and 3D analyses produced essentially the same results. Note also that techniques studying lamina cribrosa that us sets of B-scans and not volumes are also limited in the ability to capture 3D deformations. Another important limitation of this preliminary work is that we have presented measurements of a single animal. While this is sufficient as a proof of principle and as technique demonstration, the results should not be generalized until more animals have been studied. Inter-individual differences in sensitivity to IOP have been shown to be large9,29,30.
In summary, we have demonstrated a technique for imaging and measuring in-vivo the interplay of the effects of IOP and ICP on the lamina cribrosa. We have shown that variations in either pressure can cause substantial stretch and compression of the tissues of the lamina cribrosa, sometimes up to 20%. These deformations were highly focal, non-linear and non-monotonic. There were strong interactions on the effects of IOP and ICP, suggesting that the simple difference between these pressures, the so-called trans-lamina pressure difference, is unlikely to be a good measure of their effect. Future applications of this technique will aid in understanding the sensitivity of the neural tissues of the eye to IOP and ICP and the susceptibility to neural tissue damage and vision loss. This will, in turn, be used to develop improved methods for diagnosis and treatment of glaucoma.
Acknowledgments
This work was supports by grants R01-EY023966, R01-EY025011, R01-EY013178, P30-EY008098 from the NIH.
References
- 1.Quigley HA. Glaucoma. Lancet. 2011;377(9774):1367–1377. doi: 10.1016/S0140-6736(10)61423-7. [DOI] [PubMed] [Google Scholar]
- 2.Howell GR, Libby RT, Jakobs TC, Smith RS, Phalan FC, Barter JW, Barbay JM, Marchant JK, Mahesh N, et al. Axons of retinal ganglion cells are insulted in the optic nerve early in DBA/2J glaucoma. J Cell Biol. 2007;179(7) doi: 10.1083/jcb.200706181. [DOI] [PMC free article] [PubMed] [Google Scholar]
- 3.Morgan WH, Chauhan BC, Yu DY, Cringle SJ, Alder Va, House PH. Optic disc movement with variations in intraocular and cerebrospinal fluid pressure. Invest Ophthalmol Vis Sci. 2002;43(10):3236–3242. [PubMed] [Google Scholar]
- 4.Morgan WH, Yu DY, Balaratnasingam C. The role of cerebrospinal fluid pressure in glaucoma pathophysiology: the dark side of the optic disc. J Glaucoma. 2008;17(5):408–413. doi: 10.1097/IJG.0b013e31815c5f7c. [DOI] [PubMed] [Google Scholar]
- 5.Yang D, Fu J, Hou R, Liu K, Jonas JB, Wang H, Chen W, Li Z, Sang J, et al. Optic Neuropathy Induced by Experimentally Reduced Cerebrospinal Fluid Pressure in Monkeys. Invest Ophthalmol Vis Sci. 2014;55(5):3067–3073. doi: 10.1167/iovs.13-13657. [DOI] [PubMed] [Google Scholar]
- 6.Berdahl JP, Fautsch MP, Stinnett SS, Allingham RR. Intracranial pressure in primary open angle glaucoma, normal tension glaucoma, and ocular hypertension: a case-control study. Invest Ophthalmol Vis Sci. 2008;49(12):5412–5418. doi: 10.1167/iovs.08-2228. [DOI] [PMC free article] [PubMed] [Google Scholar]
- 7.What is IH? Intracranial Hypertens Res Found. < http://ihrfoundation.org/hypertension/info/C16> (19 January 2017)
- 8.Glass DH, Roberts CJ, Litsky AS, Weber PA. Investig Opthalmology Vis Sci. 9. Vol. 49. The Association; for Research in Vision and Ophthalmology: 2008. A Viscoelastic Biomechanical Model of the Cornea Describing the Effect of Viscosity and Elasticity on Hysteresis; p. 3919. [DOI] [PubMed] [Google Scholar]
- 9.Sigal IA, Grimm JL, Jan NJ, Reid K, Minckler DS, Brown DJ. Eye-Specific IOP-Induced Displacements and Deformations of Human Lamina Cribrosa. Invest Ophthalmol Vis Sci. 2014;55(1):1–15. doi: 10.1167/iovs.13-12724. [DOI] [PMC free article] [PubMed] [Google Scholar]
- 10.Lucy KA, Wang B, Ishikawa H, Bilonick RA, Ling Y, Grulkowski I, Liu JJ, Fujimoto JG, Wollstein G, et al. Invest Ophthalmol Vis Sci. 7. Vol. 56. The Association; for Research in Vision and Ophthalmology: 2015. Pre-laminar tissue thickness measurably affects the visualization of the lamina cribrosa (LC) pp. 1312–1312. [Google Scholar]
- 11.Sigal IA, Wang B, Strouthidis NG, Akagi T, Girard MJA. Br J Ophthalmol. Suppl 2. Vol. 98. BMJ Group; 2014. Recent advances in OCT imaging of the lamina cribrosa; pp. ii34–9. (Suppl 2) [DOI] [PMC free article] [PubMed] [Google Scholar]
- 12.Coudrillier B, Geraldes DM, Vo NT, Atwood R, Reinhard C, Campbell IC, Raji Y, Albon J, Abel RL, et al. Phase-Contrast Micro-Computed Tomography Measurements of the Intraocular Pressure-Induced Deformation of the Porcine Lamina Cribrosa. IEEE Trans Med Imaging. 2016;35(4):988–999. doi: 10.1109/TMI.2015.2504440. [DOI] [PMC free article] [PubMed] [Google Scholar]
- 13.Sigal IA. Interactions between geometry and mechanical properties on the optic nerve head. Invest Ophthalmol Vis Sci. 2009;50(6):2785–2795. doi: 10.1167/iovs.08-3095. [DOI] [PubMed] [Google Scholar]
- 14.Jan NJ, Grimm JL, Tran H, Lathrop KL, Wollstein G, Bilonick RA, Ishikawa H, Kagemann L, Schuman JS, et al. Biomed Opt Express. 12. Vol. 6. Optical Society of America; 2015. Polarization microscopy for characterizing fiber orientation of ocular tissues; pp. 4705–4718. [DOI] [PMC free article] [PubMed] [Google Scholar]
- 15.Yoo TS, Ackerman MJ, Lorensen WE, Schroeder W, Chalana V, Aylward S, Metaxas D, Whitaker R. Engineering and algorithm design for an image processing API: A technical report on ITK - The Insight Toolkit. Stud Health Technol Inform. 2002;85:586–592. [PubMed] [Google Scholar]
- 16.Schindelin J, Arganda-Carreras I, Frise E, Kaynig V, Longair M, Pietzsch T, Preibisch S, Rueden C, Saalfeld S, et al. Nat Methods. 7. Vol. 9. Nature Publishing Group, a division of Macmillan Publishers Limited; 2012. Fiji: an open-source platform for biological-image analysis; pp. 676–682. All Rights Reserved. [DOI] [PMC free article] [PubMed] [Google Scholar]
- 17.Hansen C, Johnson C. The Visualization Handbook, Vis. Handb. 2004 [Google Scholar]
- 18.R Development Core Team. R: A Language and Environment for Statistical Computing. Vienna, Austria: the R Foundation for Statistical Computing, R Foundation for Statistical Computing; 2011. [Google Scholar]
- 19.Hernandez MR. The optic nerve head in glaucoma: role of astrocytes in tissue remodeling. Prog Retin Eye Res. 2000;19(3):297–321. doi: 10.1016/s1350-9462(99)00017-8. [DOI] [PubMed] [Google Scholar]
- 20.Grytz R, Sigal IA, Ruberti JW, Meschke G, Downs JC. Lamina Cribrosa Thickening in Early Glaucoma Predicted by a Microstructure Motivated Growth and Remodeling Approach. Mech Mater. 2012;44:99–109. doi: 10.1016/j.mechmat.2011.07.004. NIH Public Access. [DOI] [PMC free article] [PubMed] [Google Scholar]
- 21.Roberts MD, Liang Y, Sigal IA, Grimm J, Reynaud J, Bellezza A, Burgoyne CF, Downs JC. Invest Ophthalmol Vis Sci. 1. Vol. 51. Association for Research in Vision and Ophthalmology; 2010. Correlation between local stress and strain and lamina cribrosa connective tissue volume fraction in normal monkey eyes; pp. 295–307. [DOI] [PMC free article] [PubMed] [Google Scholar]
- 22.Strouthidis NG, Fortune B, Yang H, Sigal IA, Burgoyne CF. Effect of acute intraocular pressure elevation on the monkey optic nerve head as detected by spectral domain optical coherence tomography. Invest Ophthalmol Vis Sci. 2011;52(13):9431–9437. doi: 10.1167/iovs.11-7922. [DOI] [PMC free article] [PubMed] [Google Scholar]
- 23.Voorhees AP, Jan NJ, Flanagan JG, Sivak JM, Sigal IA. A Microstructure Based Model of Lamina Cribrosa Mechanical Insult under IOP. Assoc Res Vis Ophthalmol. 2016;57(12) [Google Scholar]
- 24.Girard MJA, Beotra MR, Chin KS, Sandhu A, Clemo M, Nikita E, Kamal DS, Papadopoulos M, Mari JM, et al. In Vivo 3-Dimensional Strain Mapping of the Optic Nerve Head Following Intraocular Pressure Lowering by Trabeculectomy. Ophthalmology. 2016;123(6):1190–1200. doi: 10.1016/j.ophtha.2016.02.008. [DOI] [PubMed] [Google Scholar]
- 25.Burgoyne CF. The non-human primate experimental glaucoma model. Exp Eye Res. 2015;141:57–73. doi: 10.1016/j.exer.2015.06.005. [DOI] [PMC free article] [PubMed] [Google Scholar]
- 26.Urcola JH, Hernández M, Vecino E. Three experimental glaucoma models in rats: comparison of the effects of intraocular pressure elevation on retinal ganglion cell size and death. Exp Eye Res. 2006;83(2):429–437. doi: 10.1016/j.exer.2006.01.025. [DOI] [PubMed] [Google Scholar]
- 27.Zhao D, He Z, Vingrys AJ, Bui BV, Nguyen CTO. The effect of intraocular and intracranial pressure on retinal structure and function in rats. Physiol Rep. 2015;3(8):e12507. doi: 10.14814/phy2.12507. [DOI] [PMC free article] [PubMed] [Google Scholar]
- 28.Ostrin LA, Wildsoet CF. Optic nerve head and intraocular pressure in the guinea pig eye. Exp Eye Res. 2016;146:7–16. doi: 10.1016/j.exer.2015.12.007. [DOI] [PMC free article] [PubMed] [Google Scholar]
- 29.Midgett DE, Pease ME, Quigley HA, Patel M, Franck C, Nguyen TD. Mechanics of Biological Systems and Materials. Springer, Cham; 2017. Regional Variations in the Mechanical Strains of the Human Optic Nerve Head; pp. 119–127. [Google Scholar]
- 30.Girard MJa, Strouthidis NG. Desjardins A. Mari JM. Ethier CR In vivo optic nerve head biomechanics : performance testing of a three-dimensional tracking algorithm. J R Soc Interface. 2013;10(87) doi: 10.1098/rsif.2013.0459. [DOI] [PMC free article] [PubMed] [Google Scholar]


