

Abstract
Despite favorable responses to initial therapy, SCLC relapse occurs within a year exhibiting a multidrug resistant phenotype. Due to limited accessibility of patient tissues for research purpose, SCLC patient derived xenografts (PDXs) have provided the best opportunity to address this limitation. We sought to identify novel mechanisms involved in SCLC chemoresistance. Through in-depth proteomic profiling, we identified MCAM as a markedly upregulated surface receptor in chemoresistant SCLC cell lines that exhibited a mesenchymal phenotype and in chemoresistant PDXs compared to matched treatment-naïve tumors. MCAM is a cell membrane protein whose expression has been implicated in multiple human cancers. MCAM expression is also detected in lung adenocarcinoma; however, its expression and role in SCLC is has not been explored. MCAM knockdown in chemoresistant cells reduced cell proliferation and decreased the IC50 inhibitory concentration of chemotherapeutic drugs. MCAM was found to modulate sensitivity of SCLC cells to chemotherapeutic drugs through up-regulation of MRP1/ABCC1 expression and of the PI3/AKT pathway in a SOX2-dependent manner. Metabolomic profiling revealed that MCAM modulates lactate production in chemoresistant cells that exhibit a distinct metabolic phenotype characterized by low oxidative phosphorylation. MCAM may serve as a novel therapeutic target to overcome chemoresistance in SCLC.
Keywords: Small cell lung cancer, Chemoresistance, Proteomics, MCAM, EMT, SOX2, PI3K, AKT, CREB1, patient derived xenograft
Introduction
Small cell lung cancer (SCLC) is an aggressive and highly metastatic lung cancer subtype, accounting for about 10–20% of lung cancer cases (1,2). The 5-year survival rate has remained dismal at 7% and systemic treatment options for patients with SCLC have remained unchanged (3). Standard first-line treatment of SCLC includes cisplatin or carboplatin in combination with etoposide, cyclophosphamide, vincristine, or doxorubicin, which leads to complete remission in a vast majority of patients (4). SCLC is highly responsive to chemotherapy at the start of treatment. However, relapse and resistance to treatment eventually contributes strongly to poor prognosis.
Established mechanisms of chemoresistance in cancer include cellular pathways associated with DNA damage and repair, apoptosis, NOTCH signaling and FGFR signaling (5,6). Agents targeting these pathways that have shown promise for other tumor types have been investigated in SCLC without demonstrable clinical benefit (7). Consequently, there is a need to elucidate novel molecular mechanisms involved in chemoresistance in SCLC. Limited translational success is largely attributed to the lack of sufficient tumor materials from SCLC patients. Additionally, data on SCLC in public databases such as TGCA or oncomine is sparse. SCLC patient derived xenografts (PDXs) have provided the best opportunity to address the above mentioned limitations as PDXs replicate the biology and clinical properties of the original patients’ tumors as compared to other animal models (8).
A comprehensive map of the actual proteome in SCLC, in particular chemoresistant phenotype is still needed. Herein, for the first time we have investigated mechanisms of SCLC chemoresistance with a focus on the cell surface proteins. We initially compared the proteomic and metabolomic profiles of SCLC cell lines to identify molecular features associated with chemoresistance. MCAM was identified as a markedly overexpressed protein in SCLC chemoresistants as well as patient tumors. MCAM is a cell adhesion molecule initially identified as melanoma-specific cell-adhesion molecule (9). MCAM is also involved in several cellular processes including cell invasion, migration, angiogenesis, epithelial mesenchymal transition, immune response, and signal transduction (10). Additionally, MCAM has low expression levels in normal tissue, primarily restricted at intracellular junctions of endothelial cells (10,11). Previous studies have shown differential expression of MCAM in primary tumors correlated with metastasis and poor prognosis in several cancers, showing its significant potential in cancer therapy (12–14). Despite the identification of MCAM expression in the lung adenocarcinoma (13), its expression and role in SCLC has not been reported yet. We further investigated the effect of MCAM through knockdown experiments and the consequences of its overexpression on SCLC chemoresistance and cellular functions.
Materials and Methods
Cell lines and treatment
The human SCLC cell lines H69, H82, DMS79, H209 and H196, H69AR were obtained from the American Type Culture Collection in 2011 and 2014 respectively. All cells grew in RPMI 1640 with 10% fetal bovine serum and a 1% penicillin/streptomycin cocktail. For stable isotope labeling with amino acids in cell culture. Cells were allowed to grow for seven passages in RPMI 1640 supplemented with 13C-lysine and 10% dialyzed fetal bovine serum according to a standard protocol (15). Cell lines were cultured continuously for 6 months or less. Cell lines were validated at the MD Anderson Sequencing and Microarray Facility using short-tandem repeat DNA fingerprinting and routinely checked for mycoplasma by PCR (PromoKine). Cells were treated with 10 nM phosphoinositide 3-kinase (PI3K) inhibitor LYS294002 (Cell Signaling Technology) for 24 hours. Accumulation of lactate in the cell culture was determined using lactate assay kit II (Sigma-Aldrich, MAK065) according to the manufacturer's protocol.
Mass spectrometry and metabolomic analysis
Proteomic analysis of total cell extract (TCE) and cell surface proteins from SCLC cell lines was performed using mass spectrometry as previously described (16). For metabolomic profiling all samples were run in biological triplicates. Approximately 7.5 × 10⁵ cells were seeded 24 hours prior to metabolite extraction in 6 cm dishes. On day of extraction, cells were washed twice with ice-cold 0.9% NaCl, extracted with 1mL of ice-cold 3:1 isopropanol/water mixture containing 50ng/mL internal standard (12-[[(cyclohexylamino)carbonyl]amino]-dodecanoic acid (CUDA), Cayman Chemical), and dried using a centrifugal evaporator. Upon dryness, samples were reconstituted in 50:50 methanol/water. Untargeted metabolomics analysis was conducted on a Waters Acquity™ UPLC system coupled to Xevo G2-XS quadrupole time-of-flight (qTOF) mass spectrometer. LC-MS and LC-MSe data were processed using Progenesis QI (Nonlinear, Waters), and values were reported as area units. Details are provided in the Supplementary Methods.
Patient tumor collection and generation of chemoresistant PDX models
Fresh SCLC cells from endobronchial ultrasound-guided transbronchial needle aspiration (EBUS-TBNA) were obtained from the patients diagnosed with SCLC in The Kinghorn Cancer Centre, New South Wales, Australia with informed, written consent in accordance with the policies of the National Health and Medical Research Council of Australia, Monash Health, Melbourne Health and the Declaration of Helsinki. In brief, one million SCLC cells obtained from each of 11 chemonaïve SCLC patients were centrifuged, washed, and resuspended in 50 μL of RPMI medium. Cells were then added to 50 μL of Matrigel (BD Biosciences), gently mixed, and kept on ice. The resulting cell suspension was injected subcutaneously into the right flanks of nude Balb/c mice to generate PDXs. The mice were monitored daily until palpable tumors appeared (typically 4 weeks). Tumors were measured daily using digital calipers to record the longest (l) and shortest (s) dimensions in millimeters. The following equation was used to calculate the tumor volume: Tumor volume = l × s2/2.
Once tumors reached 200 mm3, mice were given single intraperitoneal injections of 60 mg/kg carboplatin. SCLC xenografts responded rapidly to this initial carboplatin-based treatment, becoming barely palpable within 10 days. Relapse of SCLC took 50-81 days. Upon tumor relapse in two PDX models, an additional 60 mg/kg injection of carboplatin was administered to both when the tumors reached 200 mm3. Per national health and medical research council ethical guidelines, a maximum of three doses of carboplatin was injected per mouse. After the third injection of carboplatin, tumors exhibited little or no shrinkage and minor growth delays in response to the treatment, suggesting that they were resistant to it. Mice were then euthanized and harvested tumors were formalin fixed for paraffin embedding.
Proliferation and colony formation assays
For proliferation assays, 8 × 10³ SCLC cells were seeded in triplicate and assayed using MTS reagent (CellTiter 96 Aqueous One Solution Cell Proliferation Assay; Promega). For colony formation assays, 200 cells were seeded in six-well plates in triplicate and allowed to grow for 20 days. Cells were fixed in 6% glutaraldehyde with 0.5% crystal violet and visualized under the Nikon microscope. Colony areas were measured using the ImageJ software program.
In vitro drug sensitivity assay
SCLC cells were seeded in 96-well plates at a density of 1 × 10⁴ cells per well and treated in medium with doxorubicin, cisplatin, or etoposide for 24 hours. Cell survival was analyzed using a CellTiter Glo assay (Promega) according to the manufacturer’s instructions. The range of drug concentrations was chosen to obtain half-maximal inhibitory concentrations (IC50) values for SCLC cell lines. After incubation with 100 μL of CellTiter Glo reagent for 10 minutes, the luminescence was measured. Luminescence reading from the cells incubated without the drugs were used for 100% survival and to calculate the IC50 of each drug. The data for CellTiter Glo assay was collected from five technical and three biological replicates for each sample.
Flow cytometric analysis
SCLC cells were treated with doxorubicin, cisplatin, or etoposide for 24 hours and then collected for apoptosis and cell-cycle analyses. For annexin V analysis, cells were incubated with annexin V-fluorescein isothiocyanate and propidium iodide (PI) for 15 minutes at room temperature in the dark. Samples stained with annexin V-fluorescein isothiocyanate and PI were diluted in 400 μL of annexin V-binding buffer and immediately examined using a fluorescence-activated cell sorting machine. Stained cells were immediately subjected to flow cytometric analyses using a Gallios flow cytometer (Beckman Coulter). Early apoptotic cells were defined as cells with annexin V-positive and PI-negative staining. Late apoptotic and nonviable cells were defined as having both annexin V-positive and PI-positive staining.
For cell-cycle analysis, SCLC cells were fixed with 70% (vol/vol) cold ethanol overnight at 4°C. Cells were then suspended in phosphate-buffered saline buffer containing final concentrations of 20 μg/mL RNase A and 20 μg/mL PI for 20 minutes. The cell-cycle profiles for these cells were determined using flow cytometry (Gallios; Beckman Coulter) and analyzed using the Kaluza software program (Beckman Coulter). All samples were assayed in triplicate.
Immunohistochemistry
The paraffin embedded PDX tissues sections (5μm) on glass slides were deparaffinized and hydrated, and antigen retrieval was performed using a decloaker with a target retrieval solution (pH, 6.0; Dako). The intrinsic peroxidase activity was blocked using 3% methanol and hydrogen peroxide for 10 minutes, and a serum-free protein block (Dako) was used for 5 minutes to block nonspecific antibody binding. The slides were then incubated with antibodies against human MCAM (ab75769, 1:200 dilution; Abcam), EGFR (ab52894, 1:100, Abcam), EPHA2 (#6997, 1:200, Cell Signaling), ITGB1 (ab52971, 1:250, Abcam) and JAG1 (ab109536, 1:100, Abcam) overnight at 4°C. After being washed three times in Tris-buffered saline, the slides were then incubated for 30 minutes with Dako EnVision+ Dual Link at room temperature. Slides were incubated with Dako chromogen substrate for 5 minutes and counterstained with hematoxylin. Formalin-fixed, paraffin-embedded, whole-section specimens with the primary antibodies omitted were used as negative controls.
Mathematical modeling for regulation of MCAM
We developed a mathematical model that incorporates the regulations among MCAM, SOX2, PI3K, and CREB1 and their association with chemoresistance.
Oxygen consumption rate measurement
Oligomycin, an inhibitor of ATP synthase, was prepared from 1000× stock at a concentration of 10 mM in dimethyl sulfoxide (DMSO). FCCP, an ionophore and strong mitochondrial depolarizer, was prepared from 1,000 × stock at a concentration of 5 mM in DMSO. Rotenone, a potent inhibitor of mitochondrial complex I, and antimycin A, a strong suppressor of mitochondrial complex III, were solubilized from 1,000 × stock solutions at concentrations of 10 mM in DMSO. To measure SCLC-cell oxygen consumption rates (OCRs), 6 × 10⁴ cells from each cell line were seeded into each well of an XF96 microplate 16 hours before the experiment. Immediately before the OCR measurement, culture medium of the cells was replaced by an assay medium (low-buffered RPMI containing 25 mM D-glucose, 1 mM sodium pyruvate, and 1 mM L-glutamine) and incubated for 1 hour at 37°C. The OCR in the cells were measured using an Extracellular Flux Analyser (Seahorse Biosciences). After baseline measurements of OCR the inhibitors described above prepared in the assay medium were sequentially injected into each well to reach the final working 1× concentrations. After 5 minutes of incubation to expose cancer cells equally to chemical inhibitors, the OCR was measured again. Data were analyzed using the Seahorse XF software program. The OCR was reported in pmol min−1, and measurements were normalized according to the final cell number.
Statistical analysis
All bar and line graphs represent means and standard deviations. The error bars in OCR line graphs are standard deviations. The unpaired t-test was used to compare differences between two groups. For comparison of more than two groups, one-way Analysis Of Variance (ANOVA) was used. A P value less than 0.05 was considered statistically significant. Data were analyzed using the Prism software program (GraphPad Software) unless otherwise stated. All experiments were independently repeated at least three times.
Supplementary Data
Supplementary Data includes supplementary methods, five figures, and two tables.
Results
Increased MCAM expression in chemoresistant SCLC
In-depth proteomic multi-compartment profiling was performed to quantify proteomic changes associated with chemoresistance of SCLC cells (Fig. 1A). We used H69 and H69AR as a paired SCLC chemosensitive and chemoresistant cell line. Metastasis and chemoresistance in cancer are linked phenomena (17), hence we used H82 representing a metastatic SCLC cell line. We also used DMS79, a SCLC cell line established from the tumor cells of a patient who had undergone chemotherapeutic and radiation treatment, as assumed to be a surviving fraction of primary SCLC cells and may possess some similarities to chemoresistant cells. In total, we quantified 3,605, 3,574, 3,205, and 3,211 proteins in total cell extracts (TCE) and 2,852, 1,884, 1,981, and 2,344 proteins on the surface of the H69, H82, DMS79, and H69AR cell lines, respectively (Supplementary Table 1).
Figure 1. MCAM in SCLC chemoresistant cells.
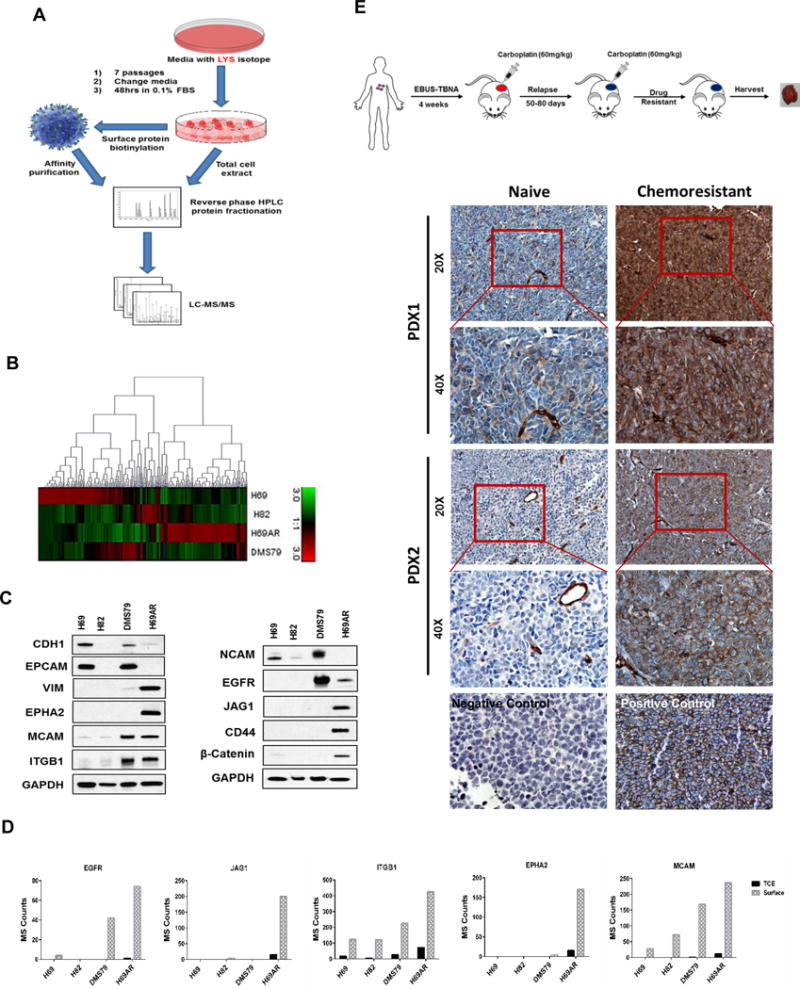
A) Schematic diagram of the proteomics workflow. B) Heatmap cluster of SCLC cell line surface proteins in H69AR compared to other SCLC cell lines. C) Immunoblot of differentially expressed proteins on cell surface of H69AR compared to other SCLC cell lines. D) Bar chart of Mass Spec (MS) counts for five most abundant cell surface receptors on H69AR compared to other SCLC cell lines. E) Schematic diagram of chemoresistant tumor formation in SCLC PDX models. Highly abundant expression of MCAM in chemoresistant compared to their respective naïve PDX tissues. Representative images of MCAM immunohistochemistry at 20× (scale bar is 100μm) and 40× (scale bar is 50μm) magnification.
Chemoresistant H69AR exhibited a highly distinct enriched cell surface proteome relative to other SCLC cell lines (Fig. 1B and Supplementary Table 2), marked by a high abundance of proteins associated with cytoskeletal reorganization as well as cell adhesion and PI3K/AKT-regulated pathways based on Ingenuity Pathway Analysis (Table 1 and Supplementary Fig. 1A). Differentially expressed surface proteins in H69AR relative to H69 cells were further assessed by immunoblotting (Fig. 1C). To narrow our list of candidate targets, we focused on cell surface receptors that exhibited the most robust differences between chemoresistant SCLC cells compared to other cell lines. Five surface membrane receptors (EGFR, JAG1, ITGB1, EPHA2, and MCAM) were found most highly expressed in chemoresistant SCLC cells compared to the other cell lines (Fig. 1D). We validated our results by immunoblotting in these SCLC cell lines also including H196, which has similar chemoresistant properties as of H69AR, and H209, which is chemosensitive to the chemotherapeutic drugs. Increased expression of H69AR surface enriched protein on DMS79 and H196 is in concordance to their higher IC50 values for chemotherapeutic drugs compared to H69, H82 and H209 (Fig. 1C and Supplementary Fig. 1B and 1C). We found that DMS79 and H196 closely related to H69AR, whereas H82 and H209 resembles H69 in terms of their surface protein expression. Next, we examined established PDXs derived from SCLC patients for expression of these receptors. The PDX models replicate the biology and clinical properties of the original patients’ tumors (8). We observed increased MCAM expression in chemoresistant tumors compared to matched treatment-naïve tumors (Fig. 1E and Supplementary Fig. 1D). We also observed increased MCAM expression as early as after two cycles of carboplatin (Supplementary Fig. 1E) in contrast with EGFR, JAG1, or ITGB1 which did not exhibit any difference in immunostaining between chemonaïve and chemoresistant tumors. EPHA2 was undetectable by immunostaining in any of the PDXs (Supplementary Fig. 1F).
Table 1.
Dysregulated pathways and their associated proteins in chemoresistant cells.
| Related pathways | Mass Spec Counts | ||||||
|---|---|---|---|---|---|---|---|
| Symbol | Gene name | Upregulated | H69AR | H69 | H82 | DMS79 | Fold change |
| ITGB1 | integrin, beta 1 | Integrin and PI3/AKT signaling | 242 | 89 | 86 | 144 | 2.73 |
| COL1A1 | collagen, type I, alpha 1 | PI3/AKT signaling | 221 | 0 | 0 | 8 | 22071.00 |
| EIF4A1 | eukaryotic translation initiation factor 4A1 | TGF-beta | 207 | 19 | 8 | 25 | 11.11 |
| RPL3 | ribosomal protein L3 | Infectious diseases | 148 | 0 | 0 | 9 | 14771.00 |
| COL1A2 | collagen, type I, alpha 2 | PI3/AKT signaling | 147 | 4 | 0 | 32 | 34.09 |
| MCAM | melanoma cell adhesion molecule | Cell adhesion | 135 | 20 | 51 | 107 | 6.73 |
| ATIC | IMP cyclohydrolase | Purine biosynthesis | 125 | 12 | 9 | 22 | 10.29 |
| LGALS1 | lectin, galactoside-binding, soluble, 1 | NF-kappaB and MAPK signaling | 116 | 3 | 0 | 3 | 40.34 |
| JAG1 | jagged 1 | Notch signaling | 114 | 0 | 3 | 0 | 11406.00 |
| EPHA2 | EPH receptor A2 | PI3/AKT signaling | 98 | 0 | 0 | 3 | 9752.00 |
| Downregulated | |||||||
| LMNB2 | lamin B2 | PI3-AKT signaling | 24 | 256 | 110 | 210 | 0.09 |
| NCAM1 | neural cell adhesion molecule 1 | Cell adhesion | 13 | 342 | 177 | 268 | 0.04 |
| SYNE2 | spectrin repeat containing, nuclear envelope 2 | Cell cycle | 10 | 115 | 1 | 122 | 0.08 |
| TGM2 | transglutaminase 2 | Phospholipase-C and CREB | 2 | 111 | 0 | 1 | 0.02 |
| CNTN1 | contactin 1 | Notch signaling | 1 | 323 | 88 | 0 | 0.00 |
| NCAM2 | neural cell adhesion molecule 2 | Cell adhesion | 0 | 106 | 0 | 6 | 0.00 |
| FLNB | filamin B, beta | MAPK signaling | 0 | 156 | 0 | 0 | 0.00 |
| ACTA1 | actin, alpha 1, skeletal muscle | AKT signaling | 0 | 160 | 0 | 0 | 0.00 |
| CES1 | carboxylesterase 1 | Xenobiotic metabolism | 0 | 174 | 0 | 3 | 0.00 |
| ALCAM | activated leukocyte cell adhesion molecule | Cell adhesion | 0 | 191 | 23 | 298 | 0.00 |
MAPK, mitogen-activated protein kinase; NF, nuclear factor; TGF, transforming growth factor.
MCAM expression is associated with a mesenchymal phenotype, increased proliferation and colony formation
MCAM expression was highly correlated with a mesenchymal transition related gene expression pattern in SCLC cell lines annotated in the Cancer Cell Line Encyclopedia database, (Supplementary Fig. 2A). Concordantly, we also observed altered expression of multiple epithelial-mesenchymal transition (EMT) markers, including reduced expression of CDH1 and NCAM and increased expression of VIM, CDH2, LGALS1, and COL1A1 (Fig. 2A) in H69AR cells. Interestingly, LGALS1 has also been reported as a ligand for MCAM in melanoma and endothelial cells (18,19). Ingenuity Pathway Analysis revealed Transforming growth factor β and ZEB1 as key upstream regulators of altered gene expression in chemoresistant cells (Supplementary Fig. 2B-D). Higher expression of the EMT regulators ZEB1 and TWIST1 in H69AR cells compared to H69 cells was confirmed by immunoblotting (Fig. 2B).
Figure 2. Effect of MCAM knockdown on SCLC chemoresistant cells with mesenchymal phenotype.
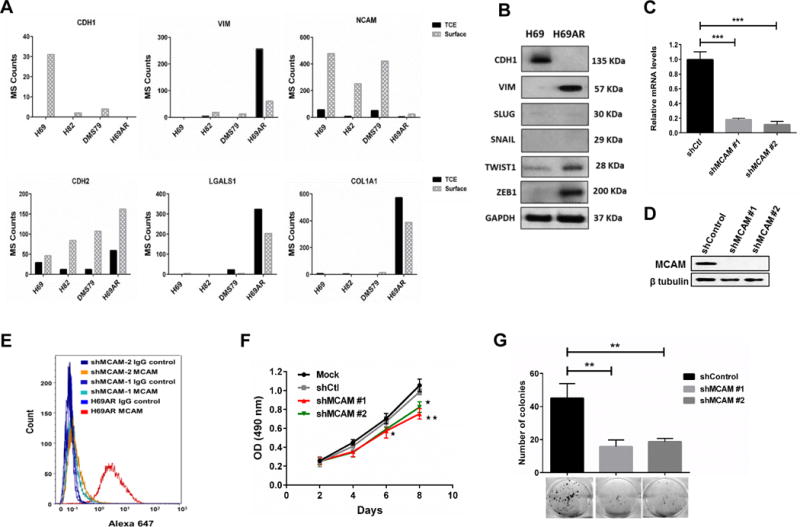
A) Bar chart for Mass Spec (MS) counts of mesenchymal related proteins in SCLC cell lines. B) Immunoblot for epithelial to mesenchymal transition related proteins and transcription factors. C and D) Knockdown efficiency of shRNAs for MCAM at transcriptional (C) and translational (D) levels Data were pooled from three biological replicates (n = 3). E) Highly efficient reduction of MCAM protein on cell surface after MCAM knockdown was observed using flow cytometry. F) Stable knockdown of MCAM statistically significantly (p < 0.01, ANOVA) reduced the cell proliferation in chemoresistant H69AR cells Data were pooled from three biological replicates (n = 3). G) H69AR cells statistically significantly (p < 0.01, unpaired t-test) lost their colony forming abilities after stable knockdown of MCAM. Colonies were stained with crystal violet. Error bars represent means ± SD from three biological replicates (n = 3). *p < 0.05, **p < 0.01, ***p < 0.001 vs. control shRNA group.
Knockdown of MCAM expression in chemoresistant cells using RNA interference had no effect on mesenchymal-related protein expression (Fig. 2C-E and Supplementary Fig. 3A-C). However, MCAM knockdown in chemoresistant cells significantly decreased cell proliferation (p < 0.001, ANOVA) (Fig. 2F and Supplementary Fig. 3D, 3E) and colony-forming rates (p < 0.01, unpaired t-test) (Fig. 2G).
MCAM expression is a determinant of SCLC chemoresistance and sensitivity
To determine the effects of MCAM expression on chemoresistance of SCLC cells, we treated shMCAM-H69AR cells with varying doses of chemotherapeutic drugs (doxorubicin, cisplatin, and etoposide). MCAM knockdown in chemoresistant cells increased chemosensitivity, with significant reductions (p < 0.001, ANOVA) in the IC50 and cell survival (Fig. 3A–3D and Supplementary Fig. 3F, 3G). Reduced MCAM expression led to a marked increase in apoptosis after chemotherapy as determined by flow cytometry (Fig. 3E). Immunoblotting was performed for proteins in the apoptotic pathway. Of note, expression of p-BAD, a pro-apoptotic protein, increased after MCAM knockdown. Additionally, cleaved caspase-3 markedly increased during chemotherapeutic treatment confirming an apoptotic mechanism (Fig. 3F). We also observed increased cell-cycle arrest at G0/G1 and G2/M after treatment with doxorubicin or cisplatin and etoposide, respectively, in shMCAM-H69AR compared to H69AR (Supplementary Fig. 4A-C).
Figure 3. Effect of MCAM knockdown on SCLC chemoresistance.
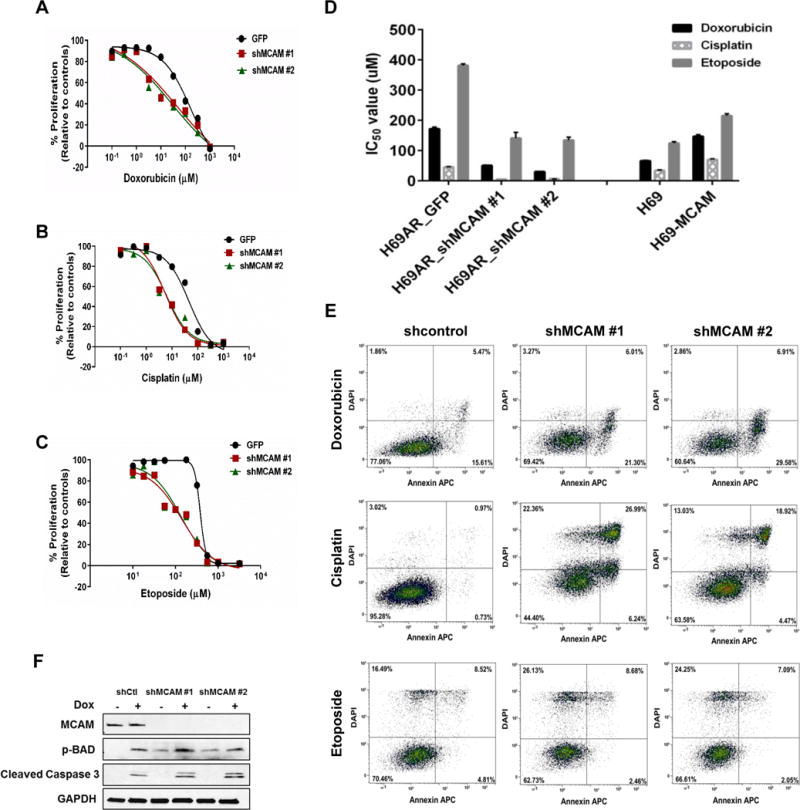
A-C) The cell proliferation rate were measured using CellTiter Glo assay. Data were pooled from three biological replicates (n = 3) Values are presented as percentage of cell proliferation in doxorubicin (A), cisplatin (B) and etoposide (C) treated and untreated cells. *P < 0.001 (one-way ANOVA; compared with corresponding negative control groups). D) Bar graph representing effect of MCAM modulation on drug sensitivity of SCLC cell lines. Data were pooled from three biological replicates (n = 3)). E) MCAM knockdown increased cell apoptosis in SCLC cells after chemotherapy (n = 3). Representative FACS profiles shown, on which cell population in the quadrant of Annexin V± DAPI represents apoptotic cells. F) Chemoresistant H69AR cells (parental and MCAM knockdown clones) were treated with doxorubicin (170 μM) for 24 hours, and cell lysates were immunoblotted for MCAM, pBAD and cleaved caspase 3.
To determine whether MCAM expression is sufficient to induce SCLC chemoresistance, we ectopically expressed MCAM in the chemosensitive H69 cell line. Overexpression of MCAM resulted in a slight increase in the cell proliferation, however this was not statistically significant (Fig. 4A–C and Supplementary Fig. 5A). MCAM overexpression resulted in markedly increased chemotherapeutic IC50 values and cell survival (Fig. 3D and 4D). These findings were corroborated by reductions in apoptosis and reduced cell cycle arrest at G0/G1 and G/2M following treatment with doxorubicin or cisplatin and etoposide, respectively (Fig. 4E and Supplementary Fig. 5B).
Figure 4. Effect of MCAM overexpression on SCLC chemoresistance.
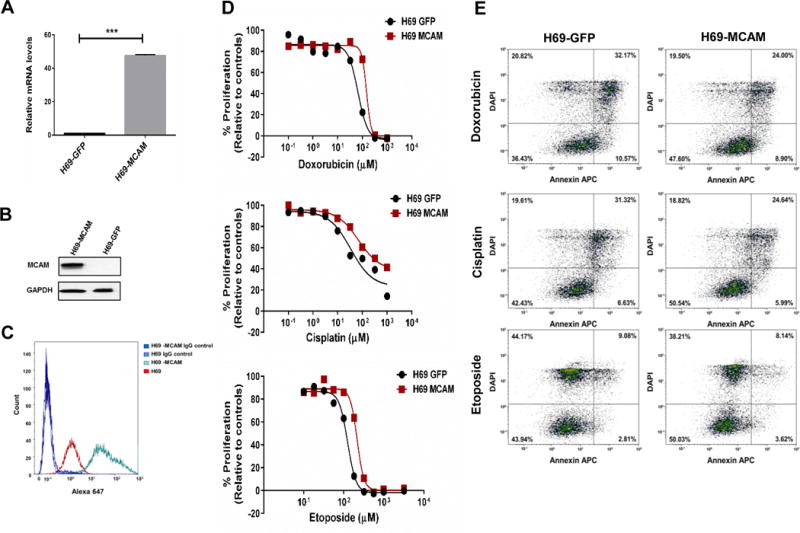
A and B) Efficient overexpression of MCAM in H69 cells both at transcriptional (A) and translational (B) level. Data were pooled from three biological replicates (n = 3) Error bars represent means ± SD; ***p < 0.001. C) Increased MCAM expression on cell surface after MCAM overexpression was confirmed by flow cytometry. D) The cell proliferation rate were measured using CellTiter Glo assay. Values are presented as percentage of cell proliferation in doxorubicin, cisplatin, etoposide-treated and untreated cells (n = 3). E) MCAM overexpression markedly decreased cell apoptosis in SCLC cells after chemotherapy. Representative FACS profiles are shown, on which cell population in the quadrant of Annexin V± DAPI represents apoptotic cells.
Regulation of MCAM via PI3K/AKT pathway in a SOX2/CREB1 dependent manner
PI3K/AKT signaling emerged as an upregulated pathway in chemoresistant SCLC cells (Table 1). We tested whether MCAM regulates PI3K/AKT activation. MCAM knockdown considerably reduced the activation state of PI3K/AKT pathway based on phosphoprotein analysis (Fig. 5A and Supplementary Fig. 4D). Moreover, inhibition of PI3K activity using LYS29004 markedly decreased MCAM expression suggesting a potential bidirectional regulation (Fig. 5B). MCAM expression is known to be regulated via CREB1 (20), and CREB1 activation is dependent on the AKT pathway (21). The gene for the transcription factor SOX2 is frequently amplified in SCLC (22) and its expression is also regulated via AKT (23). Hence, we examined the effect of SOX2 knockdown and PI3K inhibition on CREB1 and MCAM protein expression levels in chemoresistant SCLC cells. Both SOX2 inhibition and LYS29004 treatment reduced CREB1 and MCAM protein expression (Fig. 5C and 5D). However, CREB1 knockdown reduced MCAM but did not affect SOX2 expression (Fig. 5E).
Figure 5. Regulation of MCAM expression in SCLC chemoresistant cells.
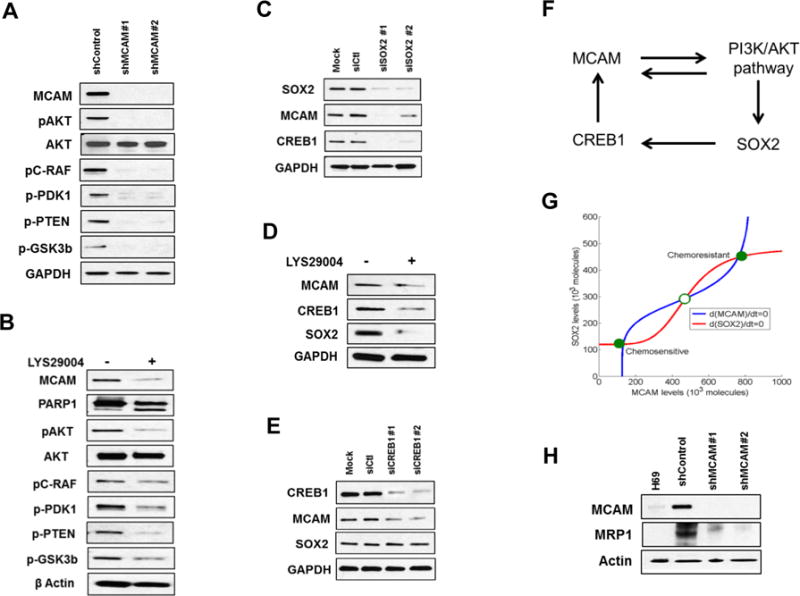
A and B) Lysates from H69AR cells treated with either shMCAM (A) or PI3K inhibitor LYS29004 for 24 hours (B) were immunoblotted with the indicated antibodies and revealed an inhibited PI3K/AKT pathway. C-E) Lysates from H69AR cells treated with siSOX2 for 72 hours (C), LYS29004 for 24 hours (D) and siCREB1 for 72 hours (E) were immunoblotted for MCAM, CREB1 and SOX2. F) Proposed regulatory network for chemoresistance in SCLC. G) Mathematical model of the network denoting two stable steady states (phenotypes) – chemosensitivity for (low MCAM, low SOX2) and chemoresistance for (high MCAM, high SOX2) shown by filled circles. The hollow circle denotes unstable steady state. The red and blue curves are the nullclines denoting the impact of model variables on MCAM and SOX2 respectively. H) MRP1 expression in H69AR cells with stable MCAM knockdown.
Our findings led to a mathematical model for a regulatory network mediating chemoresistance of SCLC that can behave as a bi-stable switch (i.e., cells can attain one of two stable-steady phenotypes—chemosensitive or chemoresistant, and can transit from one to the other based on the expression levels of SOX2 and MCAM (Fig. 5F, 5G and Supplementary data).
Given our observation of a bidirectional regulation of MCAM and PI3K/AKT pathway activation, we further assessed whether MCAM regulates known PI3K/AKT-regulated targets that have been associated with chemoresistance. Of particular interest, is the ABCC transporter, MRP1, which plays a key role in the chemoresistance of several cancers (24,25) and regulated by PI3K/AKT (26,27). We observed markedly decreased expression of MRP1 protein following MCAM knockdown, suggesting that MRP1 regulation is associated with MCAM expression in chemoresistant cells (Fig. 5H). We also observed reduced levels of NRF2, a known modulator of MRP1 in SCLC (28), in MCAM knockdown cells (Supplementary Figure 4D).
Increased lactate and low oxidative phosphorylation are key features of SCLC chemoresistance
PI3K/AKT activation promotes increased glycolysis rather than oxidative phosphorylation in cancer (29). MRP1 is known to transport glutathione and glutathione-conjugates out of the cell. Thus, the association between MCAM, PI3K/AKT activation and MRP1 inherently suggests metabolic rewiring, a characteristic that may in part be regulated by MCAM.
To determine whether H69AR exhibited a unique metabolic profile compared to the parental H69 cell line, we conducted Ingenuity Pathway Analysis, focusing on proteins that exhibited at least two-fold changes in TCE and at least 5 MS/MS counts in both cell lines (Supplementary Table 2). We found that mitochondrial dysfunction was the most altered pathway (Fig. 6A). Moreover, many of the top perturbed pathways linked to altered metabolism included oxidative phosphorylation, gluconeogenesis, glycolysis, pentose phosphate pathway, and mammalian target of rapamycin signaling (Fig. 6A). We thus evaluated the basal OCRs in the chemoresistant H69AR and other SCLC cell lines (H69, H82, and DMS79) using a Seahorse assay (Fig. 6B). The basal OCR was significantly lower (p < 0.001, unpaired t-test) in the chemoresistant cell line compared to the other SCLC cell lines, demonstrating that the basal metabolic conditions in drug-resistant SCLC cell lines favor elevated aerobic glycolysis and reduced oxidative phosphorylation. Lactate production rate was significantly higher (p < 0.001, unpaired t-test) in H69AR cells than in H69 cells (Fig. 6C). These findings are consistent with a shift towards a glycolytic phenotype associated with PI3K/AKT activation (29). Lactate production decreased significantly (p < 0.01, unpaired t-test) after MCAM knockdown (Fig. 6D) suggesting a potential shift away from glycolysis. We also observed reduced levels of glutathione reductase (GSR), a downstream effector molecule of NRF2 in MCAM knockdown cells (Supplementary Figure 4D).
Figure 6. Effect of MCAM on SCLC metabolism.
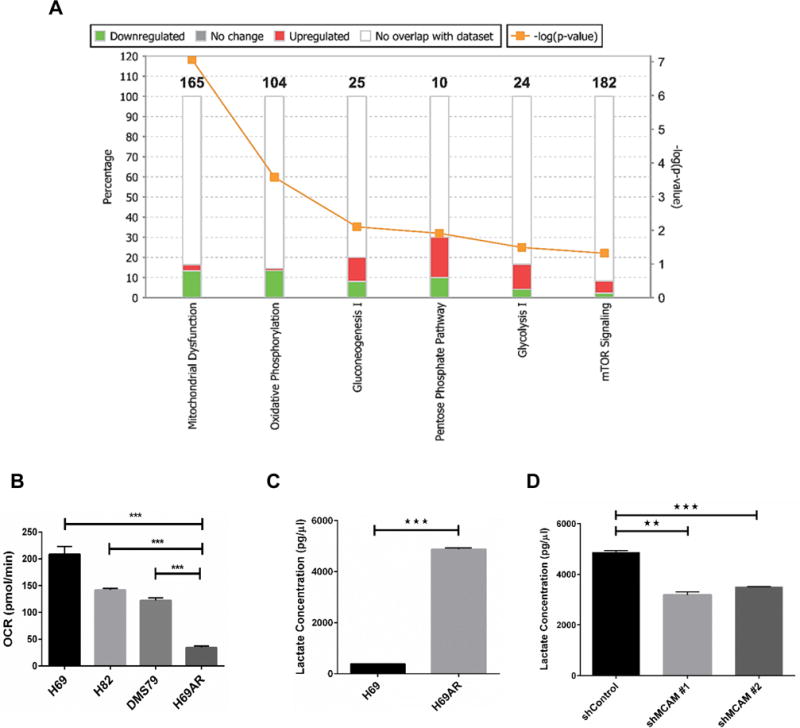
A) Top perturbed pathways in ingenuity pathway analysis linked to altered metabolism in SCLC chemoresistant cells. B) OCR (pmol/min) in SCLC cells measured by a Seahorse Analyser. Basal measurements were normalized for cell number and protein concentrations. C) Lactate concentration compared between H69 sensitive and H69AR chemoresistant cells. D) Lactate concentration was assessed in stable knockdown of MCAM in H69AR chemoresistant cells. Unpaired t-test was used to calculate significance. Error bars represent means ± SD from triplicates or three independent experiments. **p < 0.01, ***p < 0.001.
Discussion
The rapid emergence of chemoresistance in SCLC following treatment is a key contributor to poor survival. Therefore, there is critical clinical need to develop novel strategies that overcomes chemoresistance and provide significant survival benefits to patients.
Analysis of in depth proteomic profiling for TCE and cell surface enrich proteins of SCLC cell lines revealed that the chemoresistant cells have marked distinct surface and TCE profiles. In particular, proteins related to integrin signaling and PI3/AKT signaling such as ITGB1, ITGB5, ITGA2, ITGA4, VCL, ZYX and CTNNB1, PP2A, GYS respectively, observed to be upregulated in TCE as well as enriched on surface of chemoresistant cells. The integrin-ECM interactions are a well-known phenomenon for cell survival and drug resistance in various cancers including solid and hematological malignancies (30). On the other hand, Akt signaling can induce transformation and renders tumor cell resistant to chemotherapeutic agent through its anti-apoptotic activity and induction of cell cycle progression (31–33). We also observed differential expression of proteins related to cancer stem cell (CD44, ALDH3A2, ALDH7A1, EpCAM), EMT (CDH1, Vim, CDH2) and receptor signaling (EGFR, LGALS1, EPHA2, JAG1) that can modulate chemoresistance in cancer cells (34–39).
Our enriched cell surface data identified MCAM among the highly differentially upregulated surface proteins in chemoresistant compared to other SCLC cells. MCAM (also designated as CD146 or MUC18) is a marker of endothelial cell lineage(10). One of the limitation of our study is lack of chemoresistant tissues from SCLC patients. However, SCLC PDX models can replicate the biology of cancer in patients and hence are superior to traditional xenograft tumor models. We thus incorporated PDX models as a component for validation of our proteomics data. We observed markedly increased expression of MCAM protein in chemoresistant than in chemo-naive SCLC PDXs. Increased expression of MCAM on DMS79 but not on H82 and on PDX tissues even after two cycles of chemotherapeutic treatment suggested that the overexpression might be an early event for an acquired chemoresistance in SCLC cells. MCAM overexpression has been observed in several tumor types including melanoma, prostate, pancreatic, lung, gastric, breast, and ovarian cancers (10). Altered expression of MCAM was associated with cell viability and colony forming abilities in SCLC cells, which is in concordance with the reports of MCAM linked to altered cell proliferation, angiogenesis, metastasis, cell motility and invasion (10,40,41). The modulation of chemoresistance through altered MCAM expression is a novel finding, which may be mediated by regulating the apoptosis related protein expression. We also observed increased LGALS1 protein levels, a known ligand of MCAM (15,16), in chemoresistant cells. MCAM and its ligand LGALS1 has been reported to regulate apoptosis in cancer cells (18,19,42–44), which further support our findings.
Given that SCLC is a neuroendocrine tumor type, it is noteworthy that multidrug-resistance in SCLC was associated with an EMT phenotype suggesting that mesenchymal transition is a potentially important mechanism of survival for chemoresistant cells in SCLC and analysis of CCLE (45) data revealed a strong association between MCAM and EMT. Zeng et al., (14) demonstrated that high MCAM expression in triple-negative breast cancers induced EMT and cancer stem cell properties. However, we observed That MCAM modulation has no significant effect on EMT properties of SCLC cells.
In melanoma, MCAM upregulation is dependent on PI3K/AKT pathway which is a known contributor of chemoresistance in numerous malignancies (46). However, our results implicate that in chemoresistant SCLC cells, the relationship between MCAM and PI3K/AKT activation is bidirectional and postulated to be mediated via SOX2/CREB1 axis. These findings are also in concordance with those of recent studies suggesting that SOX2 expression levels in malignant cells are dependent on AKT regulation (47–49). However, further studies needed to confirm this potential relationship.
To define the mechanism(s) by which MCAM can modulate chemoresistance, we evaluated known targets regulated by the PI3K/AKT pathway. Of relevance was MRP1, which has been previously implicated in promoting chemoresistance in numerous cancer types, including SCLC (26,50). Knockdown of MCAM reduced MRP1 expression. MRP1 has a high affinity for exporting glutathione-conjugated metabolites and drugs (51). Multidrug-resistant H69AR cells exhibited greater Nrf2 activation than H69 cells and its expression is associated with MRP1 regulation (28). Nrf2 regulates a number of metabolic pathways, including the induction of antioxidant pathways including the glutathione pathway, as well as NADPH production through G6PD, the rate-limiting enzyme in the pentose phosphate pathway (52). Thus, the observed reduction in MRP1, NRF2 and its downstream effector glutathione reductase due to MCAM knockdown suggests that MCAM works in concert with altered Nrf2 activation, a notion that is supported by the observation that activation of the PI3K/AKT pathway promotes Nrf2 activation in other cancer types (53). In the present study, comparison of the proteome of chemoresistant to other SCLC cell lines revealed perturbations in various metabolic pathways, highlighted by dysregulation of mitochondrial function, gluconeogenesis, glycolysis, and the pentose phosphate pathway. Consistently, chemoresistant cells exhibited reduced basal oxygen consumption, elevated lactate production consistent with increased aerobic glycolysis, and reduced oxidative phosphorylation. Collectively, these findings implicate a metabolic rewiring of glucose metabolism and redox status, both of which inherently linked to PI3K/AKT and Nrf2-activation (29,46,53). Notably, lactate production reduced upon MCAM knockdown implicating a reduction in glucose catabolism through the glycolytic pathway. Further studies, including stable isotope tracer studies, will be required to elucidate the role of MCAM in modulating cancer cell metabolism; however, these remain outside of the immediate scope of this study.
Our findings point to an important role for MCAM in SCLC chemoresistance. Moreover, targeting surface MCAM may serve as a novel therapeutic strategy to combat chemoresistance by modulating the activity and expression of PI3K, Nrf2 and MRP1, well documented and interconnected contributors of drug resistance.
Supplementary Material
Acknowledgments
Funding support: This research was supported through the Rubenstein Family Foundation, the Lyda Hill Foundation and the MD Anderson Moonshot philanthropy grants (to S.M. Hanash)
Footnotes
Conflicts of interest: The authors report no conflicts of interest.
References
- 1.Schmittel A. Second-line therapy for small-cell lung cancer. Expert Rev Anticancer Ther. 2011;11(4):631–7. doi: 10.1586/era.11.7. [DOI] [PubMed] [Google Scholar]
- 2.Siegel RL, Miller KD, Jemal A. Cancer statistics, 2016. CA Cancer J Clin. 2016;66(1):7–30. doi: 10.3322/caac.21332. [DOI] [PubMed] [Google Scholar]
- 3.Lok BH, Gardner EE, Schneeberger VE, Ni A, Desmeules P, Rekhtman N, et al. PARP Inhibitor Activity Correlates with SLFN11 Expression and Demonstrates Synergy with Temozolomide in Small Cell Lung Cancer. Clin Cancer Res. 2016 doi: 10.1158/1078-0432.CCR-16-1040. [DOI] [PMC free article] [PubMed] [Google Scholar]
- 4.Singhal SS, Wickramarachchi D, Singhal J, Yadav S, Awasthi YC, Awasthi S. Determinants of differential doxorubicin sensitivity between SCLC and NSCLC. FEBS Lett. 2006;580(9):2258–64. doi: 10.1016/j.febslet.2006.03.038. [DOI] [PubMed] [Google Scholar]
- 5.Zhivotovsky B. More than one road to kill tumor cells–why are they not always successful? Cell Cycle. 2003;2(1):31–3. doi: 10.4161/cc.2.1.253. [DOI] [PubMed] [Google Scholar]
- 6.Rodriguez-Nieto S, Zhivotovsky B. Role of alterations in the apoptotic machinery in sensitivity of cancer cells to treatment. Curr Pharm Des. 2006;12(34):4411–25. doi: 10.2174/138161206779010495. [DOI] [PubMed] [Google Scholar]
- 7.Sharp A, Bhosle J, Abdelraouf F, Popat S, O’Brien M, Yap TA. Development of molecularly targeted agents and immunotherapies in small cell lung cancer. Eur J Cancer. 2016;60:26–39. doi: 10.1016/j.ejca.2016.03.004. [DOI] [PubMed] [Google Scholar]
- 8.Leong TL, Marini KD, Rossello FJ, Jayasekara SN, Russell PA, Prodanovic Z, et al. Genomic characterisation of small cell lung cancer patient-derived xenografts generated from endobronchial ultrasound-guided transbronchial needle aspiration specimens. PLoS One. 2014;9(9):e106862. doi: 10.1371/journal.pone.0106862. [DOI] [PMC free article] [PubMed] [Google Scholar]
- 9.Lehmann JM, Riethmuller G, Johnson JP. MUC18, a marker of tumor progression in human melanoma, shows sequence similarity to the neural cell adhesion molecules of the immunoglobulin superfamily. Proc Natl Acad Sci U S A. 1989;86(24):9891–5. doi: 10.1073/pnas.86.24.9891. [DOI] [PMC free article] [PubMed] [Google Scholar]
- 10.Wang Z, Yan X. CD146, a multi-functional molecule beyond adhesion. Cancer Lett. 2013;330(2):150–62. doi: 10.1016/j.canlet.2012.11.049. [DOI] [PubMed] [Google Scholar]
- 11.Wang P, Qu Y, Li C, Yin L, Shen C, Chen W, et al. Bio-functionalized dense-silica nanoparticles for MR/NIRF imaging of CD146 in gastric cancer. Int J Nanomedicine. 2015;10:749–63. doi: 10.2147/IJN.S62837. [DOI] [PMC free article] [PubMed] [Google Scholar]
- 12.Liu WF, Ji SR, Sun JJ, Zhang Y, Liu ZY, Liang AB, et al. CD146 expression correlates with epithelial-mesenchymal transition markers and a poor prognosis in gastric cancer. Int J Mol Sci. 2012;13(5):6399–406. doi: 10.3390/ijms13056399. [DOI] [PMC free article] [PubMed] [Google Scholar]
- 13.Oka S, Uramoto H, Chikaishi Y, Tanaka F. The expression of CD146 predicts a poor overall survival in patients with adenocarcinoma of the lung. Anticancer Res. 2012;32(3):861–4. [PubMed] [Google Scholar]
- 14.Zeng Q, Li W, Lu D, Wu Z, Duan H, Luo Y, et al. CD146, an epithelial-mesenchymal transition inducer, is associated with triple-negative breast cancer. Proc Natl Acad Sci U S A. 2012;109(4):1127–32. doi: 10.1073/pnas.1111053108. [DOI] [PMC free article] [PubMed] [Google Scholar]
- 15.Schliekelman MJ, Taguchi A, Zhu J, Dai X, Rodriguez J, Celiktas M, et al. Molecular portraits of epithelial, mesenchymal, and hybrid States in lung adenocarcinoma and their relevance to survival. Cancer research. 2015;75(9):1789–800. doi: 10.1158/0008-5472.CAN-14-2535. [DOI] [PMC free article] [PubMed] [Google Scholar]
- 16.Tripathi SC, Peters HL, Taguchi A, Katayama H, Wang H, Momin A, et al. Immunoproteasome deficiency is a feature of non-small cell lung cancer with a mesenchymal phenotype and is associated with a poor outcome. Proc Natl Acad Sci U S A. 2016;113(11):E1555–64. doi: 10.1073/pnas.1521812113. [DOI] [PMC free article] [PubMed] [Google Scholar]
- 17.Acharyya S, Oskarsson T, Vanharanta S, Malladi S, Kim J, Morris PG, et al. A CXCL1 paracrine network links cancer chemoresistance and metastasis. Cell. 2012;150(1):165–78. doi: 10.1016/j.cell.2012.04.042. [DOI] [PMC free article] [PubMed] [Google Scholar]
- 18.Jouve N, Despoix N, Espeli M, Gauthier L, Cypowyj S, Fallague K, et al. The involvement of CD146 and its novel ligand Galectin-1 in apoptotic regulation of endothelial cells. J Biol Chem. 2013;288(4):2571–9. doi: 10.1074/jbc.M112.418848. [DOI] [PMC free article] [PubMed] [Google Scholar]
- 19.Yazawa EM, Geddes-Sweeney JE, Cedeno-Laurent F, Walley KC, Barthel SR, Opperman MJ, et al. Melanoma Cell Galectin-1 Ligands Functionally Correlate with Malignant Potential. J Invest Dermatol. 2015;135(7):1849–62. doi: 10.1038/jid.2015.95. [DOI] [PMC free article] [PubMed] [Google Scholar]
- 20.Melnikova VO, Dobroff AS, Zigler M, Villares GJ, Braeuer RR, Wang H, et al. CREB inhibits AP-2alpha expression to regulate the malignant phenotype of melanoma. PLoS One. 2010;5(8):e12452. doi: 10.1371/journal.pone.0012452. [DOI] [PMC free article] [PubMed] [Google Scholar]
- 21.Caravatta L, Sancilio S, di Giacomo V, Rana R, Cataldi A, Di Pietro R. PI3-K/Akt-dependent activation of cAMP-response element-binding (CREB) protein in Jurkat T leukemia cells treated with TRAIL. J Cell Physiol. 2008;214(1):192–200. doi: 10.1002/jcp.21186. [DOI] [PubMed] [Google Scholar]
- 22.Rudin CM, Durinck S, Stawiski EW, Poirier JT, Modrusan Z, Shames DS, et al. Comprehensive genomic analysis identifies SOX2 as a frequently amplified gene in small-cell lung cancer. Nat Genet. 2012;44(10):1111–6. doi: 10.1038/ng.2405. [DOI] [PMC free article] [PubMed] [Google Scholar]
- 23.Ormsbee Golden BD, Wuebben EL, Rizzino A. Sox2 expression is regulated by a negative feedback loop in embryonic stem cells that involves AKT signaling and FoxO1. PLoS One. 2013;8(10):e76345. doi: 10.1371/journal.pone.0076345. [DOI] [PMC free article] [PubMed] [Google Scholar]
- 24.Guo L, Liu Y, Bai Y, Sun Y, Xiao F, Guo Y. Gene expression profiling of drug-resistant small cell lung cancer cells by combining microRNA and cDNA expression analysis. Eur J Cancer. 2010;46(9):1692–702. doi: 10.1016/j.ejca.2010.02.043. [DOI] [PubMed] [Google Scholar]
- 25.Triller N, Korosec P, Kern I, Kosnik M, Debeljak A. Multidrug resistance in small cell lung cancer: expression of P-glycoprotein, multidrug resistance protein 1 and lung resistance protein in chemo-naive patients and in relapsed disease. Lung Cancer. 2006;54(2):235–40. doi: 10.1016/j.lungcan.2006.06.019. [DOI] [PubMed] [Google Scholar]
- 26.Yao J, Wei X, Lu Y. Chaetominine reduces MRP1-mediated drug resistance via inhibiting PI3K/Akt/Nrf2 signaling pathway in K562/Adr human leukemia cells. Biochem Biophys Res Commun. 2016;473(4):867–73. doi: 10.1016/j.bbrc.2016.03.141. [DOI] [PubMed] [Google Scholar]
- 27.Tazzari PL, Cappellini A, Ricci F, Evangelisti C, Papa V, Grafone T, et al. Multidrug resistance-associated protein 1 expression is under the control of the phosphoinositide 3 kinase/Akt signal transduction network in human acute myelogenous leukemia blasts. Leukemia. 2007;21(3):427–38. doi: 10.1038/sj.leu.2404523. [DOI] [PubMed] [Google Scholar]
- 28.Ji L, Li H, Gao P, Shang G, Zhang DD, Zhang N, et al. Nrf2 pathway regulates multidrug-resistance-associated protein 1 in small cell lung cancer. PLoS One. 2013;8(5):e63404. doi: 10.1371/journal.pone.0063404. [DOI] [PMC free article] [PubMed] [Google Scholar]
- 29.Munoz-Pinedo C, El Mjiyad N, Ricci JE. Cancer metabolism: current perspectives and future directions. Cell Death Dis. 2012;3:e248. doi: 10.1038/cddis.2011.123. [DOI] [PMC free article] [PubMed] [Google Scholar]
- 30.Aoudjit F, Vuori K. Integrin signaling in cancer cell survival and chemoresistance. Chemother Res Pract. 2012;2012:283181. doi: 10.1155/2012/283181. [DOI] [PMC free article] [PubMed] [Google Scholar]
- 31.Kim D, Dan HC, Park S, Yang L, Liu Q, Kaneko S, et al. AKT/PKB signaling mechanisms in cancer and chemoresistance. Front Biosci. 2005;10:975–87. doi: 10.2741/1592. [DOI] [PubMed] [Google Scholar]
- 32.Stassi G, Garofalo M, Zerilli M, Ricci-Vitiani L, Zanca C, Todaro M, et al. PED mediates AKT-dependent chemoresistance in human breast cancer cells. Cancer Res. 2005;65(15):6668–75. doi: 10.1158/0008-5472.CAN-04-4009. [DOI] [PubMed] [Google Scholar]
- 33.Yan X, Fraser M, Qiu Q, Tsang BK. Over-expression of PTEN sensitizes human ovarian cancer cells to cisplatin-induced apoptosis in a p53-dependent manner. Gynecol Oncol. 2006;102(2):348–55. doi: 10.1016/j.ygyno.2005.12.033. [DOI] [PubMed] [Google Scholar]
- 34.Abdullah LN, Chow EK. Mechanisms of chemoresistance in cancer stem cells. Clin Transl Med. 2013;2(1):3. doi: 10.1186/2001-1326-2-3. [DOI] [PMC free article] [PubMed] [Google Scholar]
- 35.Alvero AB, Chen R, Fu HH, Montagna M, Schwartz PE, Rutherford T, et al. Molecular phenotyping of human ovarian cancer stem cells unravels the mechanisms for repair and chemoresistance. Cell Cycle. 2009;8(1):158–66. doi: 10.4161/cc.8.1.7533. [DOI] [PMC free article] [PubMed] [Google Scholar]
- 36.Ranganathan P, Weaver KL, Capobianco AJ. Notch signalling in solid tumours: a little bit of everything but not all the time. Nat Rev Cancer. 2011;11(5):338–51. doi: 10.1038/nrc3035. [DOI] [PubMed] [Google Scholar]
- 37.Song S, Honjo S, Jin J, Chang SS, Scott AW, Chen Q, et al. The Hippo Coactivator YAP1 Mediates EGFR Overexpression and Confers Chemoresistance in Esophageal Cancer. Clin Cancer Res. 2015;21(11):2580–90. doi: 10.1158/1078-0432.CCR-14-2191. [DOI] [PMC free article] [PubMed] [Google Scholar]
- 38.Sullivan JP, Spinola M, Dodge M, Raso MG, Behrens C, Gao B, et al. Aldehyde dehydrogenase activity selects for lung adenocarcinoma stem cells dependent on notch signaling. Cancer Res. 2010;70(23):9937–48. doi: 10.1158/0008-5472.CAN-10-0881. [DOI] [PMC free article] [PubMed] [Google Scholar]
- 39.Boareto M, Jolly MK, Goldman A, Pietila M, Mani SA, Sengupta S, et al. Notch-Jagged signalling can give rise to clusters of cells exhibiting a hybrid epithelial/mesenchymal phenotype. J R Soc Interface. 2016;13(118) doi: 10.1098/rsif.2015.1106. [DOI] [PMC free article] [PubMed] [Google Scholar]
- 40.Wu GJ, Fu P, Wang SW, Wu MW. Enforced expression of MCAM/MUC18 increases in vitro motility and invasiveness and in vivo metastasis of two mouse melanoma K1735 sublines in a syngeneic mouse model. Mol Cancer Res. 2008;6(11):1666–77. doi: 10.1158/1541-7786.MCR-07-2200. [DOI] [PubMed] [Google Scholar]
- 41.Xie S, Luca M, Huang S, Gutman M, Reich R, Johnson JP, et al. Expression of MCAM/MUC18 by human melanoma cells leads to increased tumor growth and metastasis. Cancer Res. 1997;57(11):2295–303. [PubMed] [Google Scholar]
- 42.Wu Z, Wu Z, Li J, Yang X, Wang Y, Yu Y, et al. MCAM is a novel metastasis marker and regulates spreading, apoptosis and invasion of ovarian cancer cells. Tumour Biol. 2012;33(5):1619–28. doi: 10.1007/s13277-012-0417-0. [DOI] [PMC free article] [PubMed] [Google Scholar]
- 43.Su YC, Davuluri GV, Chen CH, Shiau DC, Chen CC, Chen CL, et al. Galectin-1-Induced Autophagy Facilitates Cisplatin Resistance of Hepatocellular Carcinoma. PLoS One. 2016;11(2):e0148408. doi: 10.1371/journal.pone.0148408. [DOI] [PMC free article] [PubMed] [Google Scholar]
- 44.Yan B, Zhao D, Yao Y, Bao Z, Lu G, Zhou J. Deguelin Induces the Apoptosis of Lung Squamous Cell Carcinoma Cells through Regulating the Expression of Galectin-1. Int J Biol Sci. 2016;12(7):850–60. doi: 10.7150/ijbs.14773. [DOI] [PMC free article] [PubMed] [Google Scholar]
- 45.Barretina J, Caponigro G, Stransky N, Venkatesan K, Margolin AA, Kim S, et al. The Cancer Cell Line Encyclopedia enables predictive modelling of anticancer drug sensitivity. Nature. 2012;483(7391):603–7. doi: 10.1038/nature11003. [DOI] [PMC free article] [PubMed] [Google Scholar]
- 46.Hafsi S, Pezzino FM, Candido S, Ligresti G, Spandidos DA, Soua Z, et al. Gene alterations in the PI3K/PTEN/AKT pathway as a mechanism of drug-resistance (review) Int J Oncol. 2012;40(3):639–44. doi: 10.3892/ijo.2011.1312. [DOI] [PubMed] [Google Scholar]
- 47.Schaefer T, Wang H, Mir P, Konantz M, Pereboom TC, Paczulla AM, et al. Molecular and functional interactions between AKT and SOX2 in breast carcinoma. Oncotarget. 2015;6(41):43540–56. doi: 10.18632/oncotarget.6183. [DOI] [PMC free article] [PubMed] [Google Scholar]
- 48.Singh S, Trevino J, Bora-Singhal N, Coppola D, Haura E, Altiok S, et al. EGFR/Src/Akt signaling modulates Sox2 expression and self-renewal of stem-like side-population cells in non-small cell lung cancer. Mol Cancer. 2012;11:73. doi: 10.1186/1476-4598-11-73. [DOI] [PMC free article] [PubMed] [Google Scholar]
- 49.Li Y, Chen K, Li L, Li R, Zhang J, Ren W. Overexpression of SOX2 is involved in paclitaxel resistance of ovarian cancer via the PI3K/Akt pathway. Tumour Biol. 2015;36(12):9823–8. doi: 10.1007/s13277-015-3561-5. [DOI] [PubMed] [Google Scholar]
- 50.Liu H, Wu X, Huang J, Peng J, Guo L. miR-7 modulates chemoresistance of small cell lung cancer by repressing MRP1/ABCC1. Int J Exp Pathol. 2015;96(4):240–7. doi: 10.1111/iep.12131. [DOI] [PMC free article] [PubMed] [Google Scholar]
- 51.Cole SP, Deeley RG. Transport of glutathione and glutathione conjugates by MRP1. Trends Pharmacol Sci. 2006;27(8):438–46. doi: 10.1016/j.tips.2006.06.008. [DOI] [PubMed] [Google Scholar]
- 52.Gorrini C, Harris IS, Mak TW. Modulation of oxidative stress as an anticancer strategy. Nat Rev Drug Discov. 2013;12(12):931–47. doi: 10.1038/nrd4002. [DOI] [PubMed] [Google Scholar]
- 53.Wu J, Williams D, Walter GA, Thompson WE, Sidell N. Estrogen increases Nrf2 activity through activation of the PI3K pathway in MCF-7 breast cancer cells. Exp Cell Res. 2014;328(2):351–60. doi: 10.1016/j.yexcr.2014.08.030. [DOI] [PubMed] [Google Scholar]
Associated Data
This section collects any data citations, data availability statements, or supplementary materials included in this article.