

Abstract
Objective
To examine whether midlife insulin resistance is an independent risk factor for brain amyloid accumulation in vivo after 15 years, and whether this risk is modulated by APOE ε4 genotype.
Methods
This observational study examined 60 elderly volunteers without dementia (mean age at baseline 55.4 and at follow-up 70.9 years, 55.5% women) from the Finnish population-based, nationwide Health2000 study with [11C]Pittsburgh compound B–PET imaging in 2014–2016. The participants were recruited according to their homeostatic model assessment of insulin resistance (HOMA-IR) values in the year 2000, and their APOE ε4 genotype. The exposure group (IR+, n = 30) consisted of individuals with HOMA-IR >2.17 at baseline (highest tertile of the Health2000 study population), and the control group (IR−, n = 30) consisted of individuals with HOMA-IR <1.25 at baseline (lowest tertile). The groups were enriched for APOE ε4 carriers, resulting in 50% (n = 15) APOE ε4 carriers in both groups. Analyses were performed with multivariate logistic and linear regression.
Results
An amyloid-positive PET scan was found in 33.3% of the IR− group and 60.0% of the IR+ group (odds ratio 3.0, 95% confidence interval 1.1–8.9, p = 0.04). The increased risk was seen in carriers and noncarriers of APOE ε4 genotype. Higher midlife, but not late-life continuous HOMA-IR was associated with a greater brain amyloid burden at follow-up after multivariate adjustments for other cognitive and metabolic risk factors (β = 0.11, 95% confidence interval 0.002–0.22, p = 0.04).
Conclusions
These results indicate that midlife insulin resistance is an independent risk factor for brain amyloid accumulation in elderly individuals without dementia.
Type 2 diabetes mellitus (T2DM) is a risk factor for Alzheimer disease (AD).1–3 These diseases share many common pathogenic features, such as low-grade chronic inflammation and insulin resistance (IR).4 In vitro and animal studies suggest that IR could contribute to the neuropathology of AD through multiple different pathways.5,6 There is epidemiologic evidence that IR increases the risk of AD.7–10 However, the previous PET studies on IR and brain β-amyloid (Aβ) accumulation have yielded conflicting results.11–13 Thus, it is not clear whether IR is a risk factor for AD neuropathology in humans.
APOE ε4 genotype is an acknowledged risk factor for Aβ accumulation14 and AD.15 Previous epidemiologic studies suggest an interaction between IR and APOE ε4 on AD risk.7,9 The neuropathologic Honolulu-Asia study found an interaction between diabetes and APOE ε4 on brain Aβ load.16 To date, the possible interactions between IR and APOE ε4 on brain amyloid accumulation in vivo have not been extensively studied.
Based on these previous findings, we hypothesized that midlife IR would increase the risk of brain amyloid accumulation in late-life, and that this risk might be modulated by APOE ε4 genotype. To test these hypotheses, we recruited 60 volunteers based on their homeostatic model assessment of IR (HOMA-IR)17 values and their APOE genotype, assessed 15 years previously in the Health2000 study, to participate in a PET study.
Methods
Study population and recruitment criteria
The study volunteers were recruited from the Finnish, nationwide, population-based Health2000 health examination survey, conducted by the Finnish National Institute for Health and Welfare in 2000–2001. In the Health2000 study, 8,028 individuals were randomly selected from the Finnish population register using a 2-stage stratified cluster sampling procedure. The participation rate was 79% (n = 6,354) for the health examination proper, which included a thorough physical examination and venous blood sampling.18
Individuals who, at baseline, had fasted for <4 hours (n = 229), who had insulin treatment or unknown diabetes medication (n = 59), or had missing HOMA-IR values (n = 4) were excluded, and thus 6,062 individuals were eligible for recruitment (figure e-1, links.lww.com/WNL/A292).
The power calculations were based on test–retest analyses of [11C] Pittsburgh compound B ([11C]PiB)-PET scans, which indicate that for a 90% power to obtain a statistically significant difference between groups, 5 persons per group would be needed to detect a 15% difference in [11C]PiB accumulation in the frontal cortex.19
In 2014, a total of 60 volunteers with a birth year from 1934 to 1949 were recruited from the Health2000 study population to participate in this follow-up study. We recruited 30 individuals with elevated HOMA-IR values in the year 2000 (IR+ group: HOMA-IR in the highest tertile of the Health2000 study population, HOMA-IR >2.17) and 30 with normal midlife HOMA-IR values (IR− group: HOMA-IR in the lowest tertile of the Health2000 study population, HOMA-IR <1.25). To examine the possible modulating effects of APOE ε4, the study population was enriched for APOE ε4 carriers, yielding 50% (n = 15) APOE ε4 carriers in both groups. APOE ε4 carriership was defined as having either an ε4/ε4 or an ε4/ε3 genotype (noncarriers ε3/ε3 or ε2/ε3). Those with both a risk allele and a protective allele for AD (ε4/ε2) were not included.
Exclusion criteria were a contraindication for PET or MRI scan (such as claustrophobia), history of major stroke, diagnosis of dementia, T2DM in 2000, and, for the IR− group, diagnosis of T2DM after the year 2000.
All individuals who responded to the invitation letter and who gave permission to be contacted were interviewed via telephone and given more detailed information on the study procedures. Those who were willing to participate and eligible based on the telephone interview were selected to participate based on (1) how close they lived to the Turku PET Centre (people living in Turku or the communities nearby were preferred), (2) when their letter of response had arrived, and (3) the age and sex of the volunteers (the IR+/IR− groups were age- and sex-matched). A detailed flowchart of the recruitment process is provided in figure e-1 (links.lww.com/WNL/A292).
The mean age of the study population at baseline in 2000 was 55.4 years and at the time of PET scans was 70.9 years; 55.5% were women.
Standard protocol approvals, registrations, and patient consents
The Health2000 study was approved by the Ethics Committee for Epidemiology and Public Health in the Hospital District of Helsinki and Uusimaa, Finland. This follow-up study was approved by the Ethics Committee of the Hospital District of Southwest Finland. All participants gave written informed consent to participate in the studies.
Laboratory assessments and covariates
The methods of laboratory assessments in 2000 have been previously described.20,21 At the follow-up in 2014–2016, insulin was determined by ECLIA (electrochemiluminescence immunoassay) with a Cobas e602 immunochemistry analyzer (Roche Diagnostics GmbH, Mannheim, Germany), glucose by enzymatic photometry with a Cobas c702 chemistry analyzer (Roche Diagnostics GmbH), and hemoglobin A1c with an immunochemical method with a Cobas c501 analyzer (Roche Diagnostics GmbH). HOMA-IR was counted by the following equation: fasting insulin (μU/mL) × fasting glucose (mmol/L)/22.5.17 APOE ε4 genotyping was performed by using the MassARRAY System (Sequenom, San Diego, CA) with a modified protocol that has been described in detail elsewhere.22 Hypertension was defined as systolic RR ≥140 or diastolic ≥90 mm Hg or use of antihypertensive treatment.
Study protocol
Cognitive testing was performed at follow-up according to the Finnish version of the Consortium to Establish a Registry for Alzheimer's Disease (CERAD) test,23,24 and CERAD total score was counted as previously described.25 Venous blood samples were drawn after an overnight fast (minimum 10 hours), and a 2-hour oral glucose tolerance test was performed. To obtain anatomical reference and to exclude structural abnormalities, a 3-tesla MRI scan of the brain was performed on a Philips Ingenuity TF PET-MR device (Philips Healthcare, Amsterdam, the Netherlands). The dynamic 90-minute [11C]PiB-PET scan was performed using a brain-dedicated, high-resolution PET scanner, the ECAT HRRT (Siemens Medical Solutions, Knoxville, TN). [11C]PiB was manufactured in high molar radioactivity (mean 680 MBq/nmol [SD ± 240] at the time of injection) utilizing in-target–produced [11C]methane as described previously.26 Radiochemical purity of the [11C]PiB was high and reproducible through the 60 production runs (mean 99.9% [SD ± 0.1]). A mean dose of 489 MBq (SD ± 42) [11C]PiB, which corresponds to a radiotracer mass of mean 0.24 μg (SD ± 0.19), was administered intravenously and flushed with saline. During positioning in the PET scanner, an individually shaped thermoplastic mask was placed on the face of each study volunteer to minimize head movement. An external position detector (Polaris Vicra; Northern Digital, Waterloo, Canada) was used to monitor possible movements of the head.
Analysis of PET data
Voxel-by-voxel [11C]PiB standardized uptake values were calculated using imaging data from 60 to 90 minutes after tracer injection. Automated region-of-interest (ROI) generation was conducted using FreeSurfer software (version 5.3.0, http://freesurfer.net/) and individual T1-weighted MRI data as input, yielding 6 ROIs (parietal cortex, prefrontal cortex, anterior cingulum, posterior cingulum, precuneus, and lateral temporal cortex) and cerebellar cortex. Standardized uptake value ratios (SUVRs) were then obtained by using the cerebellar cortex as a reference region.27 ROI-based analysis was conducted in the aforementioned ROIs using the regional average PiB SUVR. A composite PiB score was calculated as the average PiB SUVR over all 6 ROIs. The [11C]PiB-PET scan was considered PiB positive (PiB[+]) when the PiB composite score was >1.5. This cutoff has previously been validated by other groups in healthy elderly controls.28,29
Statistical analysis
The differences on characteristics and potential risk factors for cognitive decline at baseline and at follow-up between IR− and IR+ groups, and between the participants of this study and the Health2000 study population, were analyzed with the Student t test for continuous variables and with the Pearson χ2 test for categorical variables. A logarithmic transformation (loge) was used of the variables with a skewed distribution (triglycerides, glucose, and hemoglobin A1c at both time points, HOMA-IR at follow-up, and injected [11C]PiB mass).
Multivariable logistic regression analysis was performed to evaluate the associations between the baseline IR group and the PiB(+) PET scan. Adjustments were made for age at baseline, time from baseline to PET scan, years of formal education, and sex (model 1). Model 2 further adjusted for baseline body mass index (BMI) and hypertension, and model 3 for high-density lipoprotein cholesterol and triglycerides. Because the IR+ and IR− groups contained an equal number of APOE ε4 carriers, APOE genotype was not added as a covariate in these models.
In APOE ε4–stratified analyses, increasing PiB(+) prevalence according to IR group and APOE ε4 status was assessed with the Pearson χ2 test.
The distributions of PiB SUVRs were only moderately skewed (skewness <1.5 for all ROIs), allowing us to perform linear regression analysis for continuous PiB uptake. Associations between IR group and continuous PiB SUVRs in different ROIs were analyzed first with the Student t test. Then, multivariate linear regression analyses according to the aforementioned models of adjustment were performed.
To evaluate whether higher levels of IR at baseline would associate with higher continuous PiB composite SUVR, analyses where baseline HOMA-IR was treated as a continuous variable were performed with linear regression analysis and adjusted for the covariates mentioned above, and APOE genotype in all models.
Additional cross-sectional analyses were performed between continuous HOMA-IR at follow-up and PiB composite score in model 1.
Interactions between “IR group × APOE ε4” and PiB(+) PET scan (logistic regression), and continuous PiB composite score (linear regression) were analyzed in model 1.
Voxel-by-voxel differences in PiB SUVR between the IR groups were assessed using statistical parametric mapping (SPM8; Wellcome Trust Centre for Neuroimaging, London, UK), with 2-sample Student t test adjusted for model 1; the test was regarded statistically significant at p < 0.025 (uncorrected for multiple comparisons). Statistical significance was set at p < 0.05 for all other analyses. The analyses were performed with SAS JMP Pro 11.0 (SAS Institute, Cary, NC).
Results
Demographics
Although this was a volunteer-based sample, the study sample represented the original Health2000 study cohort well (table e-1, links.lww.com/WNL/A293). According to our recruitment criteria, the participants of the present study were older (p < 0.0001) and more often APOE ε4 carriers (p = 0.002) than the participants of the Health2000 study.
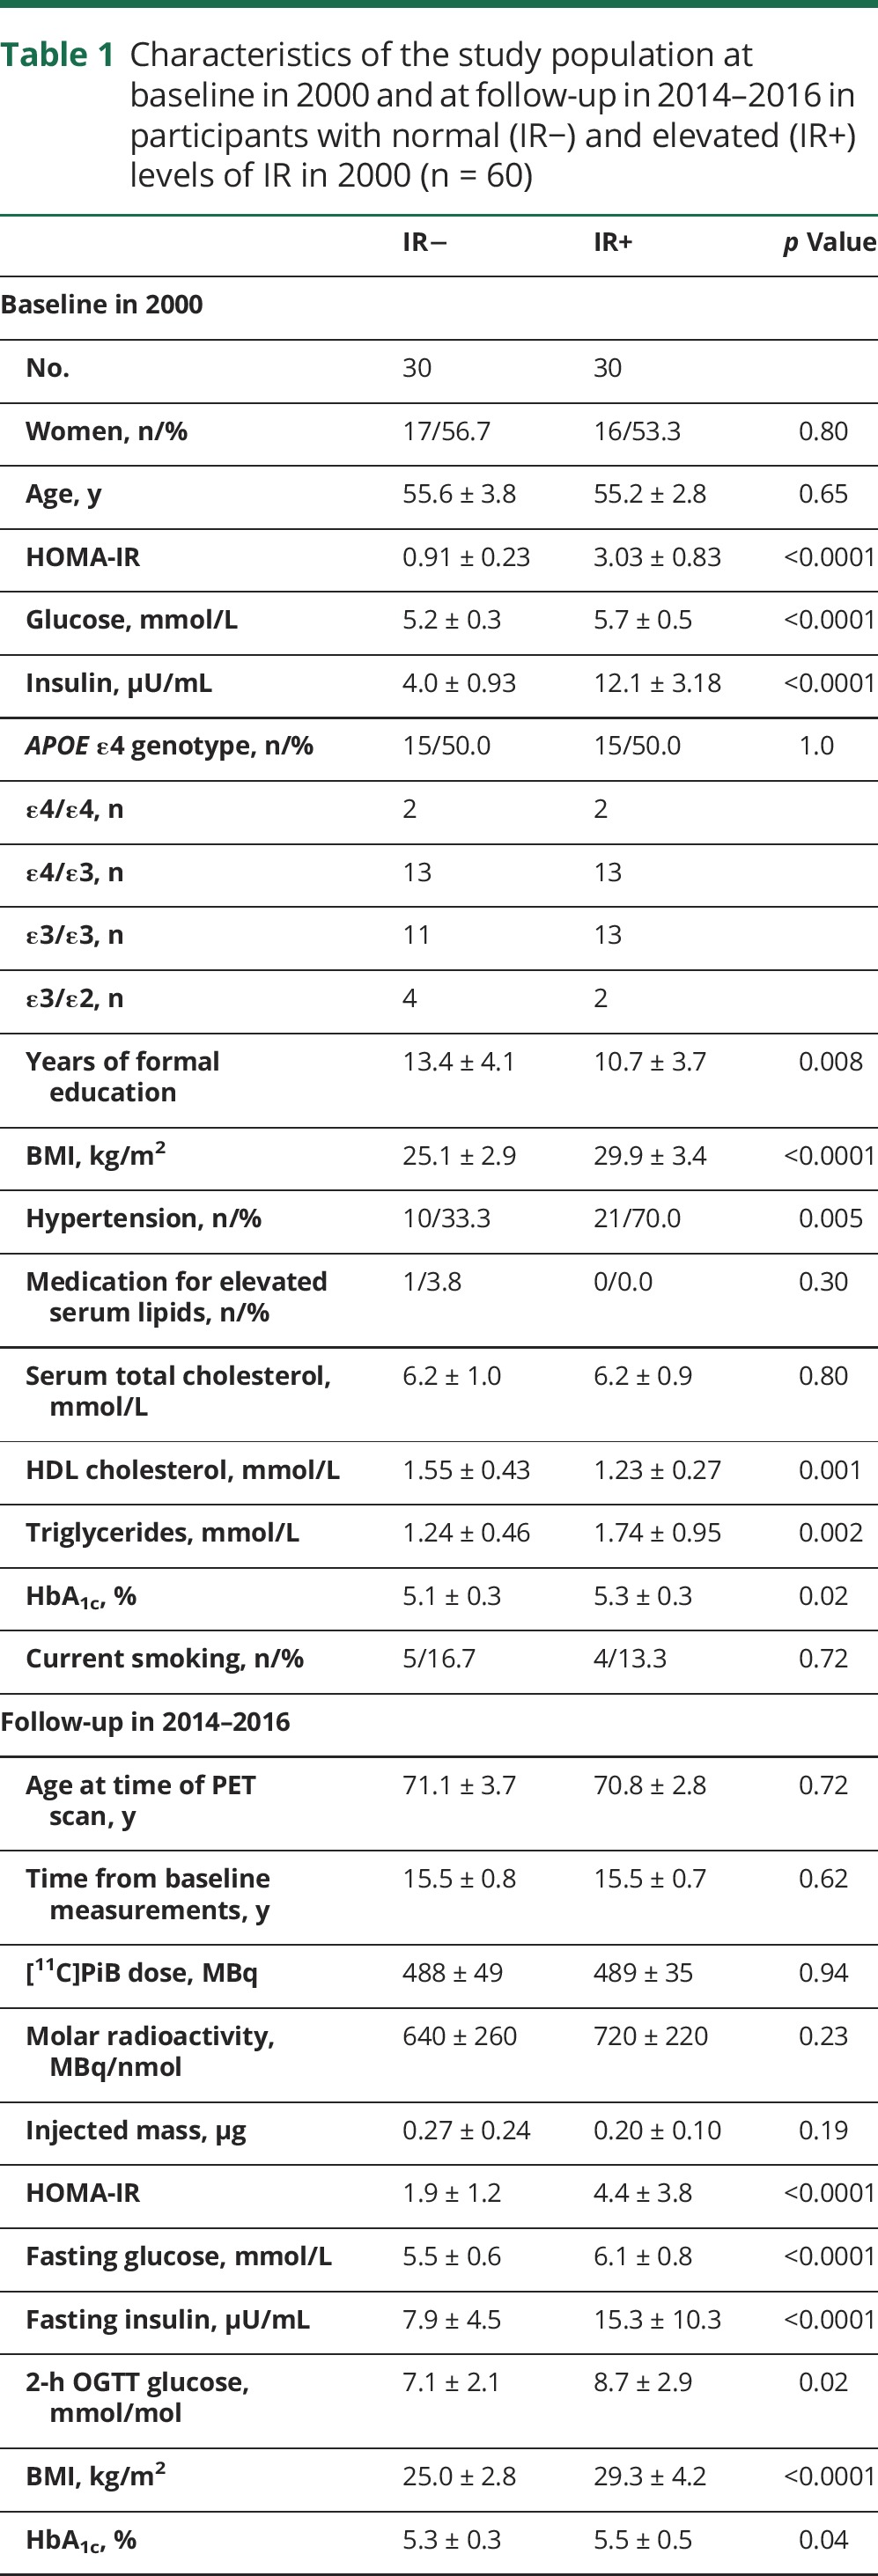
Characteristics at baseline and at follow-up according to IR− and IR+ groups are shown in table 1. There were no differences between the groups at baseline on age, sex, smoking, or total cholesterol. Individuals with IR at baseline were less educated, more often had hypertension, and, as expected, had a higher BMI, higher triglycerides, and lower high-density lipoprotein cholesterol. Five individuals (16.7%) in the IR+ group had been diagnosed with T2DM during the follow-up. The study groups did not differ in CERAD total score at follow-up. HOMA-IR at baseline correlated relatively well with HOMA-IR at time of PET scans (R = 0.56, p < 0.0001; data not shown).
Table 1.
Characteristics of the study population at baseline in 2000 and at follow-up in 2014–2016 in participants with normal (IR−) and elevated (IR+) levels of IR in 2000 (n = 60)
Amyloid-positive PET scan according to IR at baseline and APOE genotype
Figure 1 shows the percentage of individuals with PiB(+) PET scan according to IR group and APOE ε4 genotype. Of the IR− group, 33.3% (10/30), and of the IR+ group, 60.0% (18/30) were PiB(+) (unadjusted odds ratio [OR] 3.0, 95% confidence interval [CI] 1.1–8.9, p = 0.04; model 1: OR 4.4, CI 1.3–17.1, p = 0.02; model 2: OR 12.2, CI 2.2–95.0, p = 0.003; model 3: OR 11.1, CI 1.9–91.5, p = 0.007). When stratified for APOE ε4 genotype, the percentage of PiB(+) individuals was 6.7% (1/15) in the IR−/APOE ε4− group, 26.7% (4/15) in the IR+/APOE ε4− group; 60% (9/15) in the IR−/APOE ε4+ group, and 93.3% (14/15) in the IR+/APOE ε4+ group (ptrend < 0.0001). There was no interaction for IR group × APOE ε4, on being PiB(+) (p = 0.78) or PiB composite score (p = 0.30) and, thus, no further APOE ε4–stratified results are presented.
Figure 1. Percentage of participants with PiB(+) PET scan according to IR group and APOE ε4 genotype.

PiB positive is defined as PiB composite standardized uptake value ratio score >1.5. OR for PiB(+) PET scan in the IR+ group, compared to the IR− group, assessed with unadjusted logistic regression analysis. The ptrend for increasing prevalence of PiB(+) PET scan according to IR group and APOE genotype, assessed with Pearson χ2 test. (A) n = 30 in each group; (B) n = 15 in each group. IR = insulin resistance; OR = odds ratio; PiB = Pittsburgh compound B.
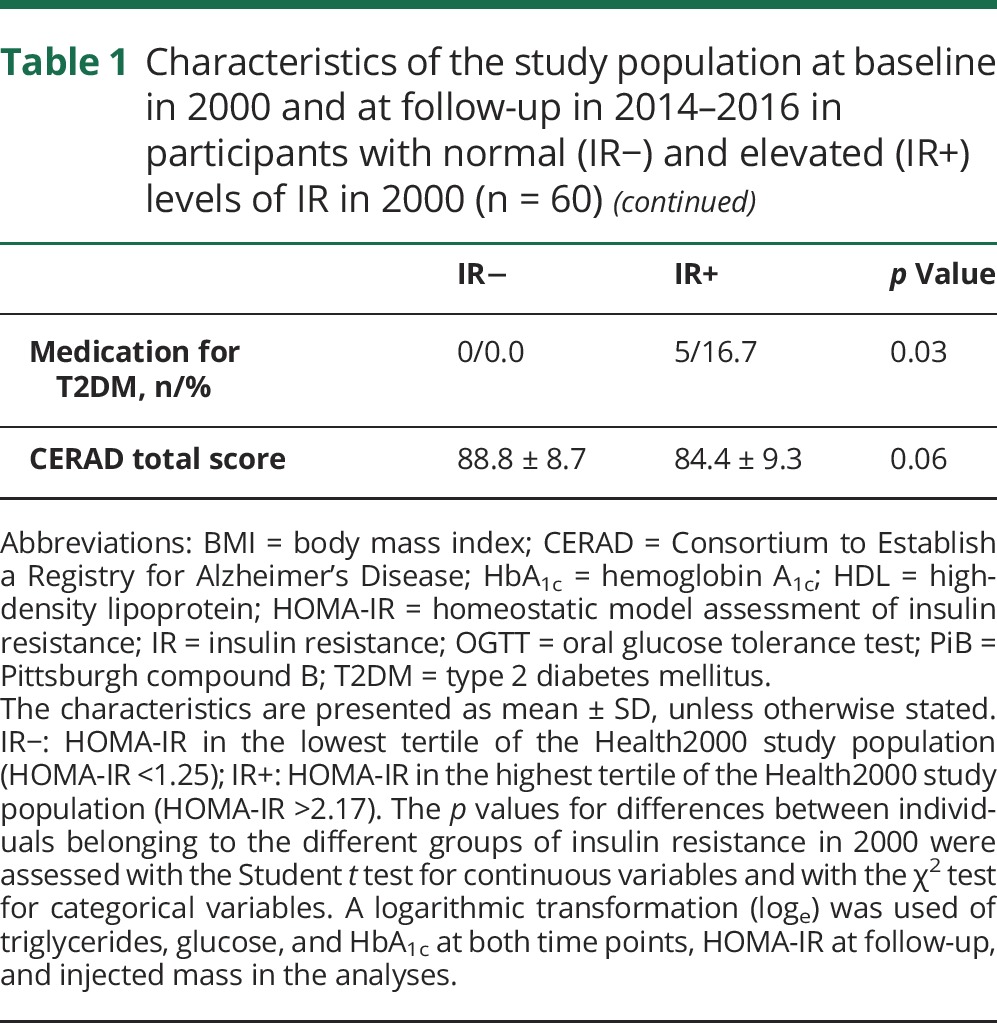
Comparison of PiB composite score and PiB SUVR in different ROIs according to IR groups
There were differences between the IR− and IR+ groups in [11C]PiB SUVRs in all the ROIs examined (table 2). Baseline IR+ group predicted a higher PiB composite score at follow-up (β = 0.36, 95% CI 0.05–0.66, p = 0.02) in the fully adjusted model 3. Adjusting additionally for diagnosis of T2DM during follow-up did not change these results (p = 0.02).
Table 2.
PiB SUVRs in ROIs typical for amyloid accumulation in Alzheimer disease, according to the participants' HOMA-IR values at baseline in 2000
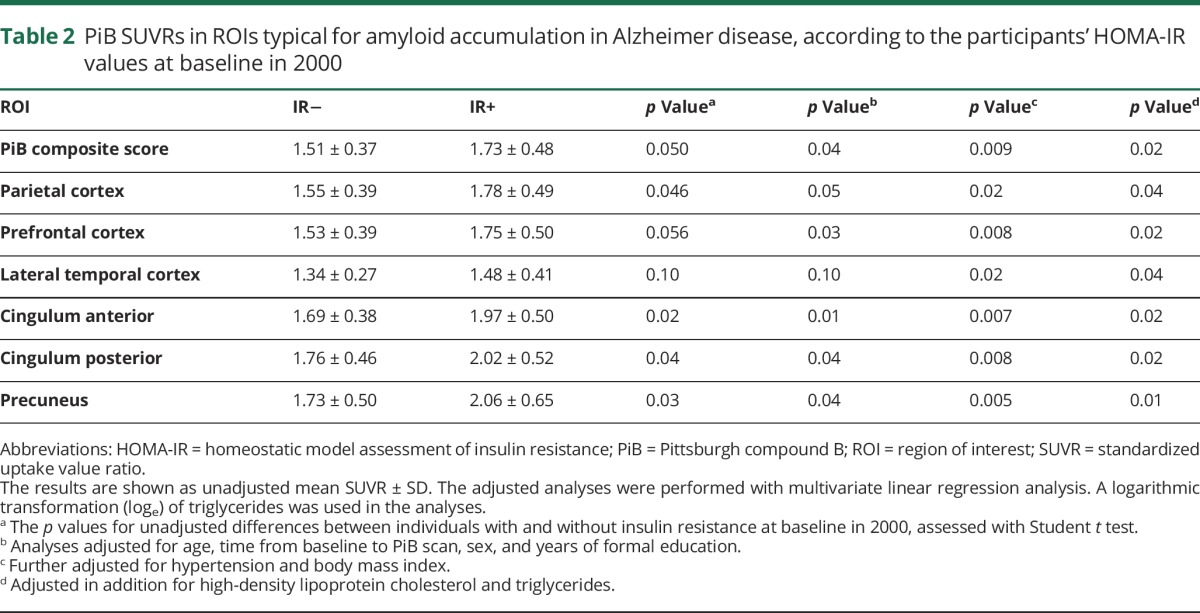
Associations between continuous HOMA-IR and PiB composite score
Higher baseline continuous HOMA-IR was associated with higher PiB composite score at follow-up after multivariate adjustments (model 3: β = 0.11, 95% CI 0.002–0.22, p = 0.04). Of the other covariates in the model, only APOE ε4 genotype predicted a higher PiB composite score (model 3: β = 0.45, 95% CI 0.26–0.64, p < 0.001) (table 3). Cross-sectional analyses showed no association between HOMA-IR at time of PET scan and PiB composite score (unadjusted analyses β = 0.12, 95% CI −0.03 to 0.26, p = 0.11; model 1: β = 0.10, 95% CI −0.03 to 0.23, p = 0.14).
Table 3.
Multivariate baseline predictors of brain amyloid accumulation (PiB composite standardized uptake value ratio score) 15 years later
Voxel-by-voxel analysis
The voxel-by-voxel SPM analyses showed that [11C]PiB uptake was greater in the IR+ group compared to the IR− group in regions where amyloid accumulation is also seen in early AD,30 i.e., the frontal and the parietal cortices, posterior cingulum/precuneus, and in the lateral temporal cortex (figure 2). The differences in [11C]PiB uptake between the IR groups were visualized with BrainNet Viewer.31
Figure 2. Visualization of the results of SPM.
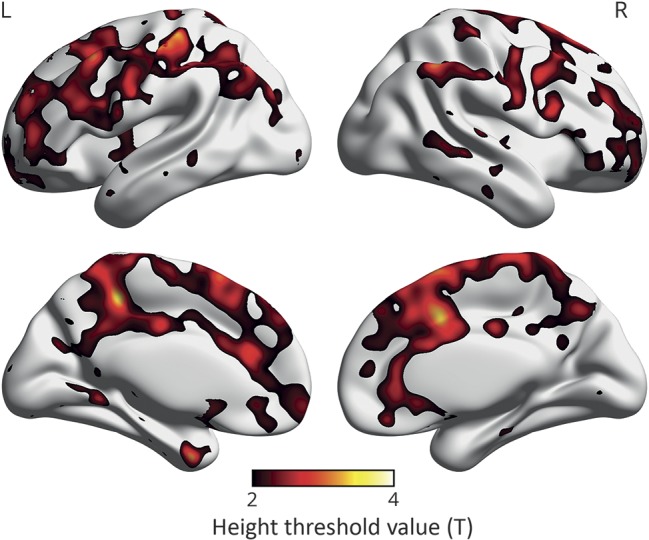
Voxel-by-voxel SPM analysis of [11C]PiB uptake showing regions where individuals with insulin resistance 15 years before the PET scans had higher [11C]PiB uptake than the control group. The color scale starts from the height threshold (T) 2.0, derived from SPM analysis adjusted for age, time from baseline to PiB scan, sex, and years of education, and indicating the difference between IR− and IR+ groups for all regions shown in color in the image; yellow is the most significant (p < 0.025 when T = 2.0, uncorrected for multiple comparisons). n = 60. IR = insulin resistance; PiB = Pittsburgh compound B; SPM = statistical parametric mapping.
Discussion
This observational study indicates that midlife, but not late-life, IR associates with greater brain amyloid accumulation in elderly individuals without dementia, in both carriers and noncarriers of APOE ε4 genotype. Voxel-by-voxel comparisons showed that, in individuals with midlife IR, [11C]PiB uptake was evident in the regions also affected in early AD. These findings provide in vivo biomarker evidence for the epidemiologic studies linking IR with cognitive decline21,32–34 and AD.7–10 We recruited the study volunteers based on their IR status in midlife, which allowed us to assess “real-life” exposure to IR over time.
A recent meta-analysis explored the prevalence of brain amyloid accumulation in individuals without dementia, according to age and APOE ε4 genotype. The estimated prevalence of an amyloid-positive PET scan at age 70 was 17.1% in APOE ε4–negative and 47.9% in APOE ε4–positive individuals with normal cognition.14 Compared to these numbers, the prevalence of amyloid positivity was remarkably high in the present study in individuals with IR (IR+/APOE ε4 noncarrier 26.7%, and IR+/APOE ε4 carrier 93.3%), indicating that midlife IR is an additive risk factor for amyloid positivity.
Our results expand the previous cross-sectional findings that showed an association between higher HOMA-IR and [11C]PiB uptake in late middle-aged individuals.12 In line with our findings considering late-life IR and [11C]PiB, a recent cross-sectional study found no association between late-life HOMA-IR and brain amyloid burden.13
In contrast to our results, the only previous longitudinal study on HOMA-IR and amyloid PET reported no association between repeated measures of IR during 20 years and [11C]PiB uptake at a mean age of 79 years, or with postmortem neuropathologic assessment of Aβ.11 A possible explanation for the negative results could be the older age of the study population at the time of the PET scan, when compared to the present study. It is probable that at age 79, other age-related risk factors contribute to amyloid accumulation, which is why an association between IR and [11C]PiB uptake might no longer be evident. In addition, the APOE ε4 genotype of the participants was not reported, or controlled for, in the previous study, which could have interfered with the results.11
The findings presented here are also in accord with the Atherosclerosis Risk in Communities (ARIC) study, which showed that midlife, but not late-life, vascular risk factors increase the risk of an amyloid-positive PET scan.35 Of the 5 risk factors measured in the ARIC study (obesity, smoking, hypertension, high cholesterol, and diabetes), only obesity independently predicted an amyloid-positive PET scan. In our study, higher IR was associated with higher [11C]PiB uptake even after adjusting for BMI levels. Because obesity is strongly associated with IR,36 it seems plausible that IR could be the driver of the association between midlife obesity and late-life amyloid accumulation also found in the ARIC study. Similar to our findings, the ARIC study found no interaction between APOE ε4 genotype and vascular risk factors on Aβ accumulation.35
The results of the present study are supported by in vitro and animal studies suggesting that IR contributes to the neuropathology of AD through multiple different pathways.5,6 For example, insulin and Aβ both are degraded by the same enzyme in the brain. In IR, this enzyme is downregulated, which could lead to increased accumulation of Aβ.6 Reduced responses in insulin signaling pathways after insulin incubation were shown in postmortem brain tissues of patients with AD regardless of diabetes status,37 indicating that IR at the cellular level is present in the AD brain. Thus, it seems that peripheral IR is accompanied by CNS IR, which could, over time, increase the risk of AD neuropathology.
The limitations of this study are the relatively small study population, and that the gold standard for measuring IR, the euglycemic hyperinsulinemic clamp, was not used to determine IR. Because this was a volunteer-based sample, and enrollment was also based on matters of convenience (how close the participants lived to the imaging center), the results might be biased and possibly not generalizable. Also, the variation in fasting times at baseline might have influenced the HOMA-IR values of the participants. However, baseline HOMA-IR values correlated relatively well with HOMA-IR values at follow-up, and also HOMA-IR values at follow-up were higher in the IR+ group than in the IR− group, allowing us to assume that the IR− and IR+ groups actually were different in terms of IR throughout the follow-up time. The strengths of this follow-up study are the 15-year follow-up between baseline measurements of HOMA-IR and [11C]PiB-PET scan; the enrichment of APOE ε4 genotype in the study; and the possibility to adjust for other midlife metabolic risk factors in the analyses.
Herein, we show that midlife IR associates with a greater brain amyloid burden after a follow-up of 15 years. This finding has important clinical and public health implications, because our results suggest that early treatment and prevention of IR could reduce the risk of brain amyloid accumulation in late-life. Because brain amyloid accumulation has been shown to increase the risk of AD,38 these results suggest that midlife IR increases the risk of AD. To confirm these findings, larger follow-up studies on midlife IR and AD biomarkers should be conducted.
Acknowledgment
The authors sincerely thank all the study volunteers for their generous contribution. They also thank Eliisa Löyttyniemi, MSc, from the Department of Biostatistics, University of Turku, Finland, for advice on the statistical analysis of the data.
Glossary
- Aβ
β-amyloid
- AD
Alzheimer disease
- ARIC
Atherosclerosis Risk in Communities
- BMI
body mass index
- CERAD
Consortium to Establish a Registry for Alzheimer's Disease
- CI
confidence interval
- HOMA-IR
homeostatic model assessment of insulin resistance
- IR
insulin resistance
- OR
odds ratio
- PiB
Pittsburgh compound B
- ROI
region of interest
- SUVR
standardized uptake value ratio
- T2DM
type 2 diabetes mellitus
Footnotes
CME Course: NPub.org/cmelist
Author contributions
Dr. Ekblad: study concept and design, acquisition of data, analysis and interpretation of data, wrote the manuscript. Dr. Johansson: reconstructed the PET images and performed the quantitative analysis of the imaging data, and drafted and revised the manuscript for intellectual content. Dr. Helin: manufactured [11C]PiB, and drafted and revised the manuscript for intellectual content. Dr. Viitanen: study concept and design, interpretation of data, and drafted and revised the manuscript for intellectual content. Dr. Laine: study concept and design, interpretation of data, and drafted and revised the manuscript for intellectual content. Dr. Puukka: study concept and design, interpretation of data, and drafted and revised the manuscript for intellectual content. Dr. Jula: study concept and design, interpretation of data, and drafted and revised the manuscript for intellectual content. Dr. Rinne: study concept and design, interpretation of data, and drafted and revised the manuscript for intellectual content.
Study funding
This study was funded by Finnish Governmental Research Funding (ERVA) for Turku University Hospital and Turku City Hospital, the Pro Humanitate Foundation, the Finnish Cultural Foundation, and the Sigrid Jusélius Foundation. In addition, Dr. Ekblad received ERVA funding from Turku University Hospital and research grants from the Paulo Foundation, the Finnish Brain Foundation, the foundation of Yrjö Jahnsson, and the Orion Research Foundation.
Disclosure
L. Ekblad has received Finnish Governmental Research Funding (ERVA) from Turku University Hospital and research grants from the Paulo Foundation, the Finnish Brain Foundation, the foundation of Yrjö Jahnsson, and the Orion Research Foundation. J. Johansson, S. Helin, M. Viitanen, H. Laine, P. Puukka, A. Jula, and J. Rinne report no disclosures relevant to the manuscript. Go to Neurology.org/N for full disclosures.
References
- 1.Ott A, Stolk RP, van Harskamp F, Pols HA, Hofman A, Breteler MM. Diabetes mellitus and the risk of dementia: the Rotterdam Study. Neurology 1999;53:1937–1942. [DOI] [PubMed] [Google Scholar]
- 2.Biessels GJ, Staekenborg S, Brunner E, Brayne C, Scheltens P. Risk of dementia in diabetes mellitus: a systematic review. Lancet Neurol 2006;5:64–74. [DOI] [PubMed] [Google Scholar]
- 3.Cheng G, Huang C, Deng H, Wang H. Diabetes as a risk factor for dementia and mild cognitive impairment: a meta-analysis of longitudinal studies. Intern Med J 2012;42:484–491. [DOI] [PubMed] [Google Scholar]
- 4.De Felice FG, Ferreira ST. Inflammation, defective insulin signaling, and mitochondrial dysfunction as common molecular denominators connecting type 2 diabetes to Alzheimer disease. Diabetes 2014;63:2262–2272. [DOI] [PubMed] [Google Scholar]
- 5.Craft S, Cholerton B, Baker LD. Insulin and Alzheimer's disease: untangling the web. J Alzheimers Dis 2013;33(suppl 1):S263–S275. [DOI] [PubMed] [Google Scholar]
- 6.Cholerton B, Baker LD, Craft S. Insulin, cognition, and dementia. Eur J Pharmacol 2013;719:170–179. [DOI] [PMC free article] [PubMed] [Google Scholar]
- 7.Kuusisto J, Koivisto K, Mykkänen L, et al. Association between features of the insulin resistance syndrome and Alzheimer's disease independently of apolipoprotein E4 phenotype: cross sectional population based study. BMJ 1997;315:1045–1049. [DOI] [PMC free article] [PubMed] [Google Scholar]
- 8.Luchsinger JA, Tang MX, Shea S, Mayeux R. Hyperinsulinemia and risk of Alzheimer disease. Neurology 2004;63:1187–1192. [DOI] [PubMed] [Google Scholar]
- 9.Ronnemaa E, Zethelius B, Sundelof J, et al. Impaired insulin secretion increases the risk of Alzheimer disease. Neurology 2008;71:1065–1071. [DOI] [PubMed] [Google Scholar]
- 10.Schrijvers EM, Witteman JC, Sijbrands EJ, Hofman A, Koudstaal PJ, Breteler MM. Insulin metabolism and the risk of Alzheimer disease: the Rotterdam Study. Neurology 2010;75:1982–1987. [DOI] [PMC free article] [PubMed] [Google Scholar]
- 11.Thambisetty M, Metter EJ, Yang A, et al. Glucose intolerance, insulin resistance, and pathological features of Alzheimer disease in the Baltimore Longitudinal Study of Aging. JAMA Neurol 2013;70:1167–1172. [DOI] [PMC free article] [PubMed] [Google Scholar]
- 12.Willette AA, Johnson SC, Birdsill AC, et al. Insulin resistance predicts brain amyloid deposition in late middle-aged adults. Alzheimers Dement 2015;11:504–510. [DOI] [PMC free article] [PubMed] [Google Scholar]
- 13.Laws SM, Gaskin S, Woodfield A, et al. Insulin resistance is associated with reductions in specific cognitive domains and increases in CSF tau in cognitively normal adults. Sci Rep 2017;7:9766. [DOI] [PMC free article] [PubMed] [Google Scholar]
- 14.Jansen WJ, Ossenkoppele R, Knol DL, et al. Prevalence of cerebral amyloid pathology in persons without dementia: a meta-analysis. JAMA 2015;313:1924–1938. [DOI] [PMC free article] [PubMed] [Google Scholar]
- 15.Corder EH, Saunders AM, Strittmatter WJ, et al. Gene dose of apolipoprotein E type 4 allele and the risk of Alzheimer's disease in late onset families. Science 1993;261:921–923. [DOI] [PubMed] [Google Scholar]
- 16.Peila R, Rodriguez BL, Launer LJ; Honolulu-Asia Aging Study. Type 2 diabetes, APOE gene, and the risk for dementia and related pathologies: the Honolulu-Asia Aging Study. Diabetes 2002;51:1256–1262. [DOI] [PubMed] [Google Scholar]
- 17.Matthews DR, Hosker JP, Rudenski AS, Naylor BA, Treacher DF, Turner RC. Homeostasis model assessment: insulin resistance and beta-cell function from fasting plasma glucose and insulin concentrations in man. Diabetologia 1985;28:412–419. [DOI] [PubMed] [Google Scholar]
- 18.Aromaa A, Koskinen S. Health and Functional Capacity in Finland: Baseline Results of the Health2000 Health Examination Survey [online]. Helsinki: National Public Health institute; 2004:B12. Available at: http://julkari.fi/handle/10024/78534. Accessed May 16, 2017. [Google Scholar]
- 19.Aalto S, Scheinin NM, Kemppainen NM, et al. Reproducibility of automated simplified voxel-based analysis of PET amyloid ligand [11C]PIB uptake using 30-min scanning data. Eur J Nucl Med Mol Imaging 2009;36:1651–1660. [DOI] [PubMed] [Google Scholar]
- 20.Heistaro S, editor. Methodology Report: Health2000 Survey [online]. Helsinki: National Public Health Institute; 2008:B26. Available at: http://urn.fi/URN:NBN:fi-fe201204193320. Accessed May 16, 2017. [Google Scholar]
- 21.Ekblad LL, Rinne JO, Puukka P, et al. Insulin resistance predicts cognitive decline: an 11-year follow-up of a nationally representative adult population sample. Diabetes Care 2017;40:751–758. [DOI] [PubMed] [Google Scholar]
- 22.Janis MT, Siggins S, Tahvanainen E, et al. Active and low-active forms of serum phospholipid transfer protein in a normal Finnish population sample. J Lipid Res 2004;45:2303–2309. [DOI] [PubMed] [Google Scholar]
- 23.Morris JC, Heyman A, Mohs RC, et al. The Consortium to Establish a Registry for Alzheimer's Disease (CERAD). Part I. Clinical and neuropsychological assessment of Alzheimer's disease. Neurology 1989;39:1159–1165. [DOI] [PubMed] [Google Scholar]
- 24.Hänninen T, Pulliainen V, Salo J, et al. Cognitive tests in diagnosing memory disorders and early dementia: CERAD-neuropsychological battery [in Finnish]. Suom Lääkäril 1999;54:1967–1975. [Google Scholar]
- 25.Chandler MJ, Lacritz LH, Hynan LS, et al. A total score for the CERAD neuropsychological battery. Neurology 2005;65:102–106. [DOI] [PubMed] [Google Scholar]
- 26.Snellman A, Rokka J, Lopez-Picon FR, et al. Applicability of [11C]PIB micro-PET imaging for in vivo follow-up of anti-amyloid treatment effects in APP23 mouse model. Neurobiol Aging 2017;57:84–94. [DOI] [PubMed] [Google Scholar]
- 27.Lopresti BJ, Klunk WE, Mathis CA, et al. Simplified quantification of Pittsburgh compound B amyloid imaging PET studies: a comparative analysis. J Nucl Med 2005;46:1959–1972. [PubMed] [Google Scholar]
- 28.Jack CR Jr, Lowe VJ, Senjem ML, et al. 11C PiB and structural MRI provide complementary information in imaging of Alzheimer's disease and amnestic mild cognitive impairment. Brain 2008;131(pt 3):665–680. [DOI] [PMC free article] [PubMed] [Google Scholar]
- 29.Rowe CC, Ellis KA, Rimajova M, et al. Amyloid imaging results from the Australian Imaging, Biomarkers and Lifestyle (AIBL) Study of Aging. Neurobiol Aging 2010;31:1275–1283. [DOI] [PubMed] [Google Scholar]
- 30.Braak H, Braak E. Frequency of stages of Alzheimer-related lesions in different age categories. Neurobiol Aging 1997;18:351–357. [DOI] [PubMed] [Google Scholar]
- 31.Xia M, Wang J, He Y. BrainNet Viewer: a network visualization tool for human brain connectomics. PLoS One 2013;8:e68910. [DOI] [PMC free article] [PubMed] [Google Scholar]
- 32.Young SE, Mainous AG III, Carnemolla M. Hyperinsulinemia and cognitive decline in a middle-aged cohort. Diabetes Care 2006;29:2688–2693. [DOI] [PubMed] [Google Scholar]
- 33.Lutski M, Weinstein G, Goldbourt U, Tanne D. Insulin resistance and future cognitive performance and cognitive decline in elderly patients with cardiovascular disease. J Alzheimers Dis 2017;57:633–643. [DOI] [PubMed] [Google Scholar]
- 34.Tortelli R, Lozupone M, Guerra V, et al. Midlife metabolic profile and the risk of late-life cognitive decline. J Alzheimers Dis 2017;59:121–130. [DOI] [PubMed] [Google Scholar]
- 35.Gottesman RF, Schneider AL, Zhou Y, et al. Association between midlife vascular risk factors and estimated brain amyloid deposition. JAMA 2017;317:1443–1450. [DOI] [PMC free article] [PubMed] [Google Scholar]
- 36.Ferrannini E, Natali A, Bell P, Cavallo-Perin P, Lalic N, Mingrone G. Insulin resistance and hypersecretion in obesity. European Group for the Study of Insulin Resistance (EGIR). J Clin Invest 1997;100:1166–1173. [DOI] [PMC free article] [PubMed] [Google Scholar]
- 37.Talbot K, Wang HY, Kazi H, et al. Demonstrated brain insulin resistance in Alzheimer's disease patients is associated with IGF-1 resistance, IRS-1 dysregulation, and cognitive decline. J Clin Invest 2012;122:1316–1338. [DOI] [PMC free article] [PubMed] [Google Scholar]
- 38.Rowe CC, Bourgeat P, Ellis KA, et al. Predicting Alzheimer disease with beta-amyloid imaging: results from the Australian Imaging, Biomarkers, and Lifestyle Study of Ageing. Ann Neurol 2013;74:905–913. [DOI] [PubMed] [Google Scholar]