

Abstract
Purpose
Pancreatic ductal adenocarcinoma (PDAC) is a lethal disease characterized by its late diagnosis, poor prognosis and rapid development of drug resistance. Using the data independent acquisition (DIA) technique, we applied a spectral library-based proteomic approach to analyze N-glycosylated peptides in human plasma, in the context of pancreatic cancer study.
Experimental design
We extended the application of DIA to the quantification of N-glycosylated peptides enriched from plasma specimens from a clinically well-defined cohort that consists of patients with early stage PDAC, chronic pancreatitis and healthy subjects.
Results
The analytical platform was evaluated in light of its robustness for quantitative analysis of large scale clinical specimens. Our analysis indicated that the level of N-glycosylated peptides derived from galectin-3 binding proteins (LGALS3BP) were frequently elevated in plasma from PDAC patients, concurrent with the altered N-glycosylation of LGALS3BP observed in the tumor tissue.
Conclusions and clinical relevance
The glycosylation form of LGALS3BP influences its function in the galectin network, which profoundly involves in cancer progression, immune response and drug resistance. As one of the major binding ligands of galectin network, discovery of site specific N-glycosylation changes of LGALS3BP in association of PDAC may provide useful clues to facilitate cancer detection or phenotype stratification.
Keywords: glycoproteomics, galectin-3 binding proteins (LGALS3BP), plasma, pancreatic cancer, mass spectrometry, proteomics
Introduction
Aberrant glycosylation has long been recognized as a hallmark for epithelial cancers [1–4], including pancreatic ductal adenocarcinoma (PDAC) [5], which accounts for about 90% of pancreatic cancer. Identification and detection of malignancy-associated aberrant glycosylation, such as abnormal glycan structures and site-specific glycosylation occupancy changes, would provide useful information for biomarker and drug development [3,6,7]. In fact, a large number of FDA-approved clinical tests for various cancer types are based on glycosylation assays or targeting glycoproteins for detection, including CA 19-9 for pancreatic cancer monitoring [8,9].
The development of protein biomarker to facilitate pancreatic cancer detection involves discovery and detection of aberrant glycoproteins in bodily fluids, such as blood [5,10–13]. As one of the most important clinical specimens, plasma is enriched with extracellular glycoproteins, as well as glycoproteins shed from tissues. There is a considerable interest to develop a comprehensive quantitative approach to detect site-specific glycosylation changes in blood plasma. A variety of approaches have been developed targeting protein glycosylation, especially N-linked glycosylation, for quantitative detection using glycoproteomics [14–16]. Hydrazide chemistry based solid phase extraction has been one of the most widely used methods for enrichment of glycoproteins or glycopeptides for plasma analysis [16–18]. In such an approach, glycoproteins or glycopeptides are covalently conjugated to a solid support using hydrazide chemistry, enriched and specifically released by PNGase F enzyme for mass spectrometric analysis, as illustrated in Supplemental Figure 1.
While targeted proteomics has been applied for designated N-glycopeptide analysis [18,19], recent technology of data independent acquisition (DIA), such as SWATH [20,21], can pave the way for the global targeted analysis of entire enriched glycoproteins through a single LC-MS/MS run. DIA technology is spectral library based and can be equated as the global SRM analysis of entire co-eluting peptides. In our earlier study [22], we have successfully implemented the essence of using DIA in the large scale quantification of plasma proteins. Here, we present the spectral library-based DIA analysis of plasma N-glycopeptides using a clinically well-characterized cohort consisting of patients with PDAC, chronic pancreatitis and healthy subjects. The method was assessed in the light of discovering N-glycopeptides with changes relevant to PDAC.
Materials and Methods
Plasma Samples
This study was approved by the Institutional Review Board at the University of Washington (Seattle, WA) and University of Pittsburgh (Pittsburgh, PA). Plasma samples were collected from patients with pancreatic ductal adenocarcinoma (PDAC) and chronic pancreatitis (CP, diseased control), as well as healthy subjects (NL). The diagnosis of disease was made histologically in the case of pancreatic cancer patients. The PDAC patients with early stage disease were operable, representing a mixture of localized pancreatic cancer (stages 1 and 2). The cancer patients involved in this study did not receive any treatment prior to blood draw. CP was diagnosed based on computed tomography (CT) scan showing calcifications, ductal dilation and atrophy, or by the presence of structural and functional abnormalities detected by combined endoscopic ultrasound (EUS) and/or secretin pancreatic function testing. The blood samples were processed using similar protocols within 4 hours after specimen collection. The plasma samples were collected into purple top tubes (Becton Dickinson, Franklin Lakes, NJ, USA) with EDTA, the potassium salt, as an anticoagulant. The blood was centrifuged at 330 × g for 20 minutes. The resultant plasma samples were aliquoted and stored in −80 °C until used.
Sample preparation
UltraLink™ hydrazide resin kit (Thermo Fisher Scientific, Waltham, MA, USA) was used for the enrichment of plasma glycopeptides. 20 μL of human plasma was diluted to 200 μL using coupling buffer, and then 1 μg of denatured yeast invertase 2 (INV2) glycoprotein standard (Sigma Aldrich, St. Louis, MO, USA) was spiked in the mixture. The glycoproteins were oxidized with 10mM sodium meta periodate by incubating the sample for 1hr at room temperature in dark with rotation. Hydrazide beads were suspended in 400 μL coupling buffer, combined with the oxidized glycoprotein mixture, then incubated at room temperature for 16 hours. The mixture was centrifuged and the beads were collected and washed with 1 ml of 80% ACN with 0.1% TFA, followed by three additional washes with 50mM NH4HCO3 buffer. The beads were resuspended in 400 μL of 50 mM NH4HCO3 buffer, incubated with 10 mM DTT at 50°C for 1 hour, then incubated with 25 mM IDA for 30 minutes at room temperature in the dark. Digestion was performed with the addition of 10 μg of trypsin in two steps. Half of the trypsin was added and the mixture was incubated for 2 hours at 37 °C, then the remaining trypsin was added and the mixture was incubated for additional 16 hours at 37 °C. After tryptic digestion, the beads were washed three times with PBS to remove the non-specific binding peptides, and re-suspended in 200 μL PBS buffer. The conjugated glycopeptides were released with the addition of 2 μL of PNGase F enzyme and 6 hours of incubation at 37 °C. The supernatant was collected and the beads were washed with 200 μL PBS, which was combine with the supernatant. The peptide mixture was then completely dried and stored in −20 °C until LC/MS analysis.
LC-MS/MS analysis
Peptide separation was done with a nanoACQUITY UPLC system (Waters, Milford, MA, USA) prior to mass spectrometric analysis. The LC separation set up consisted of a trapping column and an analytical column connected back-to-back to increase the loading speed. The trapping column was a 3 cm × 100 μm self-packed integraFit column (Scientific Instrument Services, Ringoes, NJ, USA) packed with ProntoSIL 200 Å/5 μm-C18 AQ (Mac-Mod, Chadds Ford, PA, USA). The analytical column was 25 cm × 75 μm fused silica column packed with ProntoSIL 120 Å/5 μm-C18 AQ (Mac-Mod). A column tip was prepared by a Laser Fiber Puller P-2000 (Sutter Instruments, Novato, CA, USA). Buffer A and buffer B were water and acetonitrile with 0.1 % formic acid, respectively. 1 μg of sample was loaded on the trapping column with 2% B at 2 μL/min flow rate for 10 minutes. Peptides were then resolved with a 90-minute gradient of 5 to 30% B followed by flushing at 80% B for 10 minutes and column equilibration with 2% B for 20 minutes. The analytical flow rate was 0.3 μL/min and the entire data acquisition lasted for 120 minutes. For both data-dependent acquisition (DDA) and data-independent acquisition (DIA) analysis, the same LC settings were used for retention time stability. DDA was performed on an Orbitrap Fusion Tribrid mass spectrometer (ThermoFisher Scientific). The survey scan was done with 120K resolution at 400 m/z from 400 to 1600 m/z with AGC target of 4e5 and max injection time of 50 msec. Monoisotopic masses were then selected for further fragmentation for ions with 2 to 4 plus charge within a dynamic exclusion range of 30 seconds and a minimum intensity threshold of 5e3 ions. Fragmentation priority was given to the most intense ions. Precursor ions were isolated using the quadrupole with an isolation window of 1.6 m/z. Rapid scan speed in the ion trap was selected after HCD fragmentation (NCE 28%) and the AGC target of 1e4 was set with a maximum injection time of 50 msec. The DDA cycle was limited to 3 seconds. The DIA analysis was performed on an Orbitrap Q Exactive Plus mass spectrometer (ThermoFisher Scientific) with the resolution of 17,500 at 200 m/z. AGC target was set at 1e6 with 55 msec maximum injection time. Optimal isolation windows were 7 m/z, and NCE was 28. The acquisition window covered a mass range from 410 to 900 m/z through 70 consecutive isolation windows.
Data analysis
DDA data for library construction was processed using Trans-Proteomic Pipeline (TPP) [23,24]. The MS raw files were converted to mzML open format and searched against the UniProt human protein database (2015-07-23) with Comet algorithm [25]. The search parameters were set as follows: cysteine alkylation defined as static modification (+57.0215), and methionine oxidation (+15.9949) and aspargine-deamidation (+0.9840) as dynamic modifications. The search was limited to maximum five dynamic modifications and two miss-cleavages with a mass tolerance of 20 ppm. The peptide sequence assignment was statistically validated with PeptideProphet [26] and only the peptides with a probability score ≥ 0.95 were retained for spectral library building.
The DIA data was analyzed using the Skyline software [27]. The peptide spectral library was devised by importing the search results generated from the plasma DDA data. Additional peptides belonging to the plasma protein categories were added from the tissue databases as well to enrich the identification and quantification. The transitions were limited to the peptides with 410 to 900 m/z, and only top 5 b or y ions with m/z value greater than 200 were selected for the data mining. The peptide profiles were explored through the highest library dot products in the 10 minutes of retention time from the spectral library. The signals from the transitions were summed to provide the quantification for the corresponding peptide. The unpaired t-test with Welch’s correction was applied to compare the PDAC group with the control groups using Prism program.
Results
The spectral library-based targeted analysis of N-glycopeptides in plasma was carried out using the Skyline platform [28]. A pancreatic cancer specific human plasma glycopeptide spectral library was constructed based on the registry of peptide and protein identification in the plasma samples from patients with PDAC, chronic pancreatitis and healthy controls using the DDA analysis and database search. In total, we identified >550 motif-containing (NXS/T) peptides derived from 326 plasma proteins in the plasma samples. Our identification criteria were set at PeptideProphet probability ≥0.95, but the analysis also includes the Xcorr values and the number of identification of each glycopeptide (hit number). Supplemental Figure 2 shows the gene-ontology annotation of the identified glycoproteins included in the library. The majority of identified glycoproteins belong to extracellular regions, and plasma membrane.
The quality of glycopeptide analysis was first assessed through the analysis of 4 analytical replicates using a set of analytical parameters including the average library dot product, standard deviation of retention time, and coefficient of variation (CV) of peak measurement. Peptides with a CV ≤ 20% and a consistent retention time across the replicates were considered to be quantifiable. Hence, we focused our analysis on the 127 Uniprot-annotated endogenous glycopeptides that have a CV ≤ 20% and a m/z value between 410 and 900 m/z.
Figure 1 shows the intensity correlation of the analytical replicates. The data deliberately distinguished those with a CV ≤ 20% (blue dots) and those with a CV ≥ 20% (orange dots). It is indicative that the peptides with a poor CV were typically associated with low abundance, low mass spectrometric sensitivity or poor chromatographic characteristics. The linearity of the plots extends for more than 6 orders of magnitude, indicative for a high dynamic range analysis using the optimal DIA method. This will ensure the concomitant quantification of glycopeptides from abundant plasma proteins with the low abundant proteins.
Figure 1.
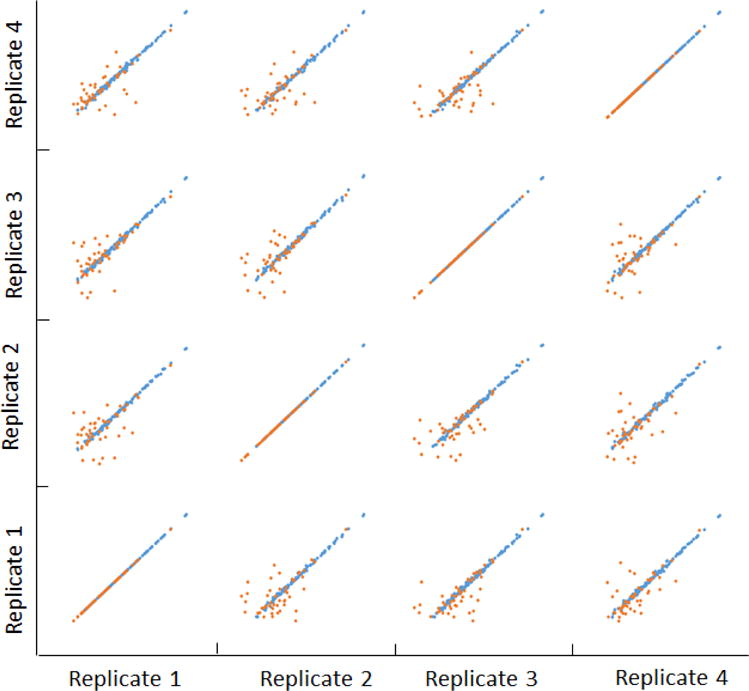
Correlation of replicate analysis of N-glycopeptides in plasma. The orange dots represent the glycopeptides with CVs more than 20%, and the blue dots represent the glycopeptides with CV less than 20%.
The optimized DIA method was used for the analysis of individual clinical samples, including 17 early stage PDAC (15 stage II and 2 stage I), 16 chronic pancreatitis, and 16 healthy controls. The patient demographic information is provided in Supplemental Table 1. The clinical samples were analyzed in a blinded, randomized fashion using a standardized sample preparation protocol. Changes of a N-linked glycopeptide (i.e. FATNTTLTK) derived from INV2 – the spike-in non-human standard, was evaluated through the entire sample set for the assessment of sample preparation and LC-MS/MS analysis. This standard peptide showed a consistent detection in the replicate analysis (Supplemental Figure 3). In the analysis of the individual clinical samples, we observed 28% of variation for this glycopeptide throughout the entire sample set. The average ratio of this INV2 peptide in comparison of cancer group with healthy group and chronic pancreatitis group is 1.2 (p-value 0.74) and 1.0 (p-value 0.41), respectively, reflecting a reasonable reproducibility of sample preparation and LC-MS/MS analysis to support the quantification of the endogenous plasma glycopeptides.
In the comparison of the PDAC group with the chronic pancreatitis and healthy controls, three N-linked glycopeptides (AAIPSALDTNSSK, ALGFENATQALGR and DAGVVCTNETR) derived from galectin 3 binding protein (LGALS3BP) are remarkable. Overall, the concentrations of these three glycosylated peptides were significantly elevated in the cancer group (Figure 2). Notably, for the fourth detected N-glycosylated peptide (TVIRPFYLTNSSGVD) derived from LGALS3BP, we were not able to accurately determine whether there was a significant difference between the PDAC and the control groups due to its low sensitivity. The identification and quantification information for the LGALS3BP N-glycosylated peptides are listed in Table 1. Peptide AAIPSALDTNSSK and ALGFENATQALGR were both able to separate the PDAC group from the NL and CP group with a p-value ≤ 0.05 and with an average ratio change ≥ 2-flod. On the other hand, while peptide DAGVVCTNETR was able to separate the PDAC group from the NL group (p-value ≤ 0.05, average ratio ≥ 2-fold), it did not show a significant difference between the PDAC group and the CP group. If this observation is further confirmed, it supports the notion that PDAC and CP share many clinical and molecular features [29–31], including aberrant N-glycosylation, and such protein glycosylation changes in disease may be site-specific.
Figure 2.
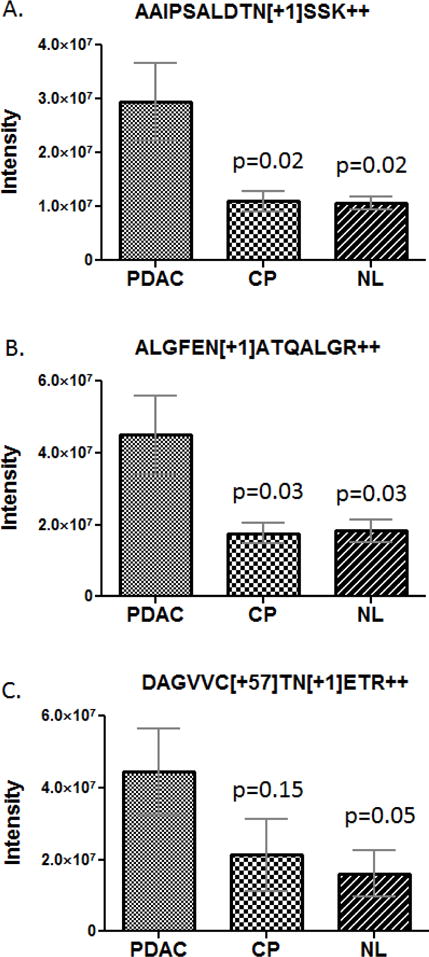
Measurement of N-glycosylated peptides derived from LGALS3BP in the plasma samples from pancreatic cancer patients (PDAC), chronic pancreatitis patients (CP) and healthy controls (NL). A) AAIPSALDTNSSK, B) ALGFENATQALGR, and C) DAGVVCTNETR. The error bars indicate the standard error of the mean.
Table 1.
Summary of N-glycosylated LGALS3BP peptides detected in the plasma samples
| Gene | Protein name | N-glycosylated peptide | Glycosite | PDAC/NL | PDAC/CP | Analytical information | ||||
|---|---|---|---|---|---|---|---|---|---|---|
| Avg ratio | p-value | Avg ratio | p-value | CV% | Avg RT (min) | RT stdev (min) | ||||
| LGALS3BP | Galectin-3 binding protein | ALGFEN[+1]ATQALGR++ | 69 | 2.5 | 0.031 | 2.6 | 0.026 | 6.1 | 69.84 | 0.12 |
| DAGVVC[+57]TN[+1]ETR++ | 125 | 2.8 | 0.046 | 2.1 | 0.146 | 2.5 | 30.71 | 0.06 | ||
| AAIPSALDTN[+1]SSK++ | 551 | 2.8 | 0.019 | 2.7 | 0.022 | 5.3 | 46.16 | 0.11 | ||
| TVIRPFYLTN[+1]SSGVD++ | 580 | 12.8 | 75.93 | 0.11 | ||||||
The level of circulating LGALS3BP has been associated with poor prognosis of cancer from various origins [32–34]. In the current study, we revealed that the plasma level of N-glycosylated LGALS3BP peptides that represent specific glycosylation sites were frequently elevated in the early stage PDAC. For each of the N-glycosylated peptide AAIPSALDTNSSK, ALGFENATQALGR and DAGVVCTNETR, their plasma level elevated in 59% of the cases in the PDAC group compared to the average level of the combined controls. Using an “OR” rule, 71% of the PDAC patients had at least one of these glycopeptides with a supranormal plasma level. Strikingly, the measurements of the two N-glycosylated peptides, AAIPSALDTNSSK and ALGFENATQALGR, were well correlated across all the samples tested (Figure 3), possibly reflecting a similar involvement of these glycosylation sites in the PDAC, if further validated. Further examination of all three N-glycosylated LGALS3BP peptides indicated that their plasma level appeared to be independent of the subjects’ age and gender, as shown in Figure 4A & B, respectively.
Figure 3.
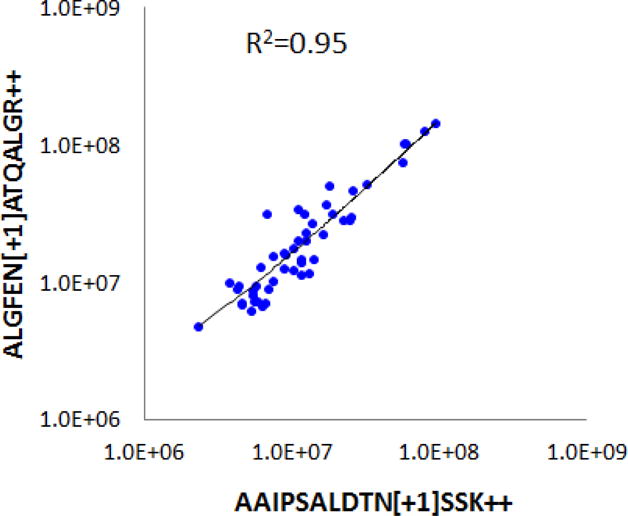
Correlation of mass spectrometric measurements of two N-glycosylated LGALS3BP peptides in the plasma samples: AAIPSALDTNSSK and ALGFENATQALGR.
Figure 4.
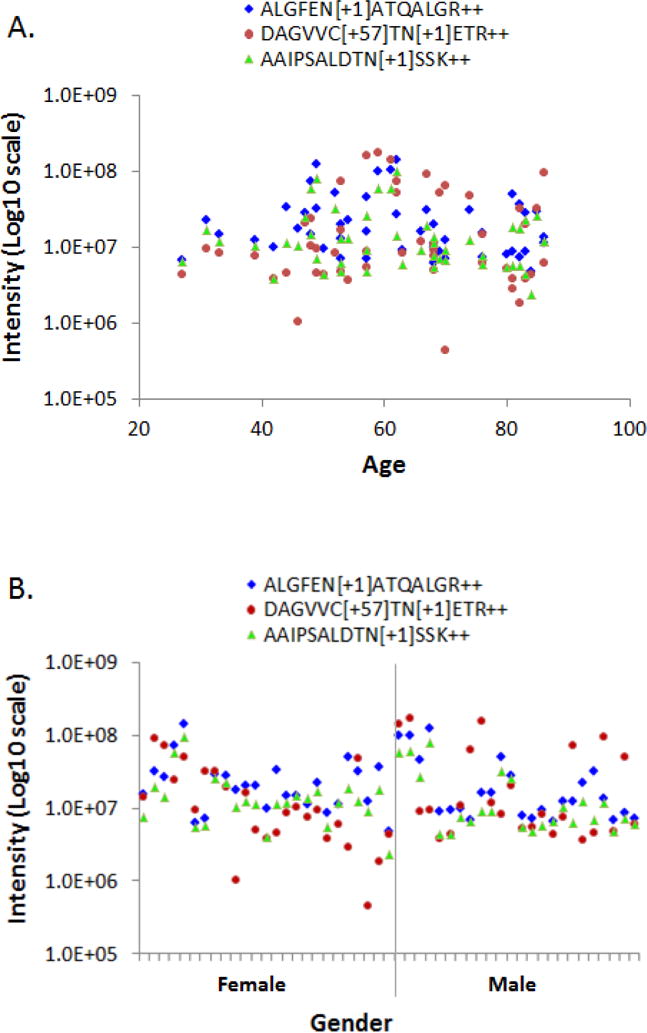
The measurement of the three N-glycosylated LGALS3BP peptides in the plasma samples showed no correlation with the subjects’ age and gender. A) Peptide measurement versus age, B) Peptide measurement versus gender.
Discussion
LGALS3BP is one of the major binding ligands for the galectin family, including galectin 1, galectin 3 and galectin 7. Implication of LGALS3BP in galectin network plays an important role in cancer progression and immune response, and is associated with cancer survival, metastasis and chemoresistance [35]. It was found that LGALS3BP and its binding partner galectin 1 and galectin 3 were over expressed in PDAC tumor tissue [36]; and the expression of galectin 1 is reversely associated with pancreatic cancer survival [37–40]. Concurrently, in the PDAC tumor tissue, three of the aforementioned N-glycosylated LGALS3BP peptides (except TVIRPFYLTNSSGVD) showed increased abundance compared to healthy and chronic pancreatitis controls, a convoluted effect resulted from the upregulation of LGALS3BP core protein expression and the increased level of N-glycosylation on these glycosylation sites [36]. Emerging evidences have further indicated that the malignancy-associated glycosylation could be not only protein specific, but also glycosylation site specific, reflecting the complexity of glycosylation events and the macro-heterogeneity of glycosylation changes implicated in cancer [36,41].
The information revealed suggested that site-specific N-glycosylation level of circulating LGALS3BP might frequently increase in the plasma of PDAC patients, consistent with its aberrant N-glycosylation observed in the PDAC tumor tissue. Most of the PDAC patients who had elevated level of N-glycosylated LGALS3BP peptides have localized stage II diseases. A previous study has suggested a link correlating LGALS3BP serum level with the size of cancer neoplasm [42]. Whether the elevation of the N-glycosylated LGALS3BP peptides may link to or define the prognosis or a subtype of PDAC remains unraveled and warrants further investigation. The abnormal change of N-glycosylation level on the specific sites of LGALS3BP appeared to occur at early stage of PDAC progression and may provide useful clues to elucidate the complex glycosylation events concerted with cancer reprograming in metabolism, glycan biosynthesis and immune response in driving PDAC tumorigenesis. Such cancer-associated aberrant N-glycosylation changes may be represented by the corresponding glycopeptides, which, in turn, can be quantitatively detected in clinical specimens using high-resolution mass spectrometry. The application of the spectral library based method for quantitative analysis of plasma N-glycopeptides has demonstrated the prospect of this technique in the large scale clinical analysis.
Supplementary Material
Acknowledgments
This work was supported in part with federal funds from the National Institutes of Health under grants R01CA180949, K25CA137222 and R21CA149772, the Donald E. Bocek Endowed Research Development Award in Pancreatic Cancer, and the University of Washington’s Proteomics Resource (UWPR95794).
References
- 1.Kobata A, Amano J. Altered glycosylation of proteins produced by malignant cells, and application for the diagnosis and immunotherapy of tumours. Immunol Cell Biol. 2005;83:429–439. doi: 10.1111/j.1440-1711.2005.01351.x. [DOI] [PubMed] [Google Scholar]
- 2.Ono M, Hakomori S. Glycosylation defining cancer cell motility and invasiveness. Glycoconj J. 2004;20:71–78. doi: 10.1023/B:GLYC.0000018019.22070.7d. [DOI] [PubMed] [Google Scholar]
- 3.Pinho SS, Reis CA. Glycosylation in cancer: mechanisms and clinical implications. Nat Rev Cancer. 2015;15:540–555. doi: 10.1038/nrc3982. [DOI] [PubMed] [Google Scholar]
- 4.Stowell SR, Ju T, Cummings RD. Protein glycosylation in cancer. Annu Rev Pathol. 2015;10:473–510. doi: 10.1146/annurev-pathol-012414-040438. [DOI] [PMC free article] [PubMed] [Google Scholar]
- 5.Pan S, Brentnall TA, Chen R. Glycoproteins and glycoproteomics in pancreatic cancer. World J Gastroenterol. 2016;22:9288–9299. doi: 10.3748/wjg.v22.i42.9288. [DOI] [PMC free article] [PubMed] [Google Scholar]
- 6.Brooks SA, Carter TM, Royle L, Harvey DJ, Fry SA, Kinch C, Dwek RA, Rudd PM. Altered glycosylation of proteins in cancer: what is the potential for new anti-tumour strategies. Anticancer Agents Med Chem. 2008;8:2–21. doi: 10.2174/187152008783330860. [DOI] [PubMed] [Google Scholar]
- 7.Dwek RA, Butters TD, Platt FM, Zitzmann N. Targeting glycosylation as a therapeutic approach. Nat Rev Drug Discov. 2002;1:65–75. doi: 10.1038/nrd708. [DOI] [PubMed] [Google Scholar]
- 8.Ludwig JA, Weinstein JN. Biomarkers in cancer staging, prognosis and treatment selection. Nat Rev Cancer. 2005;5:845–856. doi: 10.1038/nrc1739. [DOI] [PubMed] [Google Scholar]
- 9.Polanski M, Anderson NL. A list of candidate cancer biomarkers for targeted proteomics. Biomark Insights. 2007;1:1–48. [PMC free article] [PubMed] [Google Scholar]
- 10.Miyahara K, Nouso K, Morimoto Y, Kinugasa H, Kato H, Yamamoto N, Tsutsumi K, Kuwaki K, Onishi H, Ikeda F, Nakamura S, Shiraha H, Takaki A, Nakahara T, Miura Y, Asada H, Amano M, Nishimura S, Yamamoto K. Prognostic value of altered N-glycosylation of circulating glycoproteins in patients with unresectable pancreatic cancer treated with gemcitabine. Pancreas. 2015;44:551–556. doi: 10.1097/MPA.0000000000000321. [DOI] [PubMed] [Google Scholar]
- 11.Miyoshi E, Kamada Y. Application of glycoscience to the early detection of pancreatic cancer. Cancer Sci. 2016;107:1357–1362. doi: 10.1111/cas.13011. [DOI] [PMC free article] [PubMed] [Google Scholar]
- 12.Tan Z, Yin H, Nie S, Lin Z, Zhu J, Ruffin MT, Anderson MA, Simeone DM, Lubman DM. Large-scale identification of core-fucosylated glycopeptide sites in pancreatic cancer serum using mass spectrometry. J Proteome Res. 2015;14:1968–1978. doi: 10.1021/acs.jproteome.5b00068. [DOI] [PMC free article] [PubMed] [Google Scholar]
- 13.Yue T, Goldstein IJ, Hollingsworth MA, Kaul K, Brand RE, Haab BB. The prevalence and nature of glycan alterations on specific proteins in pancreatic cancer patients revealed using antibody-lectin sandwich arrays. Mol Cell Proteomics. 2009;8:1697–1707. doi: 10.1074/mcp.M900135-MCP200. [DOI] [PMC free article] [PubMed] [Google Scholar]
- 14.Pan S, Chen R, Aebersold R, Brentnall TA. Mass spectrometry based glycoproteomics–from a proteomics perspective. Mol Cell Proteomics. 2011;10:R110. doi: 10.1074/mcp.R110.003251. [DOI] [PMC free article] [PubMed] [Google Scholar]
- 15.Wuhrer M, Catalina MI, Deelder AM, Hokke CH. Glycoproteomics based on tandem mass spectrometry of glycopeptides. J Chromatogr B Analyt Technol Biomed Life Sci. 2007;849:115–128. doi: 10.1016/j.jchromb.2006.09.041. [DOI] [PubMed] [Google Scholar]
- 16.Zhang H, Li XJ, Martin DB, Aebersold R. Identification and quantification of N-linked glycoproteins using hydrazide chemistry, stable isotope labeling and mass spectrometry. Nat Biotechnol. 2003;21:660–666. doi: 10.1038/nbt827. [DOI] [PubMed] [Google Scholar]
- 17.Liu T, Qian WJ, Gritsenko MA, Camp DG, Monroe ME, Moore RJ, Smith RD. Human plasma N-glycoproteome analysis by immunoaffinity subtraction, hydrazide chemistry, and mass spectrometry. J Proteome Res. 2005;4:2070–2080. doi: 10.1021/pr0502065. [DOI] [PMC free article] [PubMed] [Google Scholar]
- 18.Pan S, Zhang H, Rush J, Eng J, Zhang N, Patterson D, Comb MJ, Aebersold RH. High-throughput proteome-screening approach for biomarker detection. Mol Cell Proteomics. 2005;4:182–190. doi: 10.1074/mcp.M400161-MCP200. [DOI] [PubMed] [Google Scholar]
- 19.Stahl-Zeng J, Lange V, Ossola R, Eckhardt K, Krek W, Aebersold R, Domon B. High sensitivity detection of plasma proteins by multiple reaction monitoring of N-glycosites. Mol Cell Proteomics. 2007;6:1809–1817. doi: 10.1074/mcp.M700132-MCP200. [DOI] [PubMed] [Google Scholar]
- 20.Liu Y, Huttenhain R, Surinova S, Gillet LC, Mouritsen J, Brunner R, Navarro P, Aebersold R. Quantitative measurements of N-linked glycoproteins in human plasma by SWATH-MS. Proteomics. 2013;13:1247–1256. doi: 10.1002/pmic.201200417. [DOI] [PubMed] [Google Scholar]
- 21.Liu Y, Chen J, Sethi A, Li QK, Chen L, Collins B, Gillet LC, Wollscheid B, Zhang H, Aebersold R. Glycoproteomic analysis of prostate cancer tissues by SWATH mass spectrometry discovers N-acylethanolamine acid amidase and protein tyrosine kinase 7 as signatures for tumor aggressiveness. Mol Cell Proteomics. 2014;13:1753–1768. doi: 10.1074/mcp.M114.038273. [DOI] [PMC free article] [PubMed] [Google Scholar]
- 22.Nigjeh EN, Chen R, Brand RE, Petersen GM, Chari ST, von Haller PD, Eng JK, Feng Z, Yan Q, Brentnall TA, Pan S. Quantitative Proteomics Based on Optimized Data-Independent Acquisition in Plasma Analysis. J Proteome Res. 2017;16:665–676. doi: 10.1021/acs.jproteome.6b00727. [DOI] [PMC free article] [PubMed] [Google Scholar]
- 23.Deutsch EW, Mendoza L, Shteynberg D, Slagel J, Sun Z, Moritz RL. Trans-Proteomic Pipeline, a standardized data processing pipeline for large-scale reproducible proteomics informatics. Proteomics Clin Appl. 2015 doi: 10.1002/prca.201400164. [DOI] [PMC free article] [PubMed] [Google Scholar]
- 24.Keller A, Eng J, Zhang N, Li XJ, Aebersold R. A uniform proteomics MS/MS analysis platform utilizing open XML file formats. Mol Syst Biol. 2005;1:2005. doi: 10.1038/msb4100024. [DOI] [PMC free article] [PubMed] [Google Scholar]
- 25.Eng JK, Jahan TA, Hoopmann MR. Comet: an open-source MS/MS sequence database search tool. Proteomics. 2013;13:22–24. doi: 10.1002/pmic.201200439. [DOI] [PubMed] [Google Scholar]
- 26.Keller A, Nesvizhskii AI, Kolker E, Aebersold R. Empirical statistical model to estimate the accuracy of peptide identifications made by MS/MS and database search. Analytical Chemistry. 2002;74:5383–5392. doi: 10.1021/ac025747h. [DOI] [PubMed] [Google Scholar]
- 27.Maclean B, Tomazela DM, Shulman N, Chambers M, Finney GL, Frewen B, Kern R, Tabb DL, Liebler DC, Maccoss MJ. Skyline: an open source document editor for creating and analyzing targeted proteomics experiments. Bioinformatics. 2010;26:966–968. doi: 10.1093/bioinformatics/btq054. [DOI] [PMC free article] [PubMed] [Google Scholar]
- 28.Egertson JD, Maclean B, Johnson R, Xuan Y, Maccoss MJ. Multiplexed peptide analysis using data-independent acquisition and Skyline. Nat Protoc. 2015;10:887–903. doi: 10.1038/nprot.2015.055. [DOI] [PMC free article] [PubMed] [Google Scholar]
- 29.Chen R, Brentnall TA, Pan S, Cooke K, Moyes KW, Lane Z, Crispin DA, Goodlett DR, Aebersold R, Bronner MP. Quantitative proteomics analysis reveals that proteins differentially expressed in chronic pancreatitis are also frequently involved in pancreatic cancer. Mol Cell Proteomics. 2007;6:1331–1342. doi: 10.1074/mcp.M700072-MCP200. [DOI] [PubMed] [Google Scholar]
- 30.Crnogorac-Jurcevic T, Gangeswaran R, Bhakta V, Capurso G, Lattimore S, Akada M, Sunamura M, Prime W, Campbell F, Brentnall TA, Costello E, Neoptolemos J, Lemoine NR. Proteomic analysis of chronic pancreatitis and pancreatic adenocarcinoma. Gastroenterology. 2005;129:1454–1463. doi: 10.1053/j.gastro.2005.08.012. [DOI] [PubMed] [Google Scholar]
- 31.Pan S, Chen R, Stevens T, Bronner MP, May D, Tamura Y, McIntosh MW, Brentnall TA. Proteomics portrait of archival lesions of chronic pancreatitis. PLoS One. 2011;6:e27574. doi: 10.1371/journal.pone.0027574. [DOI] [PMC free article] [PubMed] [Google Scholar]
- 32.Grassadonia A, Tinari N, Natoli C, Yahalom G, Iacobelli S. Circulating autoantibodies to LGALS3BP: a novel biomarker for cancer. Dis Markers. 2013;35:747–752. doi: 10.1155/2013/214595. [DOI] [PMC free article] [PubMed] [Google Scholar]
- 33.Iacobelli S, Sismondi P, Giai M, D’Egidio M, Tinari N, Amatetti C, Di Stefano P, Natoli C. Prognostic value of a novel circulating serum 90K antigen in breast cancer. Br J Cancer. 1994;69:172–176. doi: 10.1038/bjc.1994.29. [DOI] [PMC free article] [PubMed] [Google Scholar]
- 34.Zeimet AG, Natoli C, Herold M, Fuchs D, Windbichler G, Daxenbichler G, Iacobelli S, Dapunt O, Marth C. Circulating immunostimulatory protein 90K and soluble interleukin-2-receptor in human ovarian cancer. Int J Cancer. 1996;68:34–38. doi: 10.1002/(SICI)1097-0215(19960927)68:1<34::AID-IJC7>3.0.CO;2-Y. [DOI] [PubMed] [Google Scholar]
- 35.Grassadonia A, Tinari N, Iurisci I, Piccolo E, Cumashi A, Innominato P, D’Egidio M, Natoli C, Piantelli M, Iacobelli S. 90K (Mac-2 BP) and galectins in tumor progression and metastasis. Glycoconj J. 2004;19:551–556. doi: 10.1023/B:GLYC.0000014085.00706.d4. [DOI] [PubMed] [Google Scholar]
- 36.Pan S, Chen R, Tamura Y, Crispin DA, Lai LA, May DH, McIntosh MW, Goodlett DR, Brentnall TA. Quantitative glycoproteomics analysis reveals changes in N-glycosylation level associated with pancreatic ductal adenocarcinoma. J Proteome Res. 2014;13:1293–1306. doi: 10.1021/pr4010184. [DOI] [PMC free article] [PubMed] [Google Scholar]
- 37.Chen R, Pan S, Ottenhof NA, de Wilde RF, Wolfgang CL, Lane Z, Post J, Bronner MP, Willmann JK, Maitra A, Brentnall TA. Stromal galectin-1 expression is associated with long-term survival in resectable pancreatic ductal adenocarcinoma. Cancer Biol Ther. 2012;13:899–907. doi: 10.4161/cbt.20842. [DOI] [PMC free article] [PubMed] [Google Scholar]
- 38.Chen R, Dawson DW, Pan S, Ottenhof NA, de Wilde RF, Wolfgang CL, May DH, Crispin DA, Lai LA, Lay AR, Waghray M, Wang S, McIntosh MW, Simeone DM, Maitra A, Brentnall TA. Proteins associated with pancreatic cancer survival in patients with resectable pancreatic ductal adenocarcinoma. Laboratory Investigation. 2015;95:43–55. doi: 10.1038/labinvest.2014.128. [DOI] [PMC free article] [PubMed] [Google Scholar]
- 39.Iuga C, Seicean A, Iancu C, Buiga R, Sappa PK, Volker U, Hammer E. Proteomic identification of potential prognostic biomarkers in resectable pancreatic ductal adenocarcinoma. Proteomics. 2014;14:945–955. doi: 10.1002/pmic.201300402. [DOI] [PubMed] [Google Scholar]
- 40.Martinez-Bosch N, Fernandez-Barrena MG, Moreno M, Ortiz-Zapater E, Munne-Collado J, Iglesias M, Andre S, Gabius HJ, Hwang RF, Poirier F, Navas C, Guerra C, Fernandez-Zapico ME, Navarro P. Galectin-1 drives pancreatic carcinogenesis through stroma remodeling and Hedgehog signaling activation. Cancer Res. 2014;74:3512–3524. doi: 10.1158/0008-5472.CAN-13-3013. [DOI] [PMC free article] [PubMed] [Google Scholar]
- 41.Jones J, Krag SS, Betenbaugh MJ. Controlling N-linked glycan site occupancy. Biochim Biophys Acta. 2005;1726:121–137. doi: 10.1016/j.bbagen.2005.07.003. [DOI] [PubMed] [Google Scholar]
- 42.Wu KL, Chen HH, Pen CT, Yeh WL, Huang EY, Hsiao CC, Yang KD. Circulating Galectin-1 and 90K/Mac-2BP Correlated with the Tumor Stages of Patients with Colorectal Cancer. Biomed Res Int. 2015;2015:306964. doi: 10.1155/2015/306964. [DOI] [PMC free article] [PubMed] [Google Scholar]
Associated Data
This section collects any data citations, data availability statements, or supplementary materials included in this article.