

Abstract
Background & Aims
Intraductal papillary mucinous neoplasias (IPMN) are precancerous cystic lesions that can develop into pancreatic ductal adenocarcinomas (PDACs). These large macroscopic lesions are frequently detected during medical imaging, but it is unclear how they form or progress to PDAC. We aimed to identify cells that form IPMNs and mutations that promote IPMN development and progression.
Methods
We generated mice with disruption of Pten specifically in ductal cells (Sox9CreERT2;Ptenflox/flox;R26RYFP or PtenΔDuct/ΔDuct mice) and used PtenΔDuct/+ and Pten+/+ mice as controls. We also generated KrasG12D;PtenΔDuct/ΔDuct and KrasG12D;PtenΔDuct/+ mice. Pancreata were collected when mice were 26 weeks–14.5 months old and analyzed by histology, immunohistochemistry, and electron microscopy. We performed multiplexed droplet digital PCR to detect spontaneous Kras mutations in PtenΔDuct/ΔDuct mice and study the effects of Ras pathway activation on initiation and progression of IPMNs. We obtained 2 pancreatic sections from a patient with an invasive pancreatobiliary IPMN and analyzed the regions with and without the invasive IPMN (control tissue) by immunohistochemistry.
Results
Mice with ductal cell-specific disruption of Pten but not control mice developed sporadic, macroscopic, intraductal papillary lesions histologic and molecular features of human IPMNs. PtenΔDuct/ΔDuct mice developed IPMNs several subtypes. In PtenΔDuct/ΔDuct mice, 31.5% of IPMNs became invasive; invasion was associated with spontaneous mutations in Kras. KrasG12D;PtenΔDuct/ΔDuct mice all developed invasive IPMNs within 1 month. KrasG12D;PtenΔDuct/+ mice also all developed IPMN, predominately of the pancreatobiliary subtype, and 70% developed PDAC. In all models, IPMNs and PDAC expressed the duct-specific lineage tracing marker yellow fluorescent protein. In immunohistochemical analyses, we found that the invasive human pancreatobiliary IPMN tissue had lower levels of PTEN and increased levels of phosphorylated (activated) ERK compared with healthy pancreatic tissue.
Conclusions
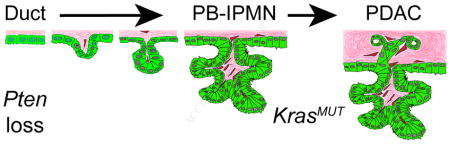
In analyses of mice with ductal cell-specific disruption of Pten, with or without activated Kras, we found evidence for a ductal cell origin of IPMNs. We also showed that PTEN loss and activated Kras have synergistic effects in promoting development of IPMN and progression to PDAC.
Keywords: pancreatic cancer, oncocytic, PanIN, gastric
Graphical abstract
INTRODUCTION
Pancreatic ductal adenocarcinoma (PDAC) is a highly lethal cancer, with a 5-year survival rate around 9%. PDAC is preceded by the formation of non-invasive premalignant lesions. Based on histological appearance and size, premalignant lesions have been classified into three major subtypes, namely microscopic pancreatic intraepithelial neoplasias (PanIN), macroscopic intraductal papillary mucinous neoplasias (IPMN), and mucinous cystic neoplasias (MCN). In recent years, the cystic neoplasias (IPMN and MCN) have gained attention because improvements in medical imaging have led to higher rates of incidental identification of these lesions.1 IPMN comprise 20–50% of all pancreatic cystic neoplasms.1 While the 5-year survival rate of individuals with non-invasive IPMN is excellent (>77%), the presence of an invasive component drops the 5-year survival rate to 34–62%.1 Currently, the malignant potential of pancreatic cysts is difficult to predict. To enable effective selection for curative surgical intervention, strategies that distinguish benign cysts from lesions with high malignant potential are needed.
An important criterion influencing IPMN prognosis is the location within the pancreatic ductal system. While branch-duct IPMN has a low risk for malignant progression, individuals with main duct IPMN are at high risk.1 The histological IPMN subtype is another prognostic criterion, with intestinal, oncocytic, and gastric IPMN having a more favorable prognosis than pancreatobiliary IPMN.2, 3 However, high confidence biomarkers to distinguish IPMN with low and high malignant potential or IPMN subtypes are lacking because very little is known about IPMN development.
Several reports have shown that dysregulation of the phosphatidylinositol 3-kinase (PI3K) signaling pathway is associated with IPMN-PDAC compared to conventional PDAC.4–8 In addition, genetic studies suggest that gastric and pancreatobiliary IPMN have a higher frequency of KRAS mutations than intestinal and oncocytic IPMN.9, 10 However, the lack of a genetically tractable animal model for IPMN has hampered studies of how these mutations affect the initiation, progression, or subtype identity of IPMN.
IPMN-like cystic lesions have been observed in several mouse models. For example, KrasG12D expression in combination with Elastase promoter-driven TGF-alpha expression, or loss of Brg1, Activin receptor type 1b, TIFγ, or Smad4 causes cystic, IPMN-like lesions.11–15 However, the genetic events in these studies were induced widely in embryonic pancreatic precursors, leading to genetic changes in all pancreatic cells and consequently displacement of the majority of normal pancreatic tissue by cystic and PanIN lesions. The similarity of these mouse models to human IPMN, where lesions are usually solitary, is limited. Moreover, the pancreas-wide induction of the genetic events precluded studies addressing the cellular origin of the cystic lesions and associated PDAC. von Figura and colleagues recently proposed a ductal origin for IPMN based on their observation that ductal-cell-specific manipulation of Kras and Brg1 induced structures resembling precancerous lesions.14 However, because these animals could only be followed for six weeks, it remained unclear whether these lesions develop into macroscopic IPMN that progress to PDAC. Thus, mouse models fully recapitulating the features of human IPMN and associated PDAC are still missing.
Here, we use ductal-cell-specific manipulation of the PI3K pathway to create a new mouse model that forms macroscopic IPMN lesions of multiple histological subtypes, recapitulating the clinicopathological features of human IPMN. Our analysis of this model provides insight into the cellular origin of IPMN and the subtype-specific genetic mutations that underlie IPMN formation and progression.
Methods
Mice
Sox9CreERT2,16 Ptf1aCreER,17 Ptenflox,18 LSL-KrasG12D,19 R26RYFP 20 mice have been described previously and were maintained on a mixed C57BL/6 and CD1 background (Charles River). Tamoxifen (Sigma-Aldrich) was dissolved in corn oil and administered subcutaneously at 5 mg per 40 grams of body weight per injection. Sox9CreERT2;Ptenflox/+;R26RYFP (PtenΔDuct/+) and Sox9CreERT2;Pten+/+;R26RYFP (Pten+/+) mice were used as controls for Sox9CreERT2;Ptenflox/flox;R26RYFP (PtenΔDuct/ΔDuct) mice and Ptf1aCreER;Ptenflox/+;R26RYFP (PtenΔAcinar/+) and Ptf1aCreER;Pten+/+;R26RYFP mice for Ptf1aCreER;Ptenflox/flox;R26RYFP (PtenΔAcinar/ΔAcinar) mice.
Histology and Immunohistochemical Analysis
Paraffin-embedded sections were subjected to hematoxylin (Mayer’s or Harris formulations), eosin, or immunohistochemical staining as described.21, 22 High- or low-resolution scans of entire slides were generated using a Zeiss AxioScan.Z1 or a Zeiss Apoptome microscope, respectively. In combination with necropsy images, whole slide images were used to identify pancreatic duct dilation and presence of papillary nodules/lesions. These images were also used to determine the IPMN subtype, IPMN location, as well as pre-IPMN and PanIN numbers. Papillary lesions resembling larger IPMN and associated with microscopic, but not macroscopic, duct dilation were classified as a pre-IPMN. Macroscopic tumors associated with lesions in microscopically, but not macroscopically, dilated ducts were classified as pre-IPMN- or PanIN-associated PDAC depending on the presence of papillae. All other microscopic preneoplastic changes in the duct were classified as PanIN.
A list of primary and secondary antibodies utilized for immunohistochemistry can be found in Table S2. The percentage of Ki67 positive cells in large (main and interlobular ducts) and small ducts (intercalated and terminal ducts and centroacinar cells) was quantified from Ki67 stained slides counterstained with Hematoxylin. At least ten 20x images from each animal were analyzed. Electron microscopy was performed as described.21 Immunohistochemical staining for pERK was evaluated by estimating the percentage of pERK-positive cells with signal intensity equivalent to a positive control. Strongly positive (+++) lesions had signal in > 50% of cells, while weakly positive samples (+) had signal in < 10% of cells. Moderately positive (++) lesions fell between these criteria. No observed staining was scored as “not detected”. All IPMN and preIPMN/PanIN lesions in PtenΔDuct/ΔDuct mice were analyzed. For Muc1, Muc2, and Cldn18 immunohistochemistry, 3 to 15 mice with lesions representing those in the common and main duct were evaluated. Pictures show representative images. PTEN immunohistochemistry signal was scored as “lost” if greater than 80% of the cells in the invasive epithelium with atypical nuclear changes did not have signal. This latter distinction was made because PTEN signal was detected in stromal cells and sometimes in the epithelial wall of the cyst.
Allele-Specific PCR, Droplet Digital PCR, and Tumor Genotyping
Areas of interest were isolated from paraffin-embedded sections using a sterilized razor blade. Non-tumor areas and IPMN/PDAC areas were obtained from the same section where possible. Paraffin was removed using xylene, samples were rehydrated, and genomic DNA extracted by heating samples at 55 °C overnight in a 50 mM Tris-HCl pH 8.0, 20 mM NaCl, 1 mM EDTA pH 8.0, and 1% SDS. DNA was isolated by phenol chloroform extraction using 5-PRIME Phase Lock Gel™ (Fisher-FP2302820) and DNA concentration determined using NanoDrop (Thermo Scientific) or Qubit. The following primers were used to detect the murine KrasG12D mutation using allele specific PCR: wild-type forward primer 5′-ATAAACTTGTGGTGGTTGGAGCTTG-3′; G12D forward primer 5′-ATAAACTTGTGGTGGTTGGAGCTTA-3′; and a common reverse primer 5′-GACTGTAGAGCAGCGTTACC-3′. Primers for the Pten allele were used as described.23
Mutant Kras was quantified using a RainDrop Plus Digital PCR System (RainDance Technologies), using a modified version of a described protocol (Pratt, E. et al. unpublished data and 24). Briefly, DNA (0.88 – 15.9 ng; mean: 5.0 ng) was partitioned into picoliter-sized droplets prior to a short PCR (98°C for 3 min; 9 cycles of 98°C for 10 s, 66.5°C for 3 min, 72°C for 30 s; 72°C for 5 min) using Q5 High Fidelity 2x Master Mix (New England Biolabs), 0.5× droplet stabilizer, and 500 nM Kras-specific primers (F: AGGCCTGCTGAAAATGACTGAG; R: TGAATTAGCTGTATCGTCAAGGCG) to amplify the input DNA. Amplification was performed within each individual droplet, thereby preserving Kras allele frequencies. Droplets were de-emulsified and amplified DNA was isolated using a MiniElute PCR Purification kit (Qiagen) and again partitioned into droplets for PCR (95°C for 10 min; 45 cycles of 95° C for 15 s, 60°C for 1 min; 98°C for 10 min) using TaqMan Genotyping Master Mix (Applied Biosystems), 1× droplet stabilizer, 900 nM of the aforementioned primers, and 100 nM each of Kras allele-specific TaqMan probes (WT: VIC-TTGGAGCTGGTGGCGT-MGBNFQ; G12C: 6FAM-TGGAGCTTGTGGCGT-MGBNFQ; G12D: 6FAM-TGGAGCTGATGGCGT-MGBNFQ; G12R: 6FAM-TGGAGCTCGTGGCGT-MGBNFQ; G12V: 6FAM-TGGAGCTGTTGGCGT-MGBNFQ). Absolute quantification of wild-type or mutant Kras-positive droplets was performed by detecting fluorescence within individual droplets using RainDrop Analyst II software. Baseline was the mean number of mutant droplets in controls and positive mutant populations were defined as those exceeding that mean plus two standard deviations.
Statistical Analysis
P values were calculated using the two-tailed Student’s t test with Excel software.
Study approval
All animal experiments described herein were approved by the University of California, San Diego Institutional Animal Care and Use Committees (S08215).
Results
Loss of Pten in Pancreatic Ductal Cells Leads to Macroscopic Cystic IPMN Lesions
To test whether PTEN plays a role in IPMN formation, we used a genetic strategy to inducibly ablate Pten specifically in pancreatic ductal cells of mice. To simultaneously follow the fate of recombined cells that lost PTEN, tamoxifen-inducible Sox9CreERT2 mice16 were crossed with mice harboring a Cre-recombinase dependent YFP reporter allele (R26RYFP)20 and a “floxed” allele of the Pten gene18 to generate Sox9CreERT2;Ptenflox/flox;R26RYFP (PtenΔDuct/ΔDuct), Sox9CreERT2;Ptenflox/+;R26RYFP (PtenΔDuct/+), and Sox9CreERT2;Pten+/+;R26RYFP mice (Pten+/+) (Figure 1A). At four weeks of age, mice were injected three times with tamoxifen to induce recombination of the Pten floxed allele and expression of YFP (Figure 1B). At one month after tamoxifen injection, we observed widespread expression of YFP in large ducts, small ducts, and centroacinar cells (Figure 1C and 1D, centroacinar cells, insets). As expected, PTEN expression was lost throughout the ductal tree of PtenΔDuct/ΔDuct mice, including centroacinar cells (Figure 1E and 1F, centroacinar cells, arrows in insets). These results show that we can efficiently ablate Pten in ductal cells.
Figure 1. Pten deletion in pancreatic ductal cells increases cell proliferation in large ducts.

(A) Strategy to generate Sox9CreERT2;Ptenflox/flox;R26RYFP (PtenΔDuct/ΔDuct), Sox9CreERT2;Ptenflox/+;R26RYFP (PtenΔDuct/+), and Sox9CreERT2;Pten+/+;R26RYFP (Pten+/+) mice. Tamoxifen (TM) injection induces recombination of Ptenflox and R26RYFP alleles in Sox9-expressing cells. (B) PtenΔDuct/ΔDuct, PtenΔDuct/+, and Pten+/+ mice were injected with TM on postnatal days 28, 30, and 32 and analyzed at 2 or 6 to 14.5 months of age. (C–F) Immunohistochemistry for YFP (C, D) and PTEN (E, F) in 2-month-old Pten+/+ and PtenΔDuct/ΔDuct mice. Insets show centroacinar/terminal duct cells (arrows in E, F). (G–L) Immunohistochemistry for Ki67 in 2- (G, H), 7.5- (I, J), and 12-month-old (K, L) control and PtenΔDuct/ΔDuct mice. (M) Quantification of Ki67+ cells in small and large ducts in control and PtenΔDuct/ΔDuct mice (n=3). Mo, months. Values are shown as mean ± SEM. *p<0.05 and **p<0.01. Scale bars: 50 μm (C–L).
To determine the effect of ductal Pten loss, we examined pancreata of 2- to 14.5-month-old PtenΔDuct/ΔDuct mice. The first noticeable histological change was detected at 6 to 7.5 months of age, when we observed hyperplasia in large sections of the main and large ducts in PtenΔDuct/ΔDuct mice (Figure S1A and S1B). To examine whether increased ductal cell proliferation caused large duct hyperplasia in the absence of Pten, we quantified the percentage of proliferating cells located in large and small ducts at 2, 7.5, and 12 months of age in PtenΔDuct/ΔDuct and control mice using immunohistochemistry against Ki67 (Figure 1G–L). At 7.5 months of age, the proliferation index of large ducts was 18-fold higher in PtenΔDuct/ΔDuct than control mice and remained 10-fold higher at 12 months of age (Figure 1M). Pten loss had less of an effect on small duct cell proliferation (Figure 1M). Consistent with this observation, electron microscopy of pancreata at 7.5 months revealed no expansion of the centroacinar/terminal ductal cell compartment in PtenΔDuct/ΔDuct mice (Figure S1C and S1D, arrows). Thus, loss of Pten in ductal cells leads to proliferation and hyperplasia predominantly of large ducts.
To examine whether the observed ductal hyperplasia in 6–7 month-old PtenΔDuct/ΔDuct mice was associated with neoplasia, we examined a large cohort of PtenΔDuct/ΔDuct (n=43), PtenΔDuct/+ (n=27), and Pten+/+ (n=34) mice at 6 to 14.5 months. At necropsy, we observed that the main pancreatic duct and/or common duct was visibly enlarged and dilated in 15 out of 43 PtenΔDuct/ΔDuct mice (Figure 2A and 2B, arrows point to area of main duct). This phenotype was not observed in any of the 61 PtenΔDuct/+ and Pten+/+ mice. In these 15 PtenΔDuct/ΔDuct mice, the cross-sectional diameters of the dilated pancreatic and common ducts ranged from 438 to 2800 μm compared to 125 μm for the main pancreatic duct and 150–230 μm for the common duct in control mice (Figure 2C,C′ and 2D,D′). The dilated ducts in PtenΔDuct/ΔDuct mice displayed papillae or nodules with fibrovascular cores (Figure 2D′, insets; Figure 2E, 2F, and Table 1). These papillae and nodules were macroscopically visible, were continuous with the ductal epithelium (Figure 2D′, insets; Figure 2F, arrow), lacked the characteristic estrogen-receptor positive ovarian-type stroma associated with MCN (Figure S2A and S2B), and had mucinous secretions (Figure S2C). The focal nature of these macroscopic lesions and their sporadic occurrence in only 34% of PtenΔDuct/ΔDuct mice, suggests a secondary clonal event leading to expansion of cells within the Pten negative ductal epithelium. Collectively, the features observed in pancreata from PtenΔDuct/ΔDuct mice recapitulated hallmarks of human main duct IPMN, namely dilation of the main duct and grossly visible, focal papillary lesions contiguous with the main duct.1 Based on these similarities, we classified the lesions in PtenΔDuct/ΔDuct mice as main duct or common duct IPMN (Table 1).
Figure 2. Pten deletion in pancreatic ductal cells causes invasive macroscopic IPMN lesions.

(A, B) In situ image showing the main pancreatic duct (arrow) in control or PtenΔDuct/ΔDuct mice. (C–H) H&E staining of pancreatic sections from control and PtenΔDuct/ΔDuct mice. Outlined areas in C and D are magnified in C′ and D′, respectively. Arrows in C′ and D′ indicate the main pancreatic duct. IPMN of oncocytic (O-IPMN) and pancreatobiliary (PB-IPMN) subtypes are outlined and magnified in insets in D′. PtenΔDuct/ΔDuct mice exhibit pancreatobiliary (E) and oncocytic (F) IPMN, as well as PB-IPMN-associated PDAC (G, G′) and PanIN-associated PDAC (H, H′). Arrow in F points to transition between normal ductal epithelium and the papillary nodule. Outlined areas in G and H are magnified in G′ and H′, respectively. The inset in H shows PanIN at high magnification. Asterisk in H indicates dilated lumen of the main duct. Scale bars: 5 mm (A–D), 2 mm (C′, D′), 100 μm (E, F, G′, and H′), 500 μm (G, H).
Table 1.
Characteristics of pancreatic lesions in PtenΔDuct/ΔDuct mice.
| Mouse ID | Age (months) | IPMN Histology | IPMN Location | Invasive/PDAC | pErk | KrasG12D | Pre-IPMN | PanIN |
|---|---|---|---|---|---|---|---|---|
| 284 | 14 | Oncocytic | C | ND | +# | ND | 2 Onc | 2 |
| 58 | 12 | Oncocytic | C | ND | ND | ND | 0 | 2 |
| 98 | 12 | Oncocytic | T | Y* | ND | ND | 0 | 6 |
| Pancreatobiliary | H | ND | + | not tested | ||||
| 64 | 12 | Pancreatobiliary | H, C | Y | +++ | Y | 0 | 4 |
| 130 | 12 | Pancreatobiliary | T | ND | ND | ND | 0 | 3 |
| 132 | 12 | Pancreatobiliary | T | ND | ND | ND | 0 | 3 |
| Pancreatobiliary | C | Y* | ND | ND | ||||
| 150 | 12 | Pancreatobiliary | C | Y* | +++ | Y | 1 Onc | 3 |
| 247 | 13.5 | Pancreatobiliary | T | ND | ND | ND | 1 PB | 7 |
| 168 | 13 | Pancreatobiliary | T | Y* | +++ | Y | 0 | 18** |
| Pancreatobiliary | H | Y* | ++ | ND | ||||
| 63 | 11 | Pancreatobiliary | H | ND | +++ | ND | 1 PB | 14** |
| Pancreatobiliary | H | Y* | ++ | ND | ||||
| 263 | 10.5 | Pancreatobiliary | C | ND | ++ | ND | 2 PB | 5 |
| 246 | 9 | Pancreatobiliary | C | ND | ND | ND | 1 PB | 1 |
| 252 | 7 | Pancreatobiliary | C | ND | ND | ND | 0 | 0 |
| 93 | 8 | Pancreatobiliary | H, T | ND | + | ND | 0 | 0 |
| 24 | 6 | Oncocytic | H, T | ND | +# | ND | 5 Onc | 2 |
ND: not detected; Y: Present; Onc: oncocytic IPMN; PB: pancreatobiliary IPMN; Location: H, pancreatic head; T, pancreatic tail; C, common duct
Denotes microscopic invasive adenocarcinomas.
PanIN3 and associated PDAC observed.
Denotes lesions where pErk signal was present in the epithelial wall of the lesion, but not the papilla.
When more than one mass or lesion was present and these lesions were in distinct locations within the pancreas, they were recorded as separate lesions rather than as a lesion with a mixed phenotype.
IPMN Lesions in PtenΔDuct/ΔDuct Mice Represent Two IPMN Subtypes
Morphological differences have led to the classification of human IPMNs into different subtypes.1 The papillae in PtenΔDuct/ΔDuct mice had two morphologically different appearances, suggesting different subtype identity. One type of papillae exhibited a complex arborizing morphology with predominantly single-cell-layered epithelium reminiscent of human pancreatobiliary IPMN (Figure 2D′, PB-IPMN; Figure 2E). The other type was composed of tightly packed, multiple-cell-layered epithelial folds containing cells with eosinophilic, granular cytoplasm and distinct nucleoli (Figure 2D′, O-IPMN; Figure 2F), similar to human oncocytic IPMN. Typically, only one subtype was present in an individual animal; however, in one mouse both subtypes were observed, albeit in distinct foci (Figure 2D′; Table 1). Overall, pancreatobiliary IPMN was more common than oncocytic IPMN (15 versus 4 lesions).
To further investigate the similarity of IPMN-like lesions in PtenΔDuct/ΔDuct mice with human oncocytic and pancreatobiliary IPMN, we analyzed Mucin 1 (Muc1) and Mucin 2 (Muc2) expression. Similar to human pancreatobiliary and oncocytic subtypes, which express Muc1, but not Muc2,2 both types of papillary lesions in PtenΔDuct/ΔDuct mice were Muc1-positive and Muc2-negative (Figure S2D–S2G). We further confirmed the preneoplastic nature of these lesions by showing that lesions of both subtypes express Claudin 18 (Cldn18) (Figure S2H and S2I), which is expressed in neoplastic lesions but not in normal mouse ductal cells.25 Together, these data suggest that the PTEN-negative ductal epithelium gives rise to papillae representing the murine counterparts of pancreatobiliary or oncocytic subtypes of human IPMN.
Invasive PDAC Predominantly Associates with Pancreatobiliary IPMN in PtenΔDuct/ΔDuct Mice
As IPMN is a precursor lesion for invasive carcinoma,1 we next examined whether IPMNs in PtenΔDuct/ΔDuct mice were associated with PDAC. At necropsy, we observed a mass visible to the naked eye on the wall of the dilated duct in 1 out of the 15 PtenΔDuct/ΔDuct mice with grossly visible IPMN. Histological analysis revealed well-differentiated PDAC directly contiguous with a pancreatobiliary-type IPMN (Figure 2G,G′), suggesting IPMN progression to invasive carcinoma. In addition to the one macroscopic PDAC, we observed small microscopic invasive tumors or cellular invasion directly associated with five pancreatobiliary and one oncocytic IPMN in PtenΔDuct/ΔDuct mice (Table 1). Thus, as in human IPMN,1 a higher percentage of pancreatobiliary compared to oncocytic IPMN became invasive in PtenΔDuct/ΔDuct mice.
In two mice with IPMN, microscopic tumors distant from the IPMN were also observed (Figure 2H,H′). These small well-differentiated tumors were directly adjacent to large ducts with an inflammatory reactive atypia that transitioned into epithelium with PanIN features (Figure 2H, inset; Table 1, mice #63 and #168). This resembles human IPMN-PDAC, where PDAC can be found in regions distinct from the IPMN.3 Since we observed PanIN-associated PDAC only in mice with IPMN (Table 1) and significant main duct distention and metaplasia, PanIN-associated tumors are likely secondary to main duct obstruction and the resulting inflammatory response. Together, these data suggest that PTEN deficiency predisposes ductal cells to malignant transformation, manifesting in IPMN-associated and distant PDAC similar to human IPMN-PDAC.
IPMN-Associated PDAC in PtenΔDuct/ΔDuct Mice Arises from Ductal Cells
To determine whether IPMN-PDAC in PtenΔDuct/ΔDuct mice originated from ductal cells, we examined whether the precursor lesions and tumors expressed YFP, and lacked PTEN protein. Consistent with a ductal origin of these lesions, pancreatobiliary- (Figure 3A and 3E) and oncocytic-type IPMN (Figure 3B and 3F), as well as the invasive tumors associated with pancreatobiliary IPMN (Figure 3C and 3G) in PtenΔDuct/ΔDuct mice were YFP-positive and PTEN-negative. Likewise, PanIN lesions and associated PDAC observed in a subset of PtenΔDuct/ΔDuct mice with IPMN-PDAC expressed YFP and lacked PTEN (Figure 3D and 3H, insets show PanIN), showing a ductal origin.
Figure 3. IPMN and associated PDAC originate from ductal cells.

Immunohistochemistry for YFP (A–D) and PTEN (E–H) in pancreatobiliary IPMN (A, E), oncocytic IPMN (B, F), pancreatobiliary IPMN-associated PDAC (PB-IPMN-PDAC) (C, G), and PanIN-associated PDAC (PanIN-PDAC) (D, H). Insets in D and H depict PanIN. Arrows in (B–D and G, H) denote invasive cells. Scale bars: 100 μm.
To further confirm that ductal and not pancreatic acinar cells are the origin of IPMN in PtenΔDuct/ΔDuct mice, we generated Ptf1aCreER;Ptenflox/flox;R26RYFP (PtenΔAcinar/ΔAcinar) mice (Figure S3A) to ablate Pten in acinar cells. We injected mice with tamoxifen at four weeks of age (Figure S3B), assessed recombination at four months of age, and analyzed pancreata for the presence of premalignant lesions or PDAC at 12–13 months (n=9). Despite efficient recombination and expression of YFP in the acinar cell compartment (Figure S3C), pancreatic ducts appeared normal and premalignant lesions were not observed in PtenΔAcinar/ΔAcinar mice (Figure S3D and S3E). Since hyperplastic ducts and IPMN lesions were observed in PtenΔDuct/ΔDuct mice at 12 months, IPMN lesions in PtenΔDuct/ΔDuct mice are unlikely to arise from acinar cells that ectopically recombined the Ptenflox allele. These findings indicate a specific link between PTEN loss in ductal cells and IPMN formation.
Spontaneous Kras Mutations Are Associated with Progression of Pancreatobiliary, but not Oncocytic, IPMN
Genetic studies in patient samples have shown that KRAS mutations are preferentially associated with pancreatobiliary- and gastric-type IPMN when compared to intestinal- and oncocytic-type IPMN.9, 10 To further characterize the molecular events associated with the induction of IPMN in PtenΔDuct/ΔDuct mice, we examined phosphorylated Erk (pErk) expression as an indicator of active Ras signaling. Consistent with the higher incidence of KRAS mutations in human pancreatobiliary IPMN,9, 10 pErk levels were higher in pancreatobiliary- than oncocytic-type IPMN in PtenΔDuct/ΔDuct mice (Figure 4A–C and S4A and Table 1). These results suggest that human IPMN and the PtenΔDuct/ΔDuct IPMN mouse model exhibit a similar subtype-specific pattern of Ras signaling activation.
Figure 4. Activation of Ras signaling in pancreatobiliary IPMN-PDAC in PtenΔDuct/ΔDuct mice.

(A–C) Immunohistochemistry for phosphorylated Erk (pErk) on pancreatic sections of 12-month-old PtenΔDuct/ΔDuct mice, showing that pancreatobiliary (PB) IPMN (asterisks in A and higher magnification in B), its associated PDAC (outlined by dashed line in A and boxed area magnified in A′) are positive, while invasive oncocytic (O) IPMN (C) is negative. (D) Multiplexed droplet digital PCR for Kras G12 codon variants. Grey shaded samples are considered positive (> 2 standard deviations above the mean level of Kras mutations in controls). *Denotes microscopic invasive adenocarcinomas. H, pancreatic head; T, pancreatic tail; C, common duct. (E–H) H&E (E, F) and immunohistochemistry for pErk (G, H) displaying microscopic lesions resembling pancreatobiliary (pre-PB-IPMN) (E, G) or oncocytic IPMN (pre-O-IPMN) (F, H) subtypes in PtenΔDuct/ΔDuct mice. E and G, as well as F and H, are adjacent sections. Scale bars: 500 μm (A), 100 μm (A′–C), and 50 μm (E–H).
We next examined whether Erk activation was associated with acquisition of spontaneous Kras mutations. For this, we first performed allele-specific PCR for the G12D Kras mutation, commonly found in human IPMN10, on DNA from section areas containing histologically normal tissue, IPMN, or IPMN/PDAC areas in PtenΔDuct/ΔDuct mice. As expected, the wild-type G12 DNA sequence was amplified from all samples (Figure S4B). The G12D mutation was amplified in samples from pancreatobiliary IPMN lesions, but not normal tissue or oncocytic IPMN (Figure S4B, lane 8; Table 1). Notably, we detected Kras G12D in only three of fifteen pancreatobiliary IPMN, and all IPMN lesions with this mutation exhibited micro- or macro-invasion (Figure S4B, lane 4 versus lane 6; Table 1). To further examine whether additional variant alleles for Kras G12 are present in PtenΔDuct/ΔDuct mice, we performed a more sensitive multiplexed droplet digital PCR (ddPCR) with probes to detect the G12D, G12C, G12R, and G12V variant alleles in a subset of samples where sufficient material was left (Figure 4D and S4C–D). These analyses confirmed our previous results and additionally indicated that two more pancreatobiliary IPMNs were positive for Kras mutant alleles, including one that was invasive. We also detected a Kras mutation in one oncocytic IPMN that had active Erk signaling in the cyst wall (Figure 4D and S4A), suggesting that the cyst wall developed the Kras mutation independently of the oncocytic papillary nodule, which was not pErk positive (Figure S4A). This raised the possibility that the Kras mutations could arise after IPMN initiation and be more important for IPMN progression. In support of this, we detected two different Kras mutations in the large IPMN-PDAC when the Kras variant probes were assayed individually (Figure 4D, mouse #64). Moreover, the invasive components of the pancreatobiliary IPMN were often more uniformly pErk-positive than the papillary nodules (Figure 4A, outlined area versus area denoted with asterisks; Figure 4A′ versus 4B), implying that Ras activation in the absence of Pten can be a late event associated with invasion in the context of pancreatobiliary IPMN. Importantly, no Kras G12 mutations were detected in the invasive oncocytic IPMN (Figure 4D and S4D, mouse #98). This suggest that, as in human disease, Kras mutations are predominantly associated with the development of pancreatobiliary, but not oncocytic IPMN.
To further confirm the link between Ras activation and IPMN progression but not initiation, we examined whether Erk signaling was activated in microscopic precursor lesions potentially preceding IPMN in PtenΔDuct/ΔDuct mice. To investigate this, we analyzed PtenΔDuct/ΔDuct mice devoid of macroscopic IPMN at six to fourteen months (n=27). In this cohort, we observed microscopic lesions consisting of single-cell-layered intraductal papillae that were occasionally large enough to contain branched structures (Figure 4E, 4 mice with 1 lesion each). Based on their similarity with pancreatobiliary IPMN, we designated these lesions pre-pancreatobiliary-IPMN. A second type of lesion consisted of papillae that had a diffuse eosinophilic cytoplasm and round nuclei randomly localized within the cell (Figure 4F, 4 mice with at least one lesion). In some cases, these papillae had a dense multilayered epithelium, resembling macroscopic oncocytic IPMN. Therefore, we designated these lesions pre-oncocytic-IPMN. If Ras activation was important for the induction of these microscopic lesions, pErk should be detected. However, neither pre-pancreatobiliary-IPMN nor pre-oncocytic-IPMN (Figure 4G and 4H) exhibited the uniformly strong positive pErk staining observed in invasive portions of pancreatobiliary IPMN (Figure 4A,A′ and 4B). Combined, the absence of pErk in microscopic lesions and the progressive acquisition of pErk signal during the development of pancreatobiliary IPMN-PDAC suggests that Ras activation in PtenΔDuct/ΔDuct mice is a later event during progression of pancreatobiliary IPMN to PDAC.
Oncogenic Kras Promotes IPMN and PDAC Formation in the Absence of Pten
To test whether Kras activation in the absence of Pten promotes pancreatobiliary IPMN and its invasion, we crossed LSL-KrasG12D mice (hereafter referred to as KrasG12D mice) with Sox9CreERT2;Ptenflox/flox;R26RYFP mice to generate Sox9CreERT2;KrasG12D;Ptenflox/flox;R26RYFP (KrasG12D;PtenΔDuct/ΔDuct) mice (Figure 5A). Expression of KrasG12D and ablation of Pten was induced by injecting 4-week-old mice three times with tamoxifen (Figure 5B). To assess IPMN and PDAC formation, we followed KrasG12D;PtenΔDuct/ΔDuct mice (n=14) to their humane endpoint. Within two to four weeks after tamoxifen administration, KrasG12D;PtenΔDuct/ΔDuct mice exhibited weight loss and became moribund. Extensive distension of the common duct was observed in all KrasG12D;PtenΔDuct/ΔDuct mice (Figure 5C, green arrow), while additional dilation of the main pancreatic duct was observed in 10 of 14 mice (Figure 5C, black arrow). Analysis of pancreatic sections revealed extensive papillae, resembling IPMN, lining the common duct (Figure S5A, curved double-headed arrow) and the main and large pancreatic ducts (Figure 5D and 5E, asterisks). The peribiliary glands of the common duct were expanded (Figure S5A, arrow). Consistent with detection of the Kras G12D mutation in IPMN-associated PDAC in PtenΔDuct/ΔDuct mice, KrasG12D;PtenΔDuct/ΔDuct mice exhibited a fully penetrant phenotype of invasive PDAC (Figure 5D–F). The rapid and widespread formation of papillae and invasion along the common and main pancreatic duct suggests that activation of Kras and loss of Pten is sufficient to induce invasive IPMN in ductal cells lining the common and main pancreatic ducts.
Figure 5. Synergy between Pten reduction and oncogenic Kras in the induction of IPMN-PDAC from ductal cells.

(A) Strategy to generate Sox9CreERT2;KrasG12D;Ptenflox/flox;R26RYFP (KrasG12D;PtenΔDuct/ΔDuct) and Sox9CreERT2;KrasG12D;Ptenflox/+;R26RYFP (KrasG12D;PtenΔDuct/+) mice. Tamoxifen (TM) injection induces recombination of the KrasG12D, Ptenflox, and R26RYFP alleles in Sox9-expressing cells. (B) KrasG12D;PtenΔDuct/ΔDuct and KrasG12D;PtenΔDuct/+ mice were injected with TM on postnatal days 28, 30, and 32 and sacrificed at their humane endpoint or at specific time points, respectively. In situ (C, G) and tiled H&E images (D, H) of the pancreas in KrasG12D;PtenΔDuct/ΔDuct and KrasG12D;PtenΔDuct/+ mice at nine weeks and six months, respectively. Black arrows denote lesions in the main pancreatic duct and green arrows in the common duct. Representative low- (E, I) and high-power (F, J) images of H&E stained pancreatic sections from KrasG12D;PtenΔDuct/ΔDuct and KrasG12D;PtenΔDuct/+ mice. IPMN-like lesions in dilated ducts (asterisks in E) are accompanied by PDAC (arrow in F). (K) Quantification of lesions in 4–8-month-old KrasG12D;PtenΔDuct/+ (n=30; Table S1), 8–16-month-old Sox9CreERT2;KrasG12D;R26RYFP (KrasG12D-Duct; n=14; sourced from22), and 6–12-months-old Sox9CreERT2;Ptenflox/+;R26RYFP (PtenΔDuct/+) (n=5) mice. (L) Immunohistochemistry for PTEN in KrasG12D;PtenΔDuct/+ pancreata reveals reduced signal in tumor epithelium (arrows) and pancreatobiliary IPMN (asterisk). (M) Representative PCR analysis of Pten in DNA from normal or IPMN/tumor areas of a KrasG12D;PtenΔDuct/+ mouse. Scale bars: 5 mm (C, D and G, H), 500 μm (E, I), and 100 μm (F, J, and L).
Pten Reduction and Oncogenic Kras Synergistically Induce Preneoplastic Lesions from Ductal Cells
Expression of KrasG12D alone in ductal cells induces occasional PanIN lesions in a subset of mice by 8–16 months22, while heterozygous loss of Pten produced no discernable phenotype by 12 months of age (see controls in Figures 1 and 2). To test whether Pten reduction and oncogenic Kras have synergistic roles in ductal cell transformation, we examined mice carrying a deletion of one Pten allele and expressing KrasG12D in ductal cells (Sox9CreERT2;KrasG12D;Ptenflox/+;R26RYFP mice, hereafter referred to as KrasG12D;PtenΔDuct/+ mice; Figure 5A and 5B). All 30 analyzed KrasG12D;PtenΔDuct/+ mice exhibited focal PanIN, pre-IPMN, and/or pancreatic or common duct IPMN between four and eight months of age (Figure 5G–K; Figure S5E and S5M; Table S1). The total number of lesions was also greater in KrasG12D;PtenΔDuct/+ than in KrasG12D-Duct or PtenΔDuct/+ mice (Figure 5K and Table S1). Moreover, 21 out of the 30 KrasG12D;PtenΔDuct/+ mice developed invasive PDAC that was associated with PanIN, pre-IPMN, or IPMN lesions (Figure 5G–J; Figure S5E and S5M; Table S1). These findings identify PTEN as a negative regulator of KrasG12D-mediated ductal cell transformation.
Concomitant Kras Activation and Reduced Pten Induces Pancreatobiliary and Mixed Pancreatobiliary/Gastric Subtype IPMN
In humans, KRAS mutations are commonly found in both pancreatobiliary and gastric IPMN subtypes and rarely in oncoytic IPMN.9, 10, 26 To determine whether Ras activation impacts IPMN subtype identity, we analyzed pancreatic histology and mucin expression in KrasG12D;PtenΔDuct/ΔDuct and KrasG12D;PtenΔDuct/+ mice. IPMN-like lesions in KrasG12D;PtenΔDuct/ΔDuct mice exhibited histological features of the pancreatobiliary IPMN (Figure 5E and 5F; Figure S5A, curved double-headed arrow), expressed the YFP lineage marker and were Muc1-positive, but Muc2-negative (Figure S5B–D). However, some YFP+Muc1+Muc2− papillae also contained gastric-type epithelium (Figure S5I–L) similar to the mixed gastric/pancreatobiliary IPMN subtype in humans.3, 27 While gastric and pancreatobiliary papillae were roughly equally represented in IPMN-like lesions of KrasG12D;PtenΔDuct/ΔDuct mice, IPMN-like lesions in KrasG12D;PtenΔDuct/+ mice were primarily pancreatobiliary (Figure 5H–J; Figure S5E–H; and Table S1). Gastric epithelium in KrasG12D;PtenΔDuct/+ mice mostly met the histological and molecular criteria of microscopic PanIN rather than IPMN or pre-IPMN (Figure S5M–P, show rare gastric or gastric/pancreatobiliary IPMN, and Table S1). Different from PtenΔDuct/ΔDuct mice, oncocytic IPMN were observed in neither KrasG12D;PtenΔDuct/+ nor KrasG12D;PtenΔDuct/ΔDuct mice. Together, these findings show that combined Kras activation and reduced Pten dosage predisposes ductal cells to form pancreatobiliary and gastric, but not oncocytic, IPMN. Thus, it appears that the presence of oncogenic Kras during IPMN induction can influence the IPMN subtype, providing a possible explanation for the low frequency of KRAS mutations in human oncocytic compared to gastric and pancreatobiliary IPMN.3, 9, 26
Loss of PTEN Underlies PDAC Development in KrasG12D;PtenΔDuct/+ Mice
In PtenΔDuct/ΔDuct mice, Kras mutations were associated with invasion of pancreatobiliary IPMN (Figure 4D and Table 1), suggesting that complete Pten loss combined with Kras activation is needed for progression of pancreatobiliary IPMN. Consistent with this, pancreatobiliary-like papillae were associated with invasion into the stroma in all KrasG12D;PtenΔDuct/ΔDuct mice. In addition, at least 22 of the 33 pancreatobiliary IPMN lesions in KrasG12D;PtenΔDuct/+ mice were invasive. To test whether malignant progression of pancreatobiliary IPMN in KrasG12D;PtenΔDuct/+ mice is associated with spontaneous Pten loss, we analyzed PTEN expression in KrasG12D;PtenΔDuct/+ pancreatic tissue (n=8). We found variable levels of PTEN signal in preneoplastic lesions and higher levels in tumor stroma, but little to no PTEN signal in pancreatobiliary IPMN-associated PDAC (Figure 5L and Table S1). PCR for the Ptenflox, recombined-Ptenflox, or Pten wild-type alleles on IPMN lesions and associated PDAC revealed loss of the Pten wild-type allele in the IPMN/tumor in 2 out of 8 KrasG12D;PtenΔDuct/+ mice (Figure 5M and Table S1), showing loss of heterozygosity as a possible mechanism of PTEN protein loss. These findings support the conclusion that Kras activation combined with loss of PTEN promotes development of invasive pancreatobiliary IPMN. Furthermore, our data indicate that these events could occur in any order and appear to be positively selected for during progression of pancreatobiliary IPMN to PDAC.
Human Invasive Pancreatobiliary IPMN Exhibit Ras Signaling Activation and PTEN Loss
Loss of PTEN expression occurs in human PDAC28 and is associated with poor prognosis of IPMN;4 however, the relationship between PTEN loss and activation of KRAS in human pancreatobiliary IPMN is unclear. To examine whether PTEN loss and KRAS activation occurs in invasive human pancreatobiliary IPMN, we analyzed a case of human pancreatobiliary IPMN (Figure 6A, asterisks) with associated PDAC (Figure 6A′) for pERK (Figure 6B–E) and PTEN (Figure 6F–H) expression. PTEN signal in both the IPMN and associated PDAC was reduced (Figure 6F and 6G) compared to the surrounding stroma (Figure 6F) and unaffected areas (Figure 6H). pERK signal was present in a portion of the IPMN (Figure 6B, boxed area magnified in 6C), the invasive glands (Figure 6B, arrow), and the IPMN-associated PDAC (Figure 6B′, boxed area magnified in Figure 6D). This case study suggests that PTEN reduction is associated with IPMN development, but strong activation of RAS signaling with progression to invasive PDAC. Thus, as in our mouse models, both KRAS activation and PTEN loss appear to be associated with invasive pancreatobiliary IPMN in humans.
Figure 6. Activation of ERK and loss of PTEN are associated with progression of pancreatobiliary IPMN in humans.

(A–H) H&E (A, A′) and immunohistochemistry for phosphorylated ERK (pERK) (B, B′ and C–E) and PTEN (F–H) on sections of human pancreatobiliary IPMN (A, B, C, and F) and associated PDAC (A′, B′, D, and G). Asterisks in A and B indicate the IPMN and arrow in B indicates invasive glands directly associated with the IPMN. Boxed areas in B and B′ are magnified in C and D, respectively. PTEN staining for the same area as in C and D is shown on nearby sections in F and G. pERK (E) and PTEN (H) staining in unaffected areas of the same section. Scale bars: 500 μm (A, A′, B, and B′) and 100 μm (C–H).
Discussion
We show here that PTEN loss with or without activation of Ras signaling in pancreatic ductal cells of mice recapitulates many clinicopathological features of human main duct IPMN. In contrast to previously described mouse models exhibiting IPMN,11–15 PtenΔDuct/ΔDuct and KrasG12D;PtenΔDuct/+ mice developed macroscopic, focal lesions within the ductal tree, spontaneously acquired secondary genetic mutations, and progressed to PDAC in the context of predominantly normal pancreatic parenchyma. These features are similar to the stochastic formation of precancerous lesions and tumors presumed to underlie PDAC development in humans.
Similar to human IPMN, our mouse models developed solid, isolated nodules on the walls of enlarged ducts (like mural nodules) in the absence of widespread tissue changes. The presence of a mural nodule is a clinically relevant criterion for assessing the malignant potential of a human pancreatic cyst.3, 29 Since nodules in PtenΔDuct/ΔDuct mice become invasive, this mouse model could help define additional events leading to the transformation of IPMN into PDAC. Furthermore, we observed IPMN lesions of multiple different subtypes, namely pancreatobiliary and oncocytic IPMN in PtenΔDuct/ΔDuct and pancreatobiliary and gastric IPMN in KrasG12D;PtenΔDuct/+ mice. The IPMN subtypes in our mouse models showed characteristics highly similar to subtype-specific features observed in human IPMN. First, mutation biases observed in human IPMN were recapitulated in our mouse models. Specifically, consistent with Kras mutations being rare in human oncocytic IPMN,9, 10, 26 KrasG12D mutations or highly active Erk signaling were not detected in oncocytic IPMN of PtenΔDuct/ΔDuct mice. Furthermore, Kras mutations were associated with gastric and pancreatobiliary IPMN in our mouse models, which is consistent with the higher rate of KRAS mutations in these subtypes in humans.9, 26 Second, KrasG12D;PtenΔDuct/+ mice displayed pancreatobiliary IPMN or pre-IPMN nodules that were continuous with gastric-type epithelium along the large pancreatic ducts. A highly similar phenomenon has been observed in multiple subtypes of human IPMN, which has led to the hypothesis that the gastric phenotype is the “null” phenotype and precedes the formation of other IPMN subtypes.27 The KrasG12D;PtenΔDuct/+ model now presents an opportunity to dissect whether these lesions have a shared lineage or whether the gastric epithelium arises secondarily to the IPMN lesion. Given the impact of IPMN subtype identity on clinical prognosis,2, 3 dissecting the mechanisms that underlie initiation and progression of distinct IPMN subtypes could pave the way for the development of subtype-specific therapies of IPMN-PDAC.
Previous studies have shown that Pten inactivation in embryonic pancreatic precursor cells leads to expansion of centroacinar cells and ultimately progression to PDAC.30 In contrast, we found that postnatal Pten deletion in ductal cells, including centroacinar cells, preferentially stimulated proliferation of cells in large ducts and had little effect on centroacinar cells. Similarly, combined Pten deletion and expression of oncogenic Kras in embryonic pancreatic precursor cells failed to induce IPMN,28, 31 in stark contrast to our observation after Pten deletion and Kras activation in postnatal ductal cells. Moreover, we found that IPMN only formed in response to ductal cell-specific, but not acinar cell-specific, Pten deletion. These observations illustrate that the phenotype caused by PDAC-associated genetic mutations is highly context-dependent. Therefore, inducing genetic mutations associated with human PDAC in specific cell types will help generate informative animal models to delineate the mechanistic underpinnings of human PDAC.
We demonstrate a ductal origin of IPMN lesions and associated PDAC in our genetic models. The similarity of the PtenΔDuct/ΔDuct model to human IPMN suggests that a spontaneous loss of PTEN in ductal cells during adult life could predispose to IPMN. This idea is consistent with human studies showing that mutations in the PTEN/PI3K pathway are more common in IPMN-associated PDAC than in conventional PDAC.4–8 However, not all KrasG12D;PtenΔDuct/+ mice showed Pten loss of heterozygosity. It is possible that posttranslational or epigenetic silencing mechanisms could also lead to PTEN loss, as shown in other contexts.32 Further study of potential mechanisms underlying PTEN loss in IPMN-associated PDAC is clearly necessary. Here, cell lines derived from human or mouse IPMN-PDAC could help define molecular mechanisms.
We further observed synergy between reduced Pten dosage and Kras activation in IPMN formation from ductal cells and progression to PDAC. The most established function of PTEN is to restrain activity of the PI3K signaling pathway. PI3K is also activated by Ras signaling, arguing that high PTEN activity in ductal cells could suppress the transformative effects of oncogenic Kras. Consistent with this idea, ductal cell-specific expression of KrasG12D in the context of wild-type Pten had surprisingly little effect; the induction of a limited number of PanIN lesions in a subset of KrasG12D-expressing mice being the only abnormality.22 Here we observed more efficient induction of PanIN, pre-IPMN, and IPMN when KrasG12D was expressed in the context of reduced PTEN, showing that PTEN indeed counteracts effects of oncogenic Kras in ductal cells. If the combined acquisition of PTEN loss and RAS activation we observed in a case of human pancreatobiliary IPMN-PDAC was verified in a larger number of cases, these features could become markers to distinguish IPMN with high and low malignant potential to inform patient selection for therapeutic intervention. In fact, reducing hyperinsulinemia-induced PI3K signaling through life-style modifications or pharmaceutical inhibition could reduce the risks of IPMN progression. Further studies examining how closely these mouse models recapitulate molecular aspects of human disease with regard to the accumulation of other IPMN-associated genetic and transcriptional changes could enable discovery of additional drivers of IPMN initiation and malignant progression.
Supplementary Material
Acknowledgments
Grant Support: This work was supported by NIH-R01DK078803 and R21CA194839 to M.S.; NIH-F32CA136124 and CIHR Operating Grant and New Investigator Award to J.L.K; and CPRIT Rising Stars Award, UT Stars Grant, and R01 CA136526 to A.D.R.
We thank Nissi Varki (University of California, San Diego Cancer Center, Histopathology Core), Fenfen Liu, Nancy Rosenblatt, Sangho Yu, Manbir Sandhu, Brandon Taylor, and Yu Cao for expert technical assistance, and the University of California, San Diego, Electron Microscopy Core for image preparation. We are grateful to Andrew Lowy for advice, members of the Sander and Kopp laboratories for discussions, and Andrea C. Carrano for help with preparation of the manuscript. We thank Christopher Wright (Vanderbilt University) for Ptf1aCreER mice and David Tuveson (Cold Spring Harbor Laboratory) for LSL-KrasG12D mice.
Abbreviations used in this paper
- Brg1
Brahma Protein-Like 1
- Cldn18
Claudin 18
- ddPCR
droplet digital polymerase chain reaction
- ER
estrogen receptor
- IPMN
intraductal papillary mucinous neoplasias
- Kras
Kirsten Rat Sarcoma Viral Oncogene Homolog
- KrasG12D
LSL-KrasG12D allele
- KrasG12D-Duct
Sox9CreERT2;KrasG12D;R26RYFP mice
- KrasG12D;PtenΔDuct/+
Sox9CreERT2;KrasG12D;Ptenflox/+;R26RYFP mice
- KrasG12D;PtenΔDuct/ΔDuct
Sox9CreERT2;KrasG12D;Ptenflox/flox;R26RYFP mice
- MCN
mucinous cystic neoplasias
- Muc1
Mucin 1
- Muc2
Mucin 2
- n
sample number
- O-IPMN
oncocytic IPMN
- PanIN
pancreatic intraepithelial neoplasias
- PanIN-PDAC
PanIN-associated PDAC
- PB-IPMN
pancreatobiliary IPMN
- PB-IPMN-PDAC
pancreatobiliary IPMN-associated PDAC
- PDAC
pancreatic ductal adenocarcinoma
- pErk
phosphorylated Erk
- PI3K
phosphatidylinositol 3-kinase
- pre-IPMN
microscopic IPMN
- pre-O-IPMN
microscopic oncocytic IPMN
- pre-PB-IPMN
microscopic pancreatobiliary IPMN
- Pten
Phosphatase and Tensin Homolog
- Pten+/+
Sox9CreERT2;Pten+/+;R26RYFP mice
- PtenΔAcinar/+
Ptf1aCreER;Ptenflox/+;R26RYFP mice
- PtenΔAcinar/ΔAcinar
Ptf1aCreER;Ptenflox/flox;R26RYFP mice
- PtenΔDuct/+
Sox9CreERT2;Ptenflox/+;R26RYFP mice
- PtenΔDuct/ΔDuct
Sox9CreERT2;Ptenflox/flox;R26RYFP mice
- Ptf1a
Pancreas Specific Transcription Factor, 1a
- Smad4
Mothers Against Decapentaplegic Homolog 4
- Sox9
SRY (Sex Determining Region Y)-Box 9
- TIFγ
Transcriptional Intermediary Factor 1 gamma
- TGF-alpha
Transforming Growth Factor alpha
- TM
Tamoxifen
- WT
wild-type
- YFP
yellow fluorescence protein
Footnotes
Disclosures: The authors claim that there is no conflict of interest.
Supplementary information includes five figures and two tables.
Author Contributions: J.L.K. designed, analyzed and interpreted the experiments, and wrote the manuscript. C.L.D. and J.L.K. performed mouse husbandry, histological, immunohistochemical, and mutational analyses. A.S. performed immunohistochemical analyses and A.S., F.T., R.W.C., and A.D.R. performed ddPCR mutational analyses. D.F.S. and M.V. provided advice on pathological classification of tissue samples, and D.F.S. helped write the manuscript. B.S. provided Ptenflox mice and M.V. human tissue samples. M.S. supervised the overall project, obtained funding, and wrote the manuscript. All authors reviewed and approved the manuscript.
Publisher's Disclaimer: This is a PDF file of an unedited manuscript that has been accepted for publication. As a service to our customers we are providing this early version of the manuscript. The manuscript will undergo copyediting, typesetting, and review of the resulting proof before it is published in its final citable form. Please note that during the production process errors may be discovered which could affect the content, and all legal disclaimers that apply to the journal pertain.
References
Author names in bold designate shared co-first authorship
- 1.Grutzmann R, Niedergethmann M, Pilarsky C, et al. Intraductal papillary mucinous tumors of the pancreas: biology, diagnosis, and treatment. Oncologist. 2010;15:1294–309. doi: 10.1634/theoncologist.2010-0151. [DOI] [PMC free article] [PubMed] [Google Scholar]
- 2.Distler M, Kersting S, Niedergethmann M, et al. Pathohistological subtype predicts survival in patients with intraductal papillary mucinous neoplasm (IPMN) of the pancreas. Ann Surg. 2013;258:324–30. doi: 10.1097/SLA.0b013e318287ab73. [DOI] [PubMed] [Google Scholar]
- 3.Adsay V, Mino-Kenudson M, Furukawa T, et al. Pathologic Evaluation and Reporting of Intraductal Papillary Mucinous Neoplasms of the Pancreas and Other Tumoral Intraepithelial Neoplasms of Pancreatobiliary Tract: Recommendations of Verona Consensus Meeting. Ann Surg. 2016;263:162–77. doi: 10.1097/SLA.0000000000001173. [DOI] [PMC free article] [PubMed] [Google Scholar]
- 4.Garcia-Carracedo D, Turk AT, Fine SA, et al. Loss of PTEN expression is associated with poor prognosis in patients with intraductal papillary mucinous neoplasms of the pancreas. Clin Cancer Res. 2013;19:6830–41. doi: 10.1158/1078-0432.CCR-13-0624. [DOI] [PMC free article] [PubMed] [Google Scholar]
- 5.Mohri D, Asaoka Y, Ijichi H, et al. Different subtypes of intraductal papillary mucinous neoplasm in the pancreas have distinct pathways to pancreatic cancer progression. J Gastroenterol. 2012;47:203–13. doi: 10.1007/s00535-011-0482-y. [DOI] [PubMed] [Google Scholar]
- 6.Samuels Y, Wang Z, Bardelli A, et al. High frequency of mutations of the PIK3CA gene in human cancers. Science. 2004;304:554. doi: 10.1126/science.1096502. [DOI] [PubMed] [Google Scholar]
- 7.Schonleben F, Qiu W, Ciau NT, et al. PIK3CA mutations in intraductal papillary mucinous neoplasm/carcinoma of the pancreas. Clin Cancer Res. 2006;12:3851–5. doi: 10.1158/1078-0432.CCR-06-0292. [DOI] [PMC free article] [PubMed] [Google Scholar]
- 8.Lubezky N, Ben-Haim M, Marmor S, et al. High-throughput mutation profiling in intraductal papillary mucinous neoplasm (IPMN) J Gastrointest Surg. 2011;15:503–11. doi: 10.1007/s11605-010-1411-8. [DOI] [PubMed] [Google Scholar]
- 9.Kuboki Y, Shimizu K, Hatori T, et al. Molecular biomarkers for progression of intraductal papillary mucinous neoplasm of the pancreas. Pancreas. 2015;44:227–35. doi: 10.1097/MPA.0000000000000253. [DOI] [PubMed] [Google Scholar]
- 10.Wu J, Matthaei H, Maitra A, et al. Recurrent GNAS mutations define an unexpected pathway for pancreatic cyst development. Sci Transl Med. 2011;3:92ra66. doi: 10.1126/scitranslmed.3002543. [DOI] [PMC free article] [PubMed] [Google Scholar]
- 11.Siveke JT, Einwächter H, Sipos B, et al. Concomitant pancreatic activation of Kras(G12D) and Tgfa results in cystic papillary neoplasms reminiscent of human IPMN. Cancer Cell. 2007;12:266–279. doi: 10.1016/j.ccr.2007.08.002. [DOI] [PubMed] [Google Scholar]
- 12.Bardeesy N, Cheng KH, Berger JH, et al. Smad4 is dispensable for normal pancreas development yet critical in progression and tumor biology of pancreas cancer. Genes Dev. 2006;20:3130–46. doi: 10.1101/gad.1478706. [DOI] [PMC free article] [PubMed] [Google Scholar]
- 13.Vincent DF, Yan KP, Treilleux I, et al. Inactivation of TIF1gamma cooperates with Kras to induce cystic tumors of the pancreas. PLoS Genet. 2009;5:e1000575. doi: 10.1371/journal.pgen.1000575. [DOI] [PMC free article] [PubMed] [Google Scholar]
- 14.von Figura G, Fukuda A, Roy N, et al. The chromatin regulator Brg1 suppresses formation of intraductal papillary mucinous neoplasm and pancreatic ductal adenocarcinoma. Nat Cell Biol. 2014;16:255–67. doi: 10.1038/ncb2916. [DOI] [PMC free article] [PubMed] [Google Scholar]
- 15.Qiu W, Tang SM, Lee S, et al. Loss of Activin Receptor Type 1B Accelerates Development of Intraductal Papillary Mucinous Neoplasms in Mice With Activated KRAS. Gastroenterology. 2016;150:218–228. e12. doi: 10.1053/j.gastro.2015.09.013. [DOI] [PMC free article] [PubMed] [Google Scholar]
- 16.Font-Burgada J, Shalapour S, Ramaswamy S, et al. Hybrid Periportal Hepatocytes Regenerate the Injured Liver without Giving Rise to Cancer. Cell. 2015;162:766–79. doi: 10.1016/j.cell.2015.07.026. [DOI] [PMC free article] [PubMed] [Google Scholar]
- 17.Kopinke D, Brailsford M, Pan FC, et al. Ongoing Notch signaling maintains phenotypic fidelity in the adult exocrine pancreas. Dev Biol. 2012;362:57–64. doi: 10.1016/j.ydbio.2011.11.010. [DOI] [PMC free article] [PubMed] [Google Scholar]
- 18.Lesche R, Groszer M, Gao J, et al. Cre/loxP-mediated inactivation of the murine Pten tumor suppressor gene. Genesis. 2002;32:148–9. doi: 10.1002/gene.10036. [DOI] [PubMed] [Google Scholar]
- 19.Tuveson DA, Shaw AT, Willis NA, et al. Endogenous oncogenic K-ras(G12D) stimulates proliferation and widespread neoplastic and developmental defects. Cancer Cell. 2004;5:375–87. doi: 10.1016/s1535-6108(04)00085-6. [DOI] [PubMed] [Google Scholar]
- 20.Srinivas S, Watanabe T, Lin CS, et al. Cre reporter strains produced by targeted insertion of EYFP and ECFP into the ROSA26 locus. BMC Dev Biol. 2001;1:4. doi: 10.1186/1471-213X-1-4. [DOI] [PMC free article] [PubMed] [Google Scholar]
- 21.Taylor BL, Liu FF, Sander M. Nkx6. 1 is essential for maintaining the functional state of pancreatic beta cells. Cell Rep. 2013;4:1262–75. doi: 10.1016/j.celrep.2013.08.010. [DOI] [PMC free article] [PubMed] [Google Scholar]
- 22.Kopp JL, von Figura G, Mayes E, et al. Identification of Sox9-Dependent Acinar-to-Ductal Reprogramming as the Principal Mechanism for Initiation of Pancreatic Ductal Adenocarcinoma. Cancer Cell. 2012;22:737–750. doi: 10.1016/j.ccr.2012.10.025. [DOI] [PMC free article] [PubMed] [Google Scholar]
- 23.Jiao J, Wang S, Qiao R, et al. Murine cell lines derived from Pten null prostate cancer show the critical role of PTEN in hormone refractory prostate cancer development. Cancer Res. 2007;67:6083–91. doi: 10.1158/0008-5472.CAN-06-4202. [DOI] [PubMed] [Google Scholar]
- 24.Jackson JB, Choi DS, Luketich JD, et al. Multiplex Preamplification of Serum DNA to Facilitate Reliable Detection of Extremely Rare Cancer Mutations in Circulating DNA by Digital PCR. J Mol Diagn. 2016;18:235–43. doi: 10.1016/j.jmoldx.2015.10.004. [DOI] [PMC free article] [PubMed] [Google Scholar]
- 25.Westmoreland JJ, Drosos Y, Kelly J, et al. Dynamic distribution of claudin proteins in pancreatic epithelia undergoing morphogenesis or neoplastic transformation. Dev Dyn. 2012;241:583–94. doi: 10.1002/dvdy.23740. [DOI] [PMC free article] [PubMed] [Google Scholar]
- 26.Furukawa T, Kuboki Y, Tanji E, et al. Whole-exome sequencing uncovers frequent GNAS mutations in intraductal papillary mucinous neoplasms of the pancreas. Sci Rep. 2011:1. doi: 10.1038/srep00161. [DOI] [PMC free article] [PubMed] [Google Scholar]
- 27.Adsay NV, Merati K, Basturk O, et al. Pathologically and biologically distinct types of epithelium in intraductal papillary mucinous neoplasms: delineation of an “intestinal” pathway of carcinogenesis in the pancreas. Am J Surg Pathol. 2004;28:839–48. doi: 10.1097/00000478-200407000-00001. [DOI] [PubMed] [Google Scholar]
- 28.Ying H, Elpek KG, Vinjamoori A, et al. PTEN is a major tumor suppressor in pancreatic ductal adenocarcinoma and regulates an NF-kappaB-cytokine network. Cancer Discov. 2011;1:158–69. doi: 10.1158/2159-8290.CD-11-0031. [DOI] [PMC free article] [PubMed] [Google Scholar]
- 29.Anand N, Sampath K, Wu BU. Cyst features and risk of malignancy in intraductal papillary mucinous neoplasms of the pancreas: a meta-analysis. Clin Gastroenterol Hepatol. 2013;11:913–21. doi: 10.1016/j.cgh.2013.02.010. quiz e59–60. [DOI] [PubMed] [Google Scholar]
- 30.Stanger BZ, Stiles B, Lauwers GY, et al. Pten constrains centroacinar cell expansion and malignant transformation in the pancreas. Cancer Cell. 2005;8:185–195. doi: 10.1016/j.ccr.2005.07.015. [DOI] [PubMed] [Google Scholar]
- 31.Hill R, Calvopina JH, Kim C, et al. PTEN loss accelerates KrasG12D-induced pancreatic cancer development. Cancer Res. 2010;70:7114–24. doi: 10.1158/0008-5472.CAN-10-1649. [DOI] [PMC free article] [PubMed] [Google Scholar]
- 32.Correia NC, Girio A, Antunes I, et al. The multiple layers of non-genetic regulation of PTEN tumour suppressor activity. Eur J Cancer. 2014;50:216–25. doi: 10.1016/j.ejca.2013.08.017. [DOI] [PubMed] [Google Scholar]
Associated Data
This section collects any data citations, data availability statements, or supplementary materials included in this article.