Abstract
A targeted proteomic analysis of murine serum over a 35-day course of fracture healing was carried out to determine if serum proteomic changes could be used to monitor the biological progression of fracture healing. Transverse, closed femoral fractures where generated and stabilized with intramedullary fixation. A single stranded DNA aptamer-based multiplexed proteomic approach was used to assay 1310 proteins. The transcriptomic profiles for genes matching the 1310 proteins were obtained by microarray analysis of callus mRNA. Of the 1310 proteins analyzed, 850 proteins showed significant differences among the time points (p-value<0.05). Ontology assessment associated these proteins with osteoblasts, monocyte/macrophage lineages, mesenchymal stem cell lines, hepatic tissues, and lymphocytes. Temporal clustering of these data identified proteins associated with inflammation, cartilage formation and bone remodeling stages of healing. VEGF, Wnt, and TGF-β signaling pathways were restricted to the period of cartilage formation. Comparison of the proteomic and transcriptomic profiles showed that 87.5% of proteins in serum had concordant expression to their mRNA expression in the callus, while 12.5% of the protein and mRNA expression patterns were discordant. The discordant proteins that were elevated in the serum but down regulated in callus mRNA expression were related to clotting functions, allograft rejection, and complement function. While proteins down regulated in the serum and elevated in callus mRNA were associated with osteoblast function, NF-κb, and activin signaling. These data show the serum proteome may be used to monitor the different biological stages of fracture healing and have translational potential in assessing human fracture healing. This article is protected by copyright. All rights reserved
Keywords: Fracture Healing, Serum biomarkers, Animal Models: Preclinical Studies, Microarray
Introduction
The primary diagnostic tools to assess the progression of fracture healing are radiographic assessments and patient reports of pain-free weight bearing and function(1). Similarly, regulatory acceptance of medicinal compounds promoting fracture healing are primarily based on radiographic and clinical assessments, and reduction in healing complications(2). There is no consensus on how to evaluate the progression of fracture healing(2–4). There are a number of radiological scoring protocols for the progression of fracture healing and for defining non-union; however these are limited by inter- and intra-rater variability(5,6). Patient reported outcomes are limited by their subjective nature and high degree of statistical variation. Most importantly, these clinical measures are unable to quantify the underlying biological processes associated with the progression of healing or to identify those at risk for development of nonunion. Therefore, exploring clinically feasible venues for tracking the biological stages of fracture healing is needed.
Over the last 10 years, a small number of animal and humans studies have been carried out to examine specific protein markers found in serum that are indicative of bone formation(7–9), bone turnover(8–10), angiogenesis(11,12) and mineral metabolism(13). A review of the use of serum markers to predict fracture healing is presented in Pountos et al.(14). This review highlighted that currently available bone formation markers commonly used to study osteoporosis including osteocalcin, BLK APase, and collagen PINP have failed to detect variations in the progression of fracture healing. On the other hand, a number of studies have shown that markers of bone turnover(8) and angiogenesis have the potential to predict development of nonunion(11,12) and are informative regarding the underlying biological processes taking place during fracture healing(15). The primary deficiencies in these studies however has been their small sample sizes, focus on single candidate markers, poorly controlled design for the nature of the fracture or fixation methods, and lack of robust set of measurable callus parameters that can be related to the candidate markers and the biological stages of fracture healing.
The paucity of well controlled studies, limited identification of a broader set of uniquely expressed proteins associated with fracture healing, and the lack of a validated relationship of protein expression to biological and temporal events of fracture healing have been major impediments to developing serum-based biological markers to follow the progression of fracture healing. Thus, there is an immense and immediate need to identify measurable biological markers that define the progression of skeletal tissue healing and would be prognostic of deficiencies in skeletal tissue healing. A biological assay that assesses fracture healing would also be beneficial in assessing the pharmacokinetics and levels of appropriate dosing for medicinal compounds(16,17) that could be used to promote bone repair. Therefore, the goal of this study was to determine whether serum proteomic changes could be used to monitor the biological progression of fracture healing. Serum proteome was measured using an aptamer-based multiplexed proteomic technology(18) to assay 1310 serum proteins across a seven-week period of fracture healing in mice. We identified proteins that demonstrated statistically altered expression levels over the seven-week period. We then identified the biological functions of these proteins using functional annotation bioinformatics approach and compared their expression profiles to that of matching genes from the callus mRNA throughout the healing process.
Materials and Methods
Animal Model
All protocols were approved by the Animal Care and Use Committee at the Boston University School of Medicine. Closed, stabilized femoral fractures were created in male C57BL/6J (B6) mice (Jackson Laboratories, Bar Harbor, ME), 8–12 weeks of age (n=6 per time point)(19). Animals were randomly assigned to specific time point groups and were housed under standard conditions (2–4 animals/cage). Animals were anesthesized (Isoflurane) with cone-mask prior to surgery. All mice received analgesics (Buprenorphine) and antibiotics (Enrofloxacin) to relieve post-operative pain and as a prophylactic for bacterial infections, respectively. Euthanasia was by CO2 asphyxiation. At the time of euthanasia, all animals were imaged using plain film radiography in a Faxitron Cabinet X-ray machine. Callus tissues and whole blood were harvested at post-operative days 3, 7, 10, 14, 21, and 35 days post fracture. Samples from unfractured femoral bones from male mice of the same starting age as those that had been fractured were used as the reference (day 0). Harvest time for both blood and tissues was between 8 AM to 12 PM. Callus mRNAs were prepared from callus tissues matched to those used for serum analysis. A separate set of mice were used to generate fracture callus tissues for histological analysis at post fracture time points matched to those used for the serum analysis.
Serum Collection and Targeted Proteomic Analysis
Whole blood was collected immediately after euthanasia by cardiac puncture. Serum was extracted immediately after bleeding by centrifugation at 200g for 7 minutes. Serum was collected into unheparinized centrifugation tubes and kept on ice and at 4° C throughout processing. After separation, serum was snap frozen in liquid nitrogen and stored at −80°C.
Somalogic (Boulder, Colorado) provided the proteomic profiling as a commercial service. SOMAmer assays were carried out on 65 microliters of whole serum. At the time that the samples were prepared for shipping to SomaLogic, Inc. they were thawed on ice and a total of 100 microliters was aliquoted into micro centrifuge tubes and shipped to SomaLogic overnight on dry ice. The assay used for this study was based on a 1310 target protein platform developed for human assay and validated and used in mouse studies(20,21). The complete list is available at the company’s website and in the supplemental material. The proteins in this assay are known to be important in human diseases including cytokines (20%), growth factors (13%), receptors (21%), proteases (17%), protease inhibitors (5%), kinases (20%), structural proteins (1%), and hormones (3%). 47% of the proteins that are surveyed are secreted proteins, 28% are extracellular domains, and 25% are intracellular proteins. The list of proteins that this technology has the ability to assay includes all of the known proteins that have been surveyed to date in animal and clinical trials across fracture healing(7–9), bone turnover(8–10), angiogenesis(11,12) and mineral metabolism(13).
Analysis of Messenger RNA Expression
Total RNAs were isolated from each fracture callus using procedures developed for murine bones(22). In order to both achieve an optimal balance in biological replicate variability and repeatability RNA from every two of the six fracture calluses were randomly pooled to generate three assay samples. Microarray analyses were performed at Boston University Clinical and Translational Science Institute Bioinformatics Division. One microgram of RNA was labeled and used for hybridization. The GeneChip Mouse Gene 1.0ST Arrays were used (Affymetrix, Santa Clara, CA). Quality control was assessed using the Relative Log Expression (RLE) and Normalized Unscaled Standard Error (NUSE). Seventeen samples were used as technical replicas to account for batch differences. ComBat algorithm was used to correct for batch effect (Bioconductor, SVA package, Seattle, WA).
For select genes, RT-PCR was carried out for validation as previously described(23). Each mRNA analysis was performed in duplicate or triplicate for 6 samples per group. All reagents for the qRT-PCR analysis were from Applied Biosystems, Inc. (Foster City, CA), and plate assays were read on an ABI 7700 Sequence Detector (Applied Biosystems). The CT values of 18S rRNA were used to normalize for cell number. The fractional cycle number at which the fluorescence passes the fixed CT threshold value was used for quantification.
Analysis of Protein and mRNA Expression Data
The ratio of protein expression levels relative to day 0 were calculated and compared among the harvest time points using analyses of variance (ANOVA) with Tukey post hoc tests (JMP 10, Cary, NC). A significance level of p-value ≤0.05 was used to identify a subset of proteins for further analysis. The mRNA expression for genes matching the protein subset was identified from the transcriptomic analysis. For the set of proteins with ANOVA p-value ≤0.05 (n=850), normal mixtures clustering technique was used to group proteins based on their temporal expression profiles (JMP 10, Cary, NC). This analysis identifies groups of proteins exhibiting similar temporal profiles to one another such that the extent of similarity is high within each group (cluster) and low between groups (clusters). Normal mixtures is an iterative estimation method that characterizes the cluster groups, then estimates the probability that a protein is in each cluster. Similar analysis was performed for the mRNA expression. Protein and mRNA expression profiles were compared. The biologic functions of protein subset and individual clusters were assessed using Ingenuity Pathway Analysis tool (IPA, QIAGEN Redwood City). IPA identified networks of biologically related genes, connections between genes, and canonical pathways and biologic functions that were significant/enriched with the set of proteins with ANOVA p-value ≤0.05 (n=850). Only those networks significantly associated with molecular or biological functions or associated with a significantly enriched Canonical Pathway (p ≤ 0.05; Fisher’s Exact Test) were considered. Further, IPA identifies transcriptional regulators that are able to explain the observed gene expression changes. Upstream regulators with statistically significant overlap with our set of significant proteins were identified (p ≤ 0.05; Fisher’s Exact Test). The results are shown as heatmaps, which were sorted based on the Fisher’s Exact Test p-values. Top 30, based on ranking using Fisher’s Exact Test p-values, are shown. Enrichr(24) software was used to identify cell type associated with the expressed proteins by comparing against Mouse Gene Atlas in Enrichr. In this database, investigators upload datasets from different tissue/cell types. A protein in our data set may be present in multiple datasets. Proteins present in multiple ontologies were given a weighted value. For example, protein Laminin Subunit Beta 1 (LAMB1) in our dataset was also found in datasets that used stem cells, mast cells and the eye tissue, thus was counted as a third in each of the three categories.
Concordance/discordance between proteomic and transcriptomic regulation was examined for the set of proteins with ANOVA p-value ≤0.05 (n=850). Proteins were grouped into subgroups: (1) expression is down- or up-regulated relative to day 0 at least at one time point, but not for the entire time course; and (2) expression is down- or up-regulated relative to day 0 over the entire time course. If the expression pattern for the transcriptome followed that of the proteome (i.e. down- or up-regulated relative to day 0), the relationship was categorized as “concordant” otherwise it was “discordant”.
Finally, the set of proteins enriching canonical pathways relating to fracture healing were identified using IPA. The proteins were sorted by ANOVA FDR q-values and maximum/minimum fold change of the expression value in order to select a subset of 50 proteins that can serve as a set of potential biomarkers of fracture healing.
Histology
Tissue retrieval, fixation, demineralization and sectioning of calluses were as previously described(19). Transverse sections (7 μm thick, 20/callus, spaced ~500 microns apart) were cut across the entire length of the callus and were stained with fast green and Safranin O.
Results
Radiological, Tissue and Molecular Assessments of the Progression of Fracture Healing
Representative radiographic, histological and molecular time courses of fracture healing are presented to place in perspective how these assessments correlate with the serum proteome. Radiographic images are shown in Figure 1. The radiological analysis showed development of callus tissues and mineral deposition within the callus tissues are first seen by day 7. Callus bridging is complete by day 21 and bone remodeling is underway by day 35.
Figure 1. Representative radiographs for fractured femurs at the different assessment time points in this study.
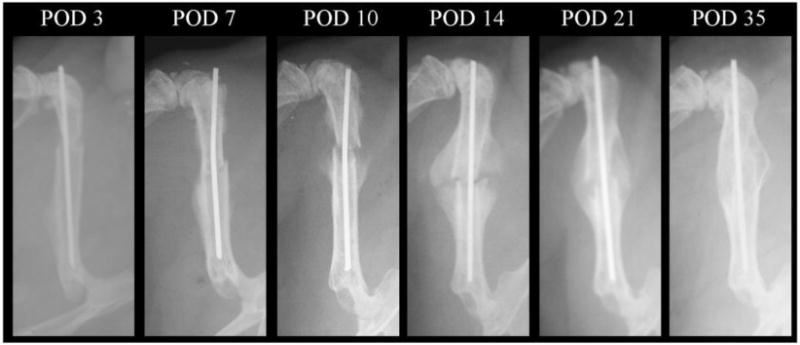
POD: post-operative day.
The biological progression of fracture healing is presented in Figure 2. Histological assessments confirm the radiological findings and are in agreement with previous studies. Cartilage was visible at day 14 and has been resorbed and replaced by mineralized trabecular bone by day 21 (Figure 2A). Quantitative RT-PCR mRNA expression levels of markers of chondrogenic and osteogenic differentiation and tissue formation relative to day 0 further highlight and validate the time frames in which cartilage and bone tissue formation reach their respective peaks and are actively involved in bone healing (Figure 2B).
Figure 2. Biological Progression of Fracture Healing.
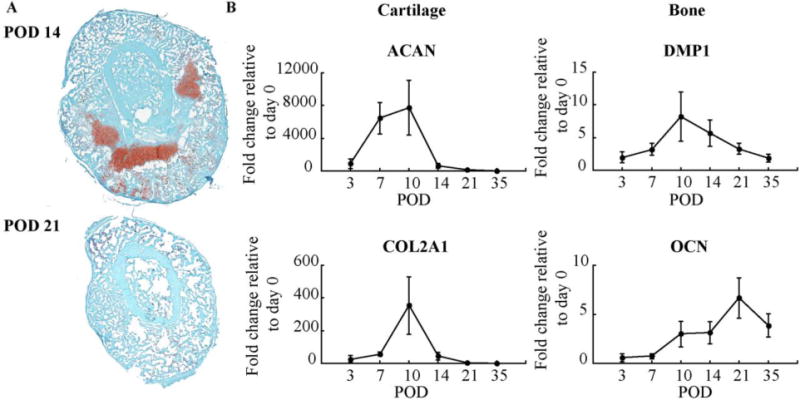
(A) Histological sections of fracture calluses at: 14 and 21 days post-fracture. Cartilage stains red with safranin O and bone stains greenish blue with fast green; and (B) Quantitative RT-PCR mRNA expression levels of markers and transcriptional regulators of chondrogenic (Aggrecan and Collagen type II, alpha 1) and osteogenic (Dentin Matrix Acidic Phosphoprotein 1 and Osteocalcin) differentiation was compared with that obtained from day 0 non-fractured bone. Error bars correspond to the standard error.
Of the 1310 proteins analyzed, 850 proteins showed statistically significant differences among the time points (ANOVA p-value<0.05). The complete data sets from this analysis are available in the supplemental data. By comparing against Mouse Gene Atlas in Enrichr, 692 out of the 850 proteins were found in the database. The tissue/cell ontologies linked to the 692 proteins were associated with osteoblasts, monocyte/macrophage lineages, mesenchymal stem cell lines, hepatic tissues, lymphocytes, as well as other whole organs such as brain, eye and liver. (Figure 3A and Supplemental Table 1). Among the top 30 canonical pathways canonical pathways enriched with the 850 proteins were coagulation system and NF-κB signaling (p-value < 6×10⁻¹⁸; Figure 3B); which are highly enriched soon after the injury. While canonical pathways such as FGF signaling, IL-6 signaling, Wnt/β-catenin signaling, and BMP signaling, all of which are enriched at specific time points that correspond to the underlying biological processes in the callus (p-value < 4×10⁻⁵; Figure 4).
Figure 3. Cell, Tissue, and Biological Function Ontologies Associated with the Statistically Significant Differences of the Serum Proteome.
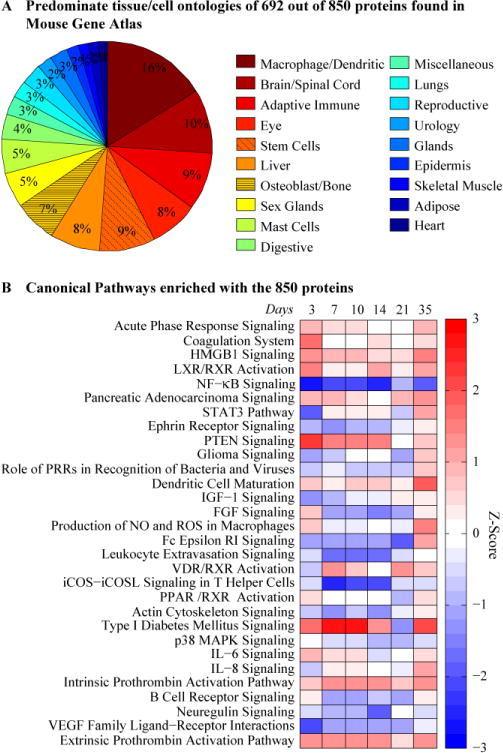
(A) Pie chart representing cell and tissue types associated with ontologies related to proteins in serum. Number of proteins per ontology is listed in Supplemental table 1. Proteins present in multiple ontologies are given a weighted value. (B) Enrichments analysis showing Canonical Pathways for all 850 Proteins. The color represents the z-score (ranging from −3 in blue to +3 in red). The rows are sorted by p-value with most significant at the top.
Figure 4. Subset of the Canonical Pathways Relating to Fracture Healing.
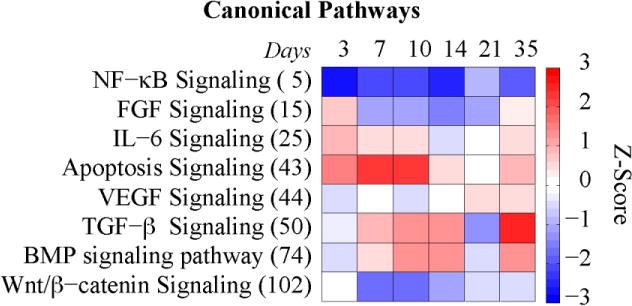
The rows are sorted by p-value with most significant at the top (rank is shown in parenthesis). The color represents the z-score (ranging from −3 in blue to +3 in red).
Comparison of the proteomic and transcriptomic profiles showed about 87.5% of proteins in serum had concordant expression to their mRNA expression in the callus, while 12.5% of the protein and mRNA expression patterns were discordant (Table 1). The concordant proteins/genes are ones where expression levels of RNA compared to the proteins in the serum were in the same direction; i.e. both are up- or down-regulated. The 12.5% discordant protein and mRNA expression means that the expression levels of RNA compared to the proteins in the serum were in opposite directions. The discordance in expression levels may reflect whether certain proteins are secreted into vs. absorbed from the serum during fracture healing or may be due to inverse effects of the fracture systemically affecting other tissues that spill proteins into the serum. Proteins that were elevated in the serum but down-regulated in callus mRNA expression included those related to clotting functions, allograft rejection and complement function. Inverse relationships in which serum levels were decreased and mRNAs were increased included some proteins associated with osteoblast function, NF-κb, and activin signaling.
Table 1.
Concordance/discordance between proteomic and transcriptomic regulation.
| Up/down regulation for proteome | Concordant | Discordant (Regulation for transcriptome) | |
|---|---|---|---|
| p-value<0.05 (850) | ↑* | 400 | 0 |
| ↑** | 141 | 48 (↓) | |
| ↓** | 203 | 58 (↑) | |
| p-value≥0.05 (460) | not assessed | ||
expression is up-regulated relative to day 0 at least at one time point, but not for the entire time course;
expression is down- or up-regulated relative to day 0 over the entire time course.
Temporal Profiles of Skeletal and Tissue Regulatory Pathway Ontologies in the Serum Proteome
The protein expression profiles were grouped into 7 clusters based on their temporal profiles (Figure 5A). The key biologic processes within each cluster are summarized in Table 2. Where as the mRNA expression profile were grouped into 5 clusters (Figure 5B). The correspondence between the proteomic and transcriptomic clusters is shown in Supplemental Table 2. By comparing against Mouse Gene Atlas in Enrichr, 68 proteins were found to be associated with osteoblasts. Most of the 68 proteins were found in proteome clusters 1 and 5 (n = 21 and 26, respectively; Supplemental Table 3). Proteome cluster 1 was characterized by a down-regulation in expression levels between days 7 to day 21, while proteome cluster 5 was characterized by an up-regulation in the expression profile during the same time period. The corresponding mRNA expression profiles were spread among all clusters (Figure 6B).
Figure 5. Temporal Clustering and Protein Profiles of the Serum Proteome of Fracture Healing.
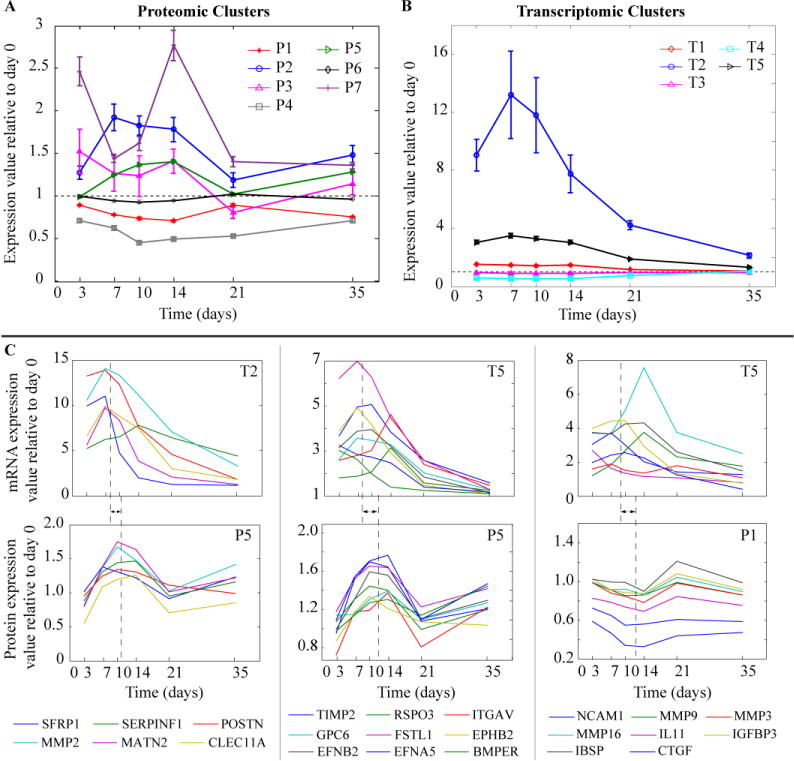
Average expression profile (error bars correspond to the standard deviation) for: (A) Proteomic clusters (cluster number indicated with prefix letter P); (B) Transcriptomic clusters (cluster number indicated with prefix letter T); and (C) For a subset of osteoblast related genes/proteins (23 out of 68): (top) mRNA gene expression and (bottom) corresponding protein level profiles. For example, the first column shows the profiles for 6 genes (listed below the subplot) that were in transcriptomic cluster 2 and proteomic cluster 5. The dashed line represents the average peak time for the shown genes and the arrow indicates the difference in the average peak time between mRNA and protein expression.
Table 2.
Key biologic processes for each of the seven proteomic clusters. n = number of serum proteins in each cluster.
| Cluster (n) | Key processes |
|---|---|
| 1 (265) | T-cell homeostatis, cell viability |
| 2 (40) | Coagulation, role of macrophages, neoplasia of epithelial tissue |
| 3 (20) | Proliferation of cells, AMPK signaling |
| 4 (40) | Organismal death, inflammatory response, necrosis |
| 5 (276) | Bone formation, angiogenesis, DNA transcription, dendritic cell maturation |
| 6 (172) | DNA transcription, dendritic cell maturation |
| 7 (17) | Cell death |
Figure 6. Enrichment within Cluster 5 for Proteins Associated with Specific Regulatory Pathway, Biological Functions, and Osteoblast Functions.
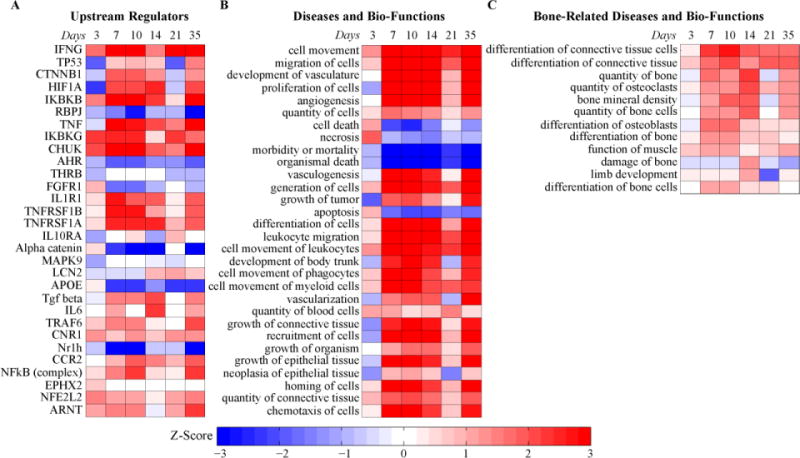
(A) Upstream regulators; (B) Diseases and bio-functions; (C) Bone-related diseases and bio-functions (subset of B). The color represents the z-score (ranging from −3 in blue to +3 in red). The rows are sorted by p-value with most significant at the top.
A comparison of the individual mRNA and protein profiles that were found in various clusters is shown in Figure 5C. Interestingly many of the mRNAs that are associated with osteoblasts such as POSTN, MMP2 and BMPER had expression profiles had their peak levels of expression between days 7 and 10 (average peak at day 8; Figure 5C). Their peak levels seen in the serum appeared on average 3–4 days later as seen in the protein expression profiles. While many of the protein expression profiles matched their mRNA expression with a time-shift, there were some proteins that had inverse profiles to that of the mRNA profiles. For example, some of the matrix metalloproteinases (MMP3, MMP9, and MMP16) were up-regulated in the transcriptome and down-regulated in the proteome (Figure 5C). As reviewed above such inverted profiles may indicate that these matrix metalloproteinases are not secreted as much into the serum during fracture healing compared to baseline or they may be cleared differently during fracture healing or other tissues may have decreased expression that spills into the serum. We specifically focused on cluster 5 since it was enriched for the greatest number of proteins that were associated with osteoblast function (Table 2). Further, ontogeny assessment of this cluster identified that catenin beta 1 (CTNNB1) a key signaling molecule in the Wnt/β-catenin signaling pathway and controls cell growth and differentiation, hypoxia-inducible factor 1-alpha (Hif1a) which promotes angiogenesis and osteogenesis, tumor necrosis factor (TNF) which is essential in regulation of bone homeostasis, and fibroblast growth factor receptor 1 (FGFR1) which plays an essential role in bone development were among the top up-stream regulators of specific proteins in this cluster (Figure 6A). Individual network relationships for upstream regulators Hif1a and CTNNB1 and biologic function related to quantity of bone at three different time points spanning the range over which their expression was up-regulated are shown in Figure 7. Each network is composed of the proteins affected by the upstream regulators or involved in the biologic function. These networks are characterized by inhibition in the activity of their respective processes at day 3 and 21, and an activation in the processes during days 7, 10, and 14 of healing. These temporal profiles coincide with the underlying biological and regulatory functions that are active within the callus tissues during this time frame of the healing process. Moreover, assessments of biological functions showed that angiogenesis, cell proliferation and apoptosis were among the top biological functions associated with the proteins in this cluster (Figure 6B). Finally, a detailed list of biological functions that are related to bone tissues and associated with proteins in this cluster are shown in Figure 6C.
Figure 7. Network relationships of molecules in proteomic cluster 5 at three different time points.
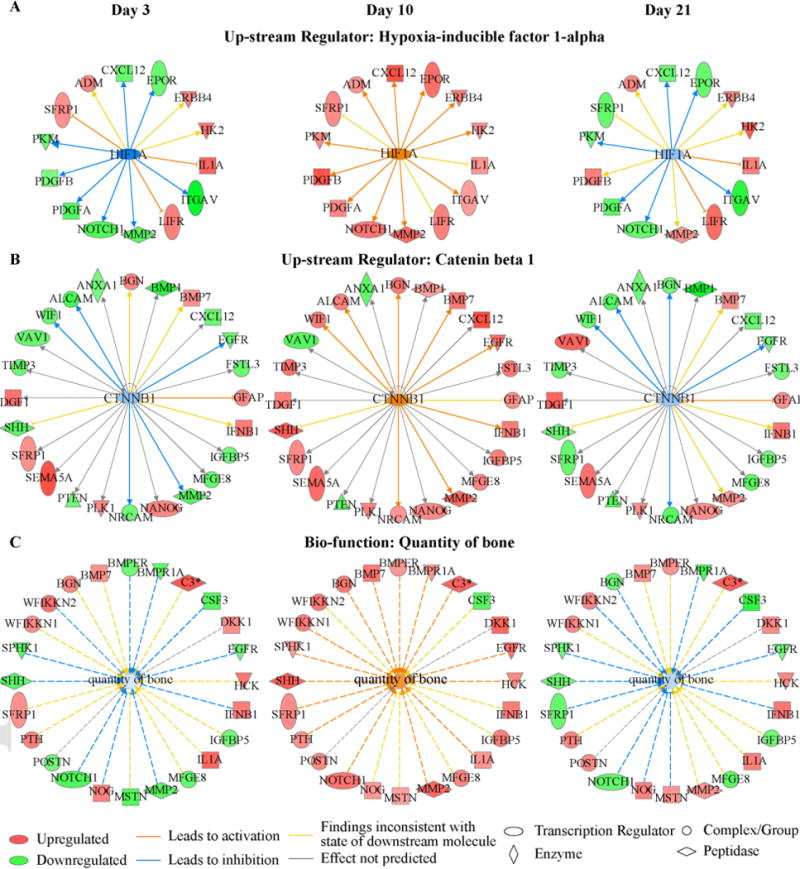
(A) Hypoxia-inducible factor 1-alpha; (B) Catenin beta 1 Cluster; and (C) Bio-function for quantity of bone.
Candidate Biomarkers of Fracture Healing
By further analysis of the proteins asscoaited with the canonical pathways that are related to the biological processes of fracture healing shown in Figure 4, a set of 50 proteins that can be used as potential biomarkers of fracture healing were identified (Table 3). The expression values for these proteins were significantly different among the time points and had a fold change greater than 1.5 or less than −1.5 at least at one time point. Among the list of candidate biomarkers are: Wnt inhibitory factor 1 (WIF-1) and Protein Wnt-7a (WNT7A) which enrich Wnt/β-catenin Signaling; Mitogen-activated protein kinase 9 (JNK2) which is associated with IL-6, TGF-β, and BMP signaling pathways; Bone morphogenetic protein 7 (BMP7) which is associated with TGF-β, and BMP signaling pathways; Fibroblast growth factor 7 (FGF7) which is associated with FGF signaling pathway; Caspase-10 (Caspase-10) which is associated with Apoptosis signaling; and Vascular endothelial growth factor A, isoform 121 (VEGF121) which is associated with IL-6 and VEGF signaling pathways.
Table 3.
Candidate list of proteins chosen after sorting the proteins based on ANOVA FDR q-value and the maximum fold change. The canonical pathways enriched by each protein is listed. Canonical pathway A: NF-κB Signaling; B: IL-6 Signaling; C: VEGF Signaling; D: Apoptosis Signaling; E: Wnt/β-catenin Signaling; F: TGF-β Signaling; G: FGF Signaling; H: BMP signaling pathway. Expression values are listed in Supplemental material.
| # | Target | In Pathway | # | Target | In Pathway |
|---|---|---|---|---|---|
| 1 | WIF-1 | E | 26 | KPCT | A, D |
| 2 | JNK2 | B, F, H | 27 | IGF-I sR | A |
| 3 | Caspase-10 | D | 28 | IGF-II receptor | A |
| 4 | RSK-like protein kinase | G | 29 | SMAD3 | F |
| 5 | KREM2 | E | 30 | SMAD2 | F |
| 6 | FGF7 | G | 31 | BMP-7 | F, H |
| 7 | CD40 ligand, soluble | A | 32 | RANK | A |
| 8 | FGF-6 | G | 33 | MP2K4 | B, D, F, H |
| 9 | VEGF121 | B, C | 34 | MK12 | B, F, G, H |
| 10 | TGF-b R III | A, E | 35 | CRK | G |
| 11 | FGF-16 | G | 36 | DKK1 | E |
| 12 | VEGF-C | C | 37 | TLR4 | A |
| 13 | WNT7A | E | 38 | Dkk-4 | E |
| 14 | TrkC | A | 39 | UBE2N | A |
| 15 | BAD | A, B | 40 | RAC1 | G |
| 16 | PDGF Rb | A | 41 | SHC1 | B, C |
| 17 | ZAP70 | A | 42 | Insulin | A |
| 18 | Activin AB | F | 43 | PRKACA | A, H |
| 19 | VEGF sR3 | A, C | 44 | FGF-18 | G |
| 20 | Cadherin-5 | E | 45 | FST | H |
| 21 | TBK1 | A | 46 | GRB2 adapter protein | A, B, C, F, G, H |
| 22 | Cadherin-12 | E | 47 | PKC-B-II | A, C |
| 23 | IL-1 R AcP | B | 48 | PKC-B-II | C |
| 24 | bFGF-R | A, B, C, G | 49 | EGFRvIII | A |
| 25 | IL-1Ra | A, B | 50 | SPTA2 | D |
Discussion
Current clinical assessments of fracture healing are primarily based on radiographs and patient reported pain levels with weight bearing. On the other hand, fracture healing is typically described as the progression of four biological phases: inflammation, soft callus formation, bony callus formation, and remodeling. While radiological findings are informative to the latter two biological phases, they do not provide any means of assessing earlier biological processes. Nor do any of the current assessment tools account for the timeliness of the underlying biological processes during fracture healing. Recent studies examining specific markers of bone formation, bone turnover, and angiogenesis have demonstrated the potential use of serum markers to predict fracture non-union(14), by relationship to the underlying biological processes active in fracture healing(15). Instead of examining specific biomarkers, the aim of this study was to screen hundreds of serum proteins and to determine whether serum proteomic changes can be used to monitor the biological progression of fracture healing.
Changes in protein expression levels were detected for hundreds of proteins over the time course of fracture healing. The overlapping nature of expression of specific proteins in many different tissues reflects both systemic responses to the fracture injury as well the specific responses of the locally injured bone tissue and the bone regenerative processes. While it is difficult to ascribe proteins to a unique tissue, the changes in expression levels relative to baseline (no fracture) are informative to many of the known local tissue-specific and systemic responses to fracture. Thus tissue and cell ontologies of the serum proteins reflected many different tissues: liver, lungs, heart, skeletal muscle, macrophages, innate and adaptive immune cells, stem cells, and bone cells. Furthermore, many of these proteins were related to functions activated during fracture healing both systemically and locally in callus tissue, such as coagulation, immune response, osteogenesis, and angiogenesis. For example, coagulation related proteins (cluster P2) peak early during the healing process between days 3 and 7. Whereas osteoblast related proteins (cluster P5) had peak expression later in the healing time course. The temporal and quantitative (up or down) concordance between the proteomic and the transcriptomic expression profiles provides additional confirmation for the relationships between the observed protein expression and the biologic functions. As an example the average, peak levels for specific osteoblast related protein appeared in the serum 3–4 days after their mRNA peak expression in the callus. Therefore, we conclude that the proteome can be used to deduce the ongoing biological processes during fracture healing. A list of 50 candidate proteins that can be used to assess the biological stages of healing was identified. Future studies will further probe these proteins to determine whether their expression profiles are altered in cases with delayed healing which was demonstrated for a few serum proteins in previous studies(11,25).
Early detection and/or prediction of delayed or impaired healing would have a tremendous impact on patients’ well being in addition to economic benefits(14). Given that multiple factors such as genetic predisposition, nutritional state, drug intake, alcohol abuse, and smoking are common risk factors for compromised bone healing(14,26–28), a combination of biomarkers will be needed to reliably predict impaired healing. The findings of this study provide evidence that a targeted proteomic approach could be used to identify those key biomarkers that are reflective both of the biological progression of skeletal tissue formation as well as informative of specific biological functions and regulatory processes that effect healing. In this regard, the proteins examined in this study are reflective of the many biological processes that are activated in fracture healing. Paired assessment of protein and mRNA expression throughout healing, helped identify the time lag in the gene expression and the presence/absence of the end products in the serum. Translational clinical studies will be required to examine the sensitivity in detecting changes in the protein expression profiles due to delayed healing as well as validate which proteins will be most informative to specific regulatory processes that change in response to specific comorbid processes that delay healing in humans. The sensitivity analyses are also best performed in human clinical studies due to the presence of multiple factors that can impair healing as well as the inherent greater genetic and environmental variabilities reflective in human studies than controlled animal studies.
The limitations of this study are mainly related to the proteomic assay used. First, the analysis is restricted to the 1310 proteins that are currently available in the assay platform. Additional proteins that are not currently assayed may be relevant to fracture healing. Second, the aptamers used were developed for the human protein and may not produce high quality signals for mouse. To avoid low quality signals, we only assessed protein with significant changes in expression levels across time. However, this may be an advantage as we transition to a human study since the aptamers are optimized for human proteins. A final limitation is that we did not include a perturbation that delayed fracture healing. However, given that the data reported here already has very strong correlations to the temporal patterns of the biological processes of healing, such data would only have added marginally to the major conclusions that we have drawn from this study. It should also be noted that the translational studies in humans will be the only valid means to assess which proteins will be useful to predict delayed healing and show associations to specific biological functions.
In summary, we found that serum proteins can provide a minimally invasive assessment tool for the progression of fracture healing. The serum proteome clearly reflects biologic processes and stages of healing of the callus tissue. The synchronized osteoblast related mRNA and protein expression indicate their potential use as biomarkers of fracture healing. Taken together, these finding demonstrate the potential use of serum proteins for prognostic assessments of fracture healing in humans.
Supplementary Material
Acknowledgments
Supported with grants from the National Institute of Arthritis and Musculoskeletal and Skin Diseases (R21AR067900 and R01AR05974 to LCG). National Center for Advancing Translational Sciences, National Institutes of Health, through BU-CTSI grant number 1UL1TR001430 (AIH). Institutional support was provided by the Department of Orthopaedic Surgery Boston University School of Medicine and by Boston University School of Medicine. The content of this study are solely the responsibility of the authors and do not necessarily represent the official views of the NIH. The authors thank Ms. Sally Lakis.
Footnotes
Authors’ contribution: Study design: AH and LG. Study conduct: AH, KL, MC, HM, and BH. Data collection: AH, KL, MC, HM, and BH. Data analysis: AH, CM, and LG. Data interpretation: AH and LG. Drafting manuscript: AH and LG. Revising manuscript content: KL, MC and PT. Approving final version of manuscript: AH, CM, KL, MC, HM, BH, PT, and LG. AH and LG takes responsibility for the integrity of the data analysis.
Disclosures: P Tornetta III: Consulting Smith & Nephew. All other co-authors have nothing to disclose
This article has been accepted for publication and undergone full peer review but has not been through the copyediting, typesetting, pagination and proofreading process, which may lead to differences between this version and the Version of Record. Please cite this article as doi: [10.1002/jor.23754]
Additional Supporting Information may be found in the online version of this article.
References
- 1.Morshed S. Current options for determining fracture union. Advances in medicine. 2014;2014 doi: 10.1155/2014/708574. [DOI] [PMC free article] [PubMed] [Google Scholar]
- 2.Goldhahn J, Scheele WH, Mitlak BH, Abadie E, Aspenberg P, Augat P, et al. Clinical evaluation of medicinal products for acceleration of fracture healing in patients with osteoporosis. Bone. 2008;43(2):343–7. doi: 10.1016/j.bone.2008.04.017. [DOI] [PubMed] [Google Scholar]
- 3.Axelrad TW, Einhorn TA. Use of clinical assessment tools in the evaluation of fracture healing. Injury. 2011;42(3):301–5. doi: 10.1016/j.injury.2010.11.043. [DOI] [PubMed] [Google Scholar]
- 4.Bhandari M, Guyatt GH, Swiontkowski MF, Tornetta P, III, Sprague S, Schemitsch EH. A lack of consensus in the assessment of fracture healing among orthopaedic surgeons. Journal of orthopaedic trauma. 2002;16(8):562–6. doi: 10.1097/00005131-200209000-00004. [DOI] [PubMed] [Google Scholar]
- 5.Lane JM, Sandhu H. Current approaches to experimental bone grafting. The Orthopedic clinics of North America. 1987;18(2):213–25. [PubMed] [Google Scholar]
- 6.Whelan DB, Bhandari M, Stephen D, Kreder H, McKee MD, Zdero R, et al. Development of the radiographic union score for tibial fractures for the assessment of tibial fracture healing after intramedullary fixation. Journal of Trauma and Acute Care Surgery. 2010;68(3):629–32. doi: 10.1097/TA.0b013e3181a7c16d. [DOI] [PubMed] [Google Scholar]
- 7.Cox G, Einhorn T, Tzioupis C, Giannoudis P. Bone-turnover markers in fracture healing. Bone & Joint Journal. 2010;92(3):329–34. doi: 10.1302/0301-620X.92B3.22787. [DOI] [PubMed] [Google Scholar]
- 8.Stoffel K, Engler H, Kuster M, Riesen W. Changes in biochemical markers after lower limb fractures. Clinical chemistry. 2007;53(1):131–4. doi: 10.1373/clinchem.2006.076976. [DOI] [PubMed] [Google Scholar]
- 9.Ivaska KK, Gerdhem P, Åkesson K, Garnero P, Obrant KJ. Effect of fracture on bone turnover markers: a longitudinal study comparing marker levels before and after injury in 113 elderly women. Journal of bone and mineral research. 2007;22(8):1155–64. doi: 10.1359/jbmr.070505. [DOI] [PubMed] [Google Scholar]
- 10.Seebeck P, Bail H, Exner C, Schell H, Michel R, Amthauer H, et al. Do serological tissue turnover markers represent callus formation during fracture healing? Bone. 2005;37(5):669–77. doi: 10.1016/j.bone.2005.06.008. [DOI] [PubMed] [Google Scholar]
- 11.Sarahrudi K, Thomas A, Braunsteiner T, Wolf H, Vécsei V, Aharinejad S. VEGF serum concentrations in patients with long bone fractures: a comparison between impaired and normal fracture healing. Journal of Orthopaedic Research. 2009;27(10):1293–7. doi: 10.1002/jor.20906. [DOI] [PubMed] [Google Scholar]
- 12.Henle P, Zimmermann G, Weiss S. Matrix metalloproteinases and failed fracture healing. Bone. 2005;37(6):791–8. doi: 10.1016/j.bone.2005.06.015. [DOI] [PubMed] [Google Scholar]
- 13.Goebel S, Lienau J, Rammoser U, Seefried L, Wintgens KF, Seufert J, et al. FGF23 is a putative marker for bone healing and regeneration. Journal of orthopaedic research. 2009;27(9):1141–6. doi: 10.1002/jor.20857. [DOI] [PubMed] [Google Scholar]
- 14.Pountos I, Georgouli T, Pneumaticos S, Giannoudis P. Fracture non-union: Can biomarkers predict outcome? Injury. 2013;44(12):1725–32. doi: 10.1016/j.injury.2013.09.009. [DOI] [PubMed] [Google Scholar]
- 15.Wigner NA, Kulkarni N, Yakavonis M, Young M, Tinsley B, Meeks B, et al. Urine matrix metalloproteinases (MMPs) as biomarkers for the progression of fracture healing. Injury. 2012;43(3):274–8. doi: 10.1016/j.injury.2011.05.038. [DOI] [PMC free article] [PubMed] [Google Scholar]
- 16.Fu Q, Schoenhoff FS, Savage WJ, Zhang P, Van Eyk JE. Multiplex assays for biomarker research and clinical application: translational science coming of age. Proteomics-Clinical Applications. 2010;4(3):271–84. doi: 10.1002/prca.200900217. [DOI] [PubMed] [Google Scholar]
- 17.Regnier FE, Skates SJ, Mesri M, Rodriguez H, Težak Ž, Kondratovich MV, et al. Protein-based multiplex assays: mock presubmissions to the US Food and Drug Administration. Clinical chemistry. 2010;56(2):165–71. doi: 10.1373/clinchem.2009.140087. [DOI] [PubMed] [Google Scholar]
- 18.Gold L, Ayers D, Bertino J, Bock C, Bock A, Brody EN, et al. Aptamer-based multiplexed proteomic technology for biomarker discovery. PloS one. 2010;5(12):e15004. doi: 10.1371/journal.pone.0015004. [DOI] [PMC free article] [PubMed] [Google Scholar]
- 19.Gerstenfeld LC, Alkhiary YM, Krall EA, Nicholls FH, Stapleton SN, Fitch JL, et al. Three-dimensional reconstruction of fracture callus morphogenesis. Journal of Histochemistry & Cytochemistry. 2006;54(11):1215–28. doi: 10.1369/jhc.6A6959.2006. [DOI] [PubMed] [Google Scholar]
- 20.Loffredo FS, Steinhauser ML, Jay SM, Gannon J, Pancoast JR, Yalamanchi P, et al. Growth differentiation factor 11 is a circulating factor that reverses age-related cardiac hypertrophy. Cell. 2013;153(4):828–39. doi: 10.1016/j.cell.2013.04.015. [DOI] [PMC free article] [PubMed] [Google Scholar]
- 21.Coenen-Stass AM, McClorey G, Manzano R, Betts CA, Blain A, Saleh AF, et al. Identification of novel, therapy-responsive protein biomarkers in a mouse model of Duchenne muscular dystrophy by aptamer-based serum proteomics. Scientific reports. 2015;5:17014. doi: 10.1038/srep17014. [DOI] [PMC free article] [PubMed] [Google Scholar]
- 22.Wang K, Vishwanath P, Eichler GS, Al-Sebaei MO, Edgar CM, Einhorn TA, et al. Analysis of fracture healing by large-scale transcriptional profile identified temporal relationships between metalloproteinase and ADAMTS mRNA expression. Matrix biology. 2006;25(5):271–81. doi: 10.1016/j.matbio.2006.02.001. [DOI] [PubMed] [Google Scholar]
- 23.Cho TJ, Gerstenfeld LC, Einhorn TA. Differential temporal expression of members of the transforming growth factor β superfamily during murine fracture healing. Journal of Bone and Mineral Research. 2002;17(3):513–20. doi: 10.1359/jbmr.2002.17.3.513. [DOI] [PubMed] [Google Scholar]
- 24.Chen EY, Tan CM, Kou Y, Duan Q, Wang Z, Meirelles GV, et al. Enrichr: interactive and collaborative HTML5 gene list enrichment analysis tool. BMC bioinformatics. 2013;14(1):1. doi: 10.1186/1471-2105-14-128. [DOI] [PMC free article] [PubMed] [Google Scholar]
- 25.Sarahrudi K, Thomas A, Mousavi M, Kaiser G, Köttstorfer J, Kecht M, et al. Elevated transforming growth factor-beta 1 (TGF-β1) levels in human fracture healing. Injury. 2011;42(8):833–7. doi: 10.1016/j.injury.2011.03.055. [DOI] [PMC free article] [PubMed] [Google Scholar]
- 26.Calori G, Albisetti W, Agus A, Iori S, Tagliabue L. Risk factors contributing to fracture non-unions. Injury. 2007;38:S11–S8. doi: 10.1016/s0020-1383(07)80004-0. [DOI] [PubMed] [Google Scholar]
- 27.Pountos I, Georgouli T, Blokhuis TJ, Pape HC, Giannoudis PV. Pharmacological agents and impairment of fracture healing: what is the evidence? Injury. 2008;39(4):384–94. doi: 10.1016/j.injury.2007.10.035. [DOI] [PubMed] [Google Scholar]
- 28.Dimitriou R, Kanakaris N, Soucacos P, Giannoudis P. Genetic predisposition to nonunion: evidence today. Injury. 2013;44:S50–S3. doi: 10.1016/S0020-1383(13)70012-3. [DOI] [PubMed] [Google Scholar]
Associated Data
This section collects any data citations, data availability statements, or supplementary materials included in this article.


