

Abstract
Neurofibrillary tangle (NFT) pathology is linked to neurodegeneration in the medial temporal lobe (MTL). Using a tailored pipeline, we correlated atrophy rate, as measured from retrospective longitudinal MRI, with NFT burden, measured from 18F-AV-1451 PET, within MTL regions of earliest NFT pathology. In amyloid-β positive but not amyloid-β negative individuals, we found significant correlation between 18F-AV-1451 uptake and atrophy rate that was strongest in the transentorhinal cortex, the first region with NFT pathology. This supports the role of NFTs in driving neurodegeneration and the utility of 18F-AV-1451 PET and structural measurement of transentorhinal cortex in tracking early tau-mediated disease progression.
Keywords: Alzheimer’s disease, amyloid, 18F-AV-1451 PET, medial temporal lobe, structural atrophy
INTRODUCTION
The recently proposed ATN system for staging Alzheimer’s disease (AD) characterizes individuals by the presence of amyloid-β (Aβ), tau-based neurofibrillary tangles (NFT), and structural neurodegeneration [1]. Investigating the relationships between these biomarkers is important to understand the underlying pathophysiology of AD. Compared to Aβ-related pathology, NFTs are more directly linked to neuronal and synaptic loss [2]. The 18F-AV-1451 [3] PET tracer promises in vivo quantification of the tau-based paired helical filaments of NFTs. Associations between 18F-AV-1451 uptake and macroscopic structural change, expected given the link between NFT pathology and neurodegeneration, were reported in recent cross-sectional studies that examined NFT-neurodegeneration relationships at the scale of the whole brain [4–7]. The current study instead examines these relationships at a granular level in the medial temporal lobe (MTL), the area of the cortex in which the spread of NFTs in the cortex originates in AD. This more focal analysis is relevant for developing and understanding biomarkers for preclinical AD, in which NFT pathology and neurodegeneration are thought to be mostly confined to the MTL [8].
A novel aspect of the current study is that it uses a longitudinal measure of neurodegeneration, as opposed to a cross-sectional measure that is likely suboptimal because it may be affected by subject variation in the volume or thickness of brain structures due to non-AD related effects, such as developmental differences. Instead, MRI-based measures of longitudinal atrophy are more directly related to active neuronal injury and thus are likely to be more closely linked to NFT burden. However, longitudinal atrophy has not been well studied in relation to tau biomarkers. Only one prior study [9] demonstrated such a relationship in a whole-brain analysis. A finding of significant association of 18F-AV-1451 uptake with localized measurements of longitudinal structural change in the earliest regions of NFT pathology (Braak stages I–II [8]) would support the potential role of these measures in monitoring of very early AD progression.
Moreover, the degree to which the linkage between NFT pathology and neuronal injury is related to the presence of cerebral amyloid is unclear, particularly within the MTL where NFT pathology is also common in the absence of amyloid, so-called primary age-related tauopathy (PART).
This study explores the association between longitudinal measures of structural neurodegeneration within the regions of earliest NFT pathology—Brodmann areas 35 (BA35), entorhinal cortex (ERC; the transentorhinal cortex is located at the ERC/BA35 boundary), hippocampus and Brodmann areas 36 (BA36; BA35 and BA36 are subregions of perirhinal cortex)—and tau burden measured by 18F-AV-1451 PET across the MTL as a whole. This relationship is examined separately within Aβ negative (Aβ−) and positive (Aβ+) subjects to determine the degree to which it is modulated by cerebral amyloid.
METHODS
Participants
We selected Alzheimer’s Disease Neuroimaging Initiative (ADNI) participants who had an 18F-AV-1451 PET scan and two T1-weighted MRI scans within 1.5 (proximal scan) and 3 years (retrospective scan) prior to the PET scan, respectively (on average, 75 ± 113 and 812 ± 196 days). There were 33 Aβ+ [13 normal controls (NC, 4 male, age: 77.4 ± 5.1 years, Mini-Mental Status Examination (MMSE): 28.5 ± 1.6), 15 mild cognitive impairment (MCI, 10 male, age: 79.3 ± 6.5 years, MMSE: 27.9 ± 2.0), and 5 AD (5 male, age: 81.4 ± 5.4 years, MMSE: 22.4 ± 5.5)] and 36 Aβ− [22 NC (12 male, age: 71.2 ± 5.0 years, MMSE: 29.3 ± 0.9) and 14 MCI (8 male, age: 73.4 ± 6.8 years, MMSE: 28.6 ± 2.1)] subjects. Details of ADNI as well as PET and MRI acquisitions are provided in the Supplementary Material.
Neuroimaging data processing
Quantify region of interest (ROI) and pointwise longitudinal rate of structural change
The pipeline used for quantification of rate of structural change from the MRI scans is specially designed for MTL substructures, which overcomes crucial limitations of conventional approaches that are often optimized for whole-brain analysis. Figure 1 is a schematic flowchart that summarizes the pipeline and highlights its unique aspects. In brief, it contains the following three steps.
Fig. 1.
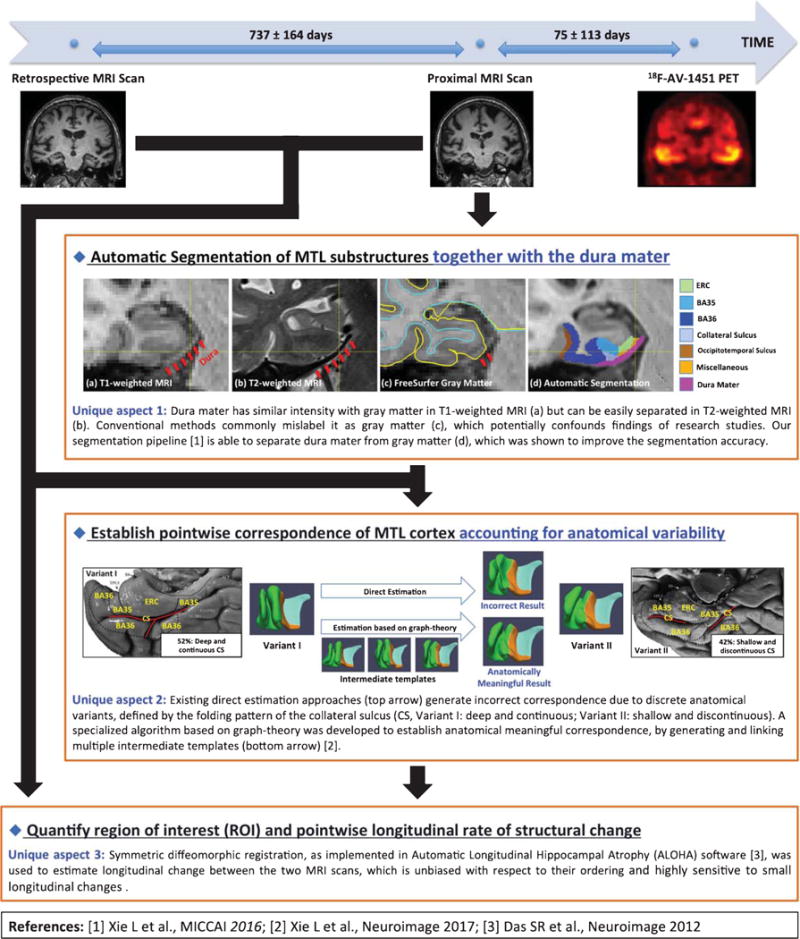
Schematic flowchart of the tailored pipeline that quantifies region of interest (ROI) and pointwise longitudinal rate of structural change. The pipeline is specially designed for the medial temporal lobe (MTL) substructures with the three unique aspects highlighted in the figure. CS, collateral sulcus; ERC, entorhinal cortex; BA35 and BA36, Brodmann areas 35 and 36.
Segmentation of ROI: A multi-atlas segmentation algorithm was used to segment eight MTL ROIs: bilateral hippocampus, ERC, BA35, and BA36 in the proximal MRI of each subject. The algorithm warps a set of expert-labeled MRI scans called “atlases” to the target MRI scan and combines them into a consensus segmentation [10]. Segmentation of MTL cortex in T1-weighted MRI is challenging because it is hard to separate the dura mater from gray matter in T1-weighted MRI. As shown in Fig. 1, the dura mater is juxtaposed to inferior MTL cortex and has similar signal intensity to gray matter in T1-weighted MRI. It is commonly mislabeled as gray matter by conventional methods, which may confound findings of research studies. By contrast, in T2-weighted MRI, dura mater can be easily separated from gray matter due to its dark appearance (Fig. 1). Uniquely, our atlases are assigned a separate label for the dura mater using information from both T1-weighted and T2-weighted MRI images in the same subjects. This was shown to improve the segmentation accuracy over conventional segmentation methods that do not account for this confound explicitly [11]. A composite “MTL-cortex” ROI was generated by combining ERC, BA35 and BA36 of each hemisphere.
Establishing pointwise correspondence of MTL cortex: Quantifying regional effects within MTL cortex requires anatomically meaningful pointwise correspondence between all subjects. To achieve this, the subjects’ MTL cortical ROIs were coregistered in a groupwise fashion to a common template using a specialized algorithm that accounts for large variability in the folding patterns of the MTL cortex by generating and linking multiple intermediate templates [12, 13]. Our prior study showed that the algorithm is able to establish anatomically meaningful correspondence while the conventional approaches cannot [12, 13]. Pointwise and summary measures of cortical thickness were derived from the template fitting. Each hemisphere was processed separately.
Computation of annualized atrophy rate: Annualized atrophy rate in hippocampal volume and in the thickness of the cortical ROIs was estimated using symmetric diffeomorphic registration [14] between the two MRI scans, as implemented in Automatic Longitudinal Hippocampal Atrophy software. Conventional approaches commonly choose one MRI scan as the fixed image and perform registration on the other one, which may introduce bias in longitudinal change estimation. Instead, the symmetric diffeomorphic registration brings the two MRI scans into a “middle” image space and was shown to be unbiased with respect to the ordering of the MRI scans and highly sensitive to small longitudinal changes [15].
MTL 18F-AV-1451 uptake
The pre-processed 18F-AV-1451 scans were first rigidly aligned to the proximal MRI of the same subjects, and then converted to a standardized-uptake-value-ratio (SUVR) maps using mean 18F-AV-1451 uptake in cerebellar gray matter as reference. 18F-AV-1451 uptake in the left/right “MTL-cortex” ROI was then derived.
Amyloid-β status
The Florbetapir PET scans were converted to SUVR maps using whole cerebellum as reference. A global Florbetapir SUVR was computed by averaging mean SUVR in anterior/posterior cingulate, precuneus, middle/superior temporal cortex, middle frontal, inferior parietal, and supra marginal gyrus. Subjects with global SUVR ≥ 1.11 were regarded to be Aβ+.
Statistical analysis
Correlation analysis was used to test the hypothesis that higher MTL tau burden is associated with faster annualized atrophy rate in early Braak regions. In ROI-level analyses, Spearman correlation was performed between the annualized atrophy rate of each ROI and age-adjusted MTL 18F-AV-1451 uptake. In the pointwise MTL cortical thickness analysis, a general linear modal was fit at each point on the MTL surface, with global MTL 18F-AV-1451 uptake as the independent variable, pointwise annualized atrophy rate as the factor of interest, and age as covariate. A cluster-level family-wise-error-rate approach [16] was used to correct for multiple comparisons. All the analyses were performed separately for each hemisphere of Aβ+ and Aβ− subjects.
RESULTS
Among Aβ+ subjects, MTL 18F-AV-1451 uptake was significantly positively correlated with annualized atrophy rate in MTL cortex (Table 1), with the largest effect in the right BA35 (scatter plot in Supplementary Figure 1), but not in bilateral hippocampus. Pointwise analysis results (Fig. 2A) demonstrate that the correlation of annualized atrophy rate with tau burden was most prominent in the bilateral transentorhinal cortices (lateral ERC/BA35), the area that Braak and Braak [8] identified as the earliest cortical site of NFT deposition (Fig. 2B). No significant correlation was found in Aβ− subjects in both ROI and pointwise analyses.
Table 1.
Spearman correlation between rate of structural change (volume change for hippocampus; thickness change for ERC, BA35, and BA36) of all the ROIs and age-adjusted medial temporal lobe 18F-AV-1451 uptake. Analyses were performed on each hemisphere separately. Positive correlation indicates higher MTL tau burden correlates with structural atrophy
| Measurements
|
Statistics
|
||
|---|---|---|---|
| Region | Side | Amyloid β Positive (n = 33) | Amyloid β Negative (n = 36) |
| ERC | Left | rho = 0.31, p = 0.080 | rho = –0.27, p = 0.112 |
| Right | rho = 0.58, p < 0.001** | rho = –0.31, p = 0.070 | |
| BA35 | Left | rho = 0.46, p = 0.006* | rho = –0.00, p = 0.980 |
| Right | rho = 0.68, p < 0.001** | rho = –0.31, p = 0.066 | |
| BA36 | Left | rho = 0.58, p < 0.001** | rho = –0.06, p = 0.733 |
| Right | rho = 0.31, p = 0.079 | rho = –0.22, p = 0.198 | |
| Hippocampus | Left | rho = 0.09, p = 0.609 | rho = –0.12, p = 0.472 |
| Right | rho = 0.20, p = 0.270 | rho = –0.10, p = 0.553 | |
p < 0.05, p < 0.001. ROI, region of interest; ERC, entorhinal cortex; BA35 and BA36, Brodmann areas 35 and 36.
Fig. 2.
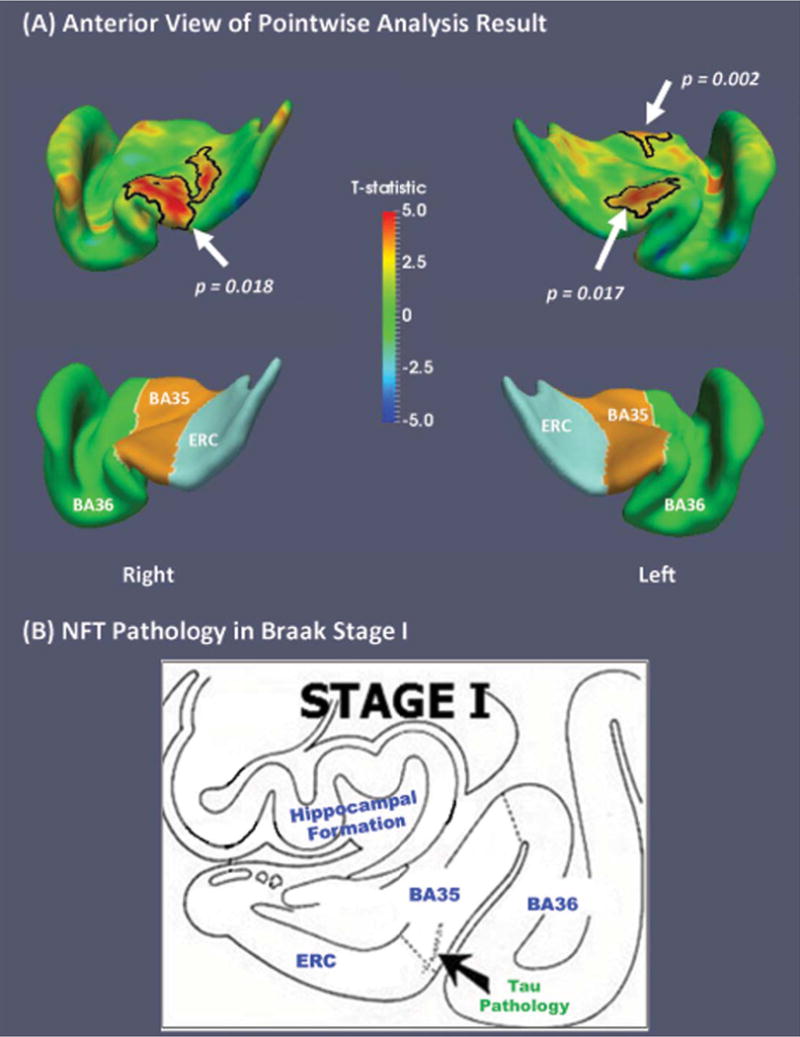
A) Regional statistical analysis results of annual longitudinal change versus medial temporal lobe 18F-AV-1451 uptake within Aβ+ subjects (n = 33) from the Alzheimer’s Disease Neuroimaging Initiative (ADNI). Bottom row shows the corresponding label maps. The correlation was most prominent in the bilateral transentorhinal cortices (lateral ERC/BA35), the earliest cortical site of NFT deposition [Braak I, shown in (B), adapted from Braak and Braak (1995) [8]]. No significant correlation was found in Aβ− subjects (n = 36). Black contours highlight significant clusters after corrected for multiple comparisons in cluster level (p < 0.05, clusters were defined using an empirical threshold of p = 0.01). NFT, neurofibrillary tangle; ERC, entorhinal cortex; BA35 and BA36, Brodmann areas 35 and 36.
DISCUSSION
We found significant positive associations between MTL 18F-AV-1451 uptake, a putative measure of NFT burden, with antecedent annualized atrophy rate in several MTL regions in individuals with evidence of cerebral amyloid. This finding is consistent with the notion that increased accumulation of tau pathology is linked to more robust neurodegeneration. Moreover, pointwise analysis further localized the strongest effect to the transentorhinal cortex. Finally, the lack of this relationship in the absence of cerebral amyloid suggests that the active neurodegeneration associated with NFT pathology may be mediated by the presence of brain amyloid.
These findings are consistent with Braak staging of NFT pathology [8]. Over the course of AD progression, sites of earliest NFT pathology are likely to accumulate more NFTs and to undergo more neurodegeneration than other MTL regions. This difference should be particularly pronounced in preclinical and prodromal AD, where NFT pathology is largely circumscribed to early Braak regions. The finding of strongest correlations between annualized atrophy rate and 18F-AV-1451 uptake in the bilateral transentorhinal cortices fits this model, and provides further validation for the clinical significance of 18F-AV-1451 in tracking AD-related neurodegeneration in the MTL.
No significant correlation was found in Aβ− subjects. PART is a common feature of Aβ− individuals in the age range of this cohort with NFT burden usually spanning Braak stages I–IV and, thus, including the regions examined here. Some have argued that a proportion of the Aβ− cognitively normal and MCI patients with evidence of AD-like neurodegeneration, often referred to as having suspected non-Alzheimer’s pathophysiology (or SNAP) [17], may have PART as the driver of their neurodegenerative change. However, the lack of correlation here between atrophy rate with MTL 18F-AV-1451 uptake suggests that NFTs may have a more limited effect on the rate of neurodegeneration in the absence of cerebral amyloid. If this is the case, perhaps a longer timeframe than the current study would be necessary to reveal this relationship. Alternatively, it could be that there is little or no relationship between NFT pathology and neurodegeneration in the absence of cerebral amyloid (but note Josephs et al. [18] for evidence of increased antemortem MTL atrophy with increasing Braak stage in postmortem PART cases). Finally, it is also possible that 18F-AV-1451 binds less avidly to more “immature” tangles that are potentially more predominant in PART [19]. Understanding the linkage between 18F-AV-1451 and other tau tracers and PART is critical given the potential importance of this condition to age-associated cognitive changes [20].
A novel aspect of this study is the use of a tailored pipeline optimized for measuring cortical MTL substructures. Quantifying longitudinal atrophy in these regions is challenging due to large anatomical variability of sulcal patterns, particularly collateral sulcus, which influence the location of boundaries between BA35 and ERC (i.e., transentorhinal cortex) [21]. Further, when using T1-weighted MRI, dura mater, which has similar intensity as gray matter, produces an additional confound in this region. Conventional methods that do not account for these confounds, produce measurement noise that could obscure the early structural change revealed in the current analysis [11].
Limitations and future work
Resolution of PET precludes measurement of 18F-AV-1451 uptake in individual MTL subregions necessitating a composite measure which limits the inference related to the linkage of specific ROIs. Also, the small sample prevents us from more precisely interpreting the null relationship in Aβ− subjects. Finally, the temporal order of tau deposition and the resulting neurodegeneration cannot be established due to the retrospective nature of this study. Future investigation with a larger sample size in which 18F-AV-1451 PET and structural MRI are obtained prospectively is necessary and such data will be forthcoming from ADNI, as well as other cohorts, over the next several years.
Supplementary Material
Acknowledgments
This work was supported by National Institute of Health (NIH) (grant numbers R01-AG037376, R01-EB017255, R01-AG056104, R01-AG040271, P30-AG010124, R01-AG055005) and the donors of Alzheimer’s Disease Research, a program of the BrightFocus Foundation (L.E.M.W.).
Data collection and sharing for this project was funded by the Alzheimer’s Disease Neuroimaging Initiative (ADNI) (National Institutes of Health Grant U01 AG024904) and DOD ADNI (Department of Defense award number W81XWH-12-2-0012). ADNI is funded by the National Institute on Aging, the National Institute of Biomedical Imaging and Bioengineering, and through generous contributions from the following: AbbVie, Alzheimer’s Association; Alzheimer’s Drug Discovery Foundation; Araclon Biotech; BioClinica, Inc.; Biogen; Bristol-Myers Squibb Company; CereSpir, Inc.; Cogstate; Eisai Inc.; Elan Pharmaceuticals, Inc.; Eli Lilly and Company; EuroImmun; F. Hoffmann-La Roche Ltd and its affiliated company Genentech, Inc.; Fujirebio; GE Healthcare; IXICO Ltd.; Janssen Alzheimer Immunotherapy Research & Development, LLC.; Johnson & Johnson Pharmaceutical Research & Development LLC.; Lumosity; Lundbeck; Merck & Co., Inc.; Meso Scale Diagnostics, LLC.; NeuroRx Research; Neurotrack Technologies; Novartis Pharmaceuticals Corporation; Pfizer Inc.; Piramal Imaging; Servier; Takeda Pharmaceutical Company; and Transition Therapeutics. The Canadian Institutes of Health Research is providing funds to support ADNI clinical sites in Canada. Private sector contributions are facilitated by the Foundation for the National Institutes of Health (http://www.fnih.org). The grantee organization is the Northern California Institute for Research and Education, and the study is coordinated by the Alzheimer’s Therapeutic Research Institute at the University of Southern California. ADNI data are disseminated by the Laboratory for Neuro Imaging at the University of Southern California.
Footnotes
Authors’ disclosures available online (https://www.j-alz.com/manuscript-disclosures/17-0945r1).
SUPPLEMENTARY MATERIAL
The supplementary material is available in the electronic version of this article: http://dx.doi.org/10.3233/JAD-170945.
References
- 1.Jack CR, Bennett DA, Blennow K, Carrillo MC, Feldman HH, Frisoni GB, Hampel H, Jagust WJ, Johnson KA, Knopman DS, Petersen RC, Scheltens P, Sperling RA, Dubois B, Dubois B. A/T/N: An unbiased descriptive classification scheme for Alzheimer disease biomarkers. Neurology. 2016;87:539–547. doi: 10.1212/WNL.0000000000002923. [DOI] [PMC free article] [PubMed] [Google Scholar]
- 2.Giacobini E, Gold G. Alzheimer disease therapy—moving from amyloid-β to tau. Nat Rev Neurol. 2013;9:677–686. doi: 10.1038/nrneurol.2013.223. [DOI] [PubMed] [Google Scholar]
- 3.Xia C-F, Arteaga J, Chen G, Gangadharmath U, Gomez LF, Kasi D, Lam C, Liang Q, Liu C, Mocharla VP, Mu F, Sinha A, Su H, Szardenings AK, Walsh JC, Wang E, Yu C, Zhang W, Zhao T, Kolb HC. [18F]T807, a novel tau positron emission tomography imaging agent for Alzheimer’s disease. Alzheimers Dement. 2013;9:666–676. doi: 10.1016/j.jalz.2012.11.008. [DOI] [PubMed] [Google Scholar]
- 4.Wang L, Benzinger TL, Su Y, Christensen J, Friedrichsen K, Aldea P, McConathy J, Cairns NJ, Fagan AM, Morris JC, Ances BM. Evaluation of tau imaging in staging Alzheimer disease and revealing interactions between β-amyloid and tauopathy. JAMA Neurol. 2016;73:1070. doi: 10.1001/jamaneurol.2016.2078. [DOI] [PMC free article] [PubMed] [Google Scholar]
- 5.Xia C, Makaretz SJ, Caso C, McGinnis S, Gomperts SN, Sepulcre J, Gomez-Isla T, Hyman BT, Schultz A, Vasdev N, Johnson KA, Dickerson BC. Association of in vivo [18 F]AV-1451 tau PET imaging results with cortical atrophy and symptoms in typical and atypical Alzheimer disease. JAMA Neurol. 2017;74:427. doi: 10.1001/jamaneurol.2016.5755. [DOI] [PMC free article] [PubMed] [Google Scholar]
- 6.Dronse J, Fliessbach K, Bischof GN, von Reutern B, Faber J, Hammes J, Kuhnert G, Neumaier B, Onur OA, Kukolja J, van Eimeren T, Jessen F, Fink GR, Klockgether T, Drzezga A. In vivo patterns of tau pathology, amyloid-β burden, and neuronal dysfunction in clinical variants of Alzheimer’s disease. J Alzheimers Dis. 2016;55:465–471. doi: 10.3233/JAD-160316. [DOI] [PubMed] [Google Scholar]
- 7.Sepulcre J, Schultz AP, Sabuncu M, Gomez-Isla T, Chhatwal J, Becker A, Sperling R, Johnson KA. In vivo tau, amyloid, and gray matter profiles in the aging brain. J Neurosci. 2016;36:7364–7374. doi: 10.1523/JNEUROSCI.0639-16.2016. [DOI] [PMC free article] [PubMed] [Google Scholar]
- 8.Braak H, Braak E. Staging of Alzheimer’s disease-related neurofibrillary changes. Neurobiol Aging. 1995;16:271–278. doi: 10.1016/0197-4580(95)00021-6. [DOI] [PubMed] [Google Scholar]
- 9.LaPoint MR, Chhatwal JP, Sepulcre J, Johnson KA, Sperling RA, Schultz AP. The association between tau PET and retrospective cortical thinning in clinically normal elderly. Neuroimage. 2017;157:612–622. doi: 10.1016/j.neuroimage.2017.05.049. [DOI] [PMC free article] [PubMed] [Google Scholar]
- 10.Wang H, Suh JW, Das SR, Pluta J, Craige C, Yushkevich PA. Multi-atlas segmentation with joint label fusion. IEEE Trans Pattern Anal Mach Intell. 2012;35:611–623. doi: 10.1109/TPAMI.2012.143. [DOI] [PMC free article] [PubMed] [Google Scholar]
- 11.Xie L, Wisse LEM, Das SR, Wang H, Wolk DA, Manjón JV, Yushkevich PA. Accounting for the confound of meninges in segmenting entorhinal and perirhinal cortices in T1-Weighted MRI. Medical Image Computing and Computer-Assisted Intervention–MICCAI 2016. 2016:564–571. doi: 10.1007/978-3-319-46723-8_65. [DOI] [PMC free article] [PubMed] [Google Scholar]
- 12.Xie L, Pluta JB, Das SR, Wisse LEM, Wang H, Mancuso L, Kliot D, Avants BB, Ding S-L, Manjón JV, Wolk DA, Yushkevich PA. Multi-template analysis of human perirhinal cortex in brain MRI: Explicitly accounting for anatomical variability. Neuroimage. 2017;144:183–202. doi: 10.1016/j.neuroimage.2016.09.070. [DOI] [PMC free article] [PubMed] [Google Scholar]
- 13.Xie L, Pluta J, Wang H, Das SR, Mancuso L, Kliot D, Avants BB, Ding S-L, Wolk DA, Yushkevich PA. Automatic clustering and thickness measurement of anatomical variants of the human perirhinal cortex. Medical Image Computing and Computer-Assisted Intervention–MICCAI 2014. 2014:81–88. doi: 10.1007/978-3-319-10443-0_11. [DOI] [PMC free article] [PubMed] [Google Scholar]
- 14.Avants BB, Epstein CL, Grossman M, Gee JC. Symmetric diffeomorphic image registration with cross-correlation: Evaluating automated labeling of elderly and neurodegenerative brain. Med Image Anal. 2008;12:26–41. doi: 10.1016/j.media.2007.06.004. [DOI] [PMC free article] [PubMed] [Google Scholar]
- 15.Das SR, Avants BB, Pluta J, Wang H, Suh JW, Weiner MW, Mueller SG, Yushkevich PA. Measuring longitudinal change in the hippocampal formation from in vivo high-resolution T2-weighted MRI. Neuroimage. 2012;60:1266–1279. doi: 10.1016/j.neuroimage.2012.01.098. [DOI] [PMC free article] [PubMed] [Google Scholar]
- 16.Nichols T, Hayasaka S. Controlling the family-wise error rate in functional neuroimaging: A comparative review. Stat Methods Med Res. 2003;12:419–446. doi: 10.1191/0962280203sm341ra. [DOI] [PubMed] [Google Scholar]
- 17.Jack CR, Knopman DS, Chételat G, Dickson D, Fagan AM, Frisoni GB, Jagust W, Mormino EC, Petersen RC, Sperling RA, van der Flier WM, Villemagne VL, Visser PJ, Vos SJB, Vos SJB. Suspected non-Alzheimer disease pathophysiology–concept and controversy. Nat Rev Neurol. 2016;12:117–124. doi: 10.1038/nrneurol.2015.251. [DOI] [PMC free article] [PubMed] [Google Scholar]
- 18.Josephs KA, Murray ME, Tosakulwong N, Whitwell JL, Knopman DS, Machulda MM, Weigand SD, Boeve BF, Kantarci K, Petrucelli L, Lowe VJ, Jack CR, Petersen RC, Parisi JE, Dickson DW. Tau aggregation influences cognition and hippocampal atrophy in the absence of beta-amyloid: A clinico-imaging-pathological study of primary age-related tauopathy (PART) Acta Neuropathol. 2017;133:705–715. doi: 10.1007/s00401-017-1681-2. [DOI] [PMC free article] [PubMed] [Google Scholar]
- 19.Lowe VJ, Curran G, Fang P, Liesinger AM, Josephs KA, Parisi JE, Kantarci K, Boeve BF, Pandey MK, Bruinsma T, Knopman DS, Jones DT, Petrucelli L, Cook CN, Graff-Radford NR, Dickson DW, Petersen RC, Jack CR, Murray ME, Murray ME. An autoradiographic evaluation of AV-1451 tau PET in dementia. Acta Neuropathol Commun. 2016;4:58. doi: 10.1186/s40478-016-0315-6. [DOI] [PMC free article] [PubMed] [Google Scholar]
- 20.Jefferson-George KS, Wolk DA, Lee EB, McMillan CT. Cognitive decline associated with pathological burden in primary age-related tauopathy. Alzheimers Dement. 2017;139:1551–1567. doi: 10.1016/j.jalz.2017.01.028. [DOI] [PMC free article] [PubMed] [Google Scholar]
- 21.Ding S-L, Van Hoesen GW. Borders, extent, and topography of human perirhinal cortex as revealed using multiple modern neuroanatomical and pathological markers. Hum Brain Mapp. 2010;31:1359–1379. doi: 10.1002/hbm.20940. [DOI] [PMC free article] [PubMed] [Google Scholar]
Associated Data
This section collects any data citations, data availability statements, or supplementary materials included in this article.