

Abstract
Objectives:
To determine whether associations of calf muscle density with physical function are independent of other determinants of functional decline in overweight and obese older adults.
Methods:
This was a secondary analysis of a cross-sectional study of 85 community-dwelling overweight and obese adults (mean±SD age 62.8±7.9 years; BMI 32.3±6.1 kg/m2; 58% women). Peripheral quantitative computed tomography assessed mid-calf muscle density (66% tibial length) and dual-energy X-ray absorptiometry determined visceral fat area. Fasting glucose, Homeostatic Model Assessment of Insulin Resistance (HOMA-IR) and C-reactive protein (CRP) were analysed. Physical function assessments included hand grip and knee extension strength, balance path length (computerised posturography), stair climb test, Short Physical Performance Battery (SPPB) and self-reported falls efficacy (Modified Falls Efficacy Scale; M-FES).
Results:
Visceral fat area, not muscle density, was independently associated with CRP and fasting glucose (B=0.025; 95% CI 0.009-0.042 and B=0.009; 0.001-0.017, respectively). Nevertheless, higher muscle density was independently associated with lower path length and stair climb time, and higher SPPB and M-FES scores (all P<0.05). Visceral fat area, fasting glucose and CRP did not mediate these associations.
Conclusions:
Higher calf muscle density predicts better physical function in overweight and obese older adults independent of insulin resistance, visceral adiposity or inflammation.
Keywords: Muscle Density, Physical Function, Abdominal Obesity, Insulin Resistance, Inflammation
Introduction
Almost 40% of older adults living in western countries are obese[1,2]. An obese older individual has similar life expectancy to a non-obese counterpart, but has health care costs around $US40,000 higher owing to their increased risk for cardiometabolic disorders (e.g. cardiovascular disease and type 2 diabetes mellitus; T2DM), and also disability[3]. Indeed, obese older adults have low relative muscle strength[4], poor mobility[5] and increased likelihood of falls[6]. High levels of calf intra- and intermuscular adipose tissue (IMAT) appear to be an important contributor to poor physical function in obese older adults[7]. However high IMAT levels are associated with T2DM[8,9], a condition known to also compromise physical function[10]. It is unclear whether the effects of IMAT on physical function in overweight and obese older adults are explained by characteristics associated with T2DM, such as increased insulin resistance, visceral adiposity and inflammatory markers, all of which may independently accelerate functional decline[11,12].
Peripheral quantitative computed tomography (pQCT) scans can be utilised to indirectly assess calf IMAT through assessment of skeletal muscle density (fat between muscle fibres and within muscle cells), with lower density indicating higher IMAT levels[13]. We previously reported that higher calf muscle density is associated with better muscle strength, physical function and balance in non-obese older adults[14]. The aim of the present study was to examine the associations of calf muscle density with objectively-assessed and self-reported physical function in overweight and obese older adults, and to determine whether these associations are independent of characteristics of T2DM.
Materials and methods
Study design and participants
This is a secondary analysis of a cross-sectional study designed to explore associations between components of obesity and musculoskeletal health in overweight and obese older adults. A convenience sample of eighty-five overweight or obese (body mass index [BMI] ≥25 kg/m2) community-dwelling adults aged ≥50 years residing in Melbourne, Australia who responded to advertisements at local hospitals, general practices, community groups, and sporting and recreation clubs, were recruited for this study. Participants were English speaking, capable of walking across a room unaided, and had no self-reported diagnosis of progressive neurological or psychotic disorders, severe arthritis (awaiting a joint replacement), or life expectancy <12 months. The study was approved by the Melbourne Health Human Research Ethics Committee and participants provided written informed consent. All aspects of the research complied with the World Medical Association Declaration of Helsinki - Ethical Principles for Medical Research Involving Human Subjects.
All testing was conducted at the Clinical Trials Unit at the Australian Institute for Musculoskeletal Science (AIMSS) between March 2014 and August 2016. A blood sample was collected at the hospital pathology centre after an overnight fast of at least 10 hours. Serum glucose, high-density lipoprotein (HDL) cholesterol, and triglycerides concentrations were analysed using the automated ADVIA 1650 Chemistry System (Siemens Healthcare Diagnostics Incorporation, Australia). Serum insulin concentration was analysed by a commercial solid-phase, enzyme-labelled chemiluminescentimmunometric assay (IMMULITE 2000 Insulin, Siemens, Bayswater, Australia), which has sensitivity of 2 µIU/mL. The Homeostatic Model Assessment of Insulin Resistance (HOMA-IR) score was calculated from fasting glucose and insulin values[15]. A latex enhanced immunoturbidimetric assay determined serum wide range C-reactive protein (CRP) concentration (ADVIA 1650; CV=3.5%). Pathology reported non-detectable CRP levels as <1 mg/L and an arbitrary value of 0.1 mg/L was assigned to these cases. The DiaSorin LIAISON (DiaSorin Inc, Stillwater, MN, USA) chemiluminescent immunoassay measured serum 25-hydroxyvitamin D (25OHD) concentrations.
A self-administered questionnaire including questions on employment status and chronic health conditions including cardiovascular disease (coronary heart disease and/or hypertension) and diabetes was completed. Self-rated health was also assessed by response to the question “Would you say that in general your health is:” with possible responses of: excellent; very good; good; fair; poor. Total minutes of weekly moderate and vigorous physical activity was assessed by the Active Australia Survey[16].
Anthropometrics, body composition and calf muscle density
Weight (Seca 804 electronic scales, Seca, Hamburg, Germany) and height (Seca 222 wall-mounted stadiometer, Seca, Hamburg, Germany) were measured with footwear, headwear, and heavy items of clothing removed. Body mass index (BMI) was calculated as weight (kg)/ height (m2).
A whole-body DXA (Hologic Discovery W, Hologic, Bedford MA, USA) determined total body fat percentage, appendicular lean mass (ALM; kg) and visceral fat area (cm2). DXA-derived visceral fat measurements have demonstrated excellent agreement with CT assessments[17] and predictive ability for poor cardiometabolic health[18]. The study DXA was calibrated daily using the manufacturer’s spine phantom and the short-term intra-individual coefficient of variation (CV) for ALM in our laboratory was 1.0%.
A single 2.5-mm transverse pQCT (Stratec XCT3000, Stratec Medizintechnik GmbH, Pforzheim, Germany) scan with a voxel size of 0.8 mm and scan speed of 20 mm/sec was obtained at 66% of tibial length of the dominant leg, measured proximally beginning from the tibiotarsal joint which was identified by a scout view. The dominant leg was preferentially selected for this assessment in order to allow comparability of muscle composition measures with knee extension strength assessed in the same limb. All pQCT scans were acquired and analysed by one observer (DS). Calf muscle cross-sectional area (mm2) and density (mg/cm[3]; density of tissue within the muscle compartment after removal of subcutaneous fat and bone areas) were determined using manufacturer’s algorithms and software (version 6.2). The device was calibrated daily using the manufacturer’s phantom and short-term intra-individual CV for muscle density was 1.0%.
Physical function
As a self-reported assessment of physical function, participants completed the self-administered Modified Falls Efficacy Scale (M-FES), a 14-item questionnaire with demonstrated reliability and validity for assessment of falls self-efficacy, where higher scores indicate greater confidence in performing activities without falling[19]. Participants also completed the Short Physical Performance Battery (SPPB), which is a highly validated measure of physical performance and disability in older adults[20]. A summary score of 0 to 12 (higher score indicating better function) is obtained based on performance in three tasks: gait speed over a 2.44m course, repeated chair stands, and standing balance assessments. Participants with SPPB scores ≤9 were considered to have poor physical performance[21]. All participants were capable of completing the gait speed test without walking aids.
Mean time taken for two attempts at ascending a 10-step flight of stairs as quickly as possible (participants could use the handrail if required) was also assessed[22]. Hand grip strength of the dominant hand was assessed using a Jamar Plus Digital hydraulic hand grip dynamometer (Patterson Medical, Bolingbrook, IL, USA). Participants were seated with their elbow fully extended in front of them at shoulder height and gripped the dynamometer with maximal force for three seconds. The test was completed three times with a 30-second rest between trials and the mean value was recorded. Knee extension strength was assessed using a hand-held dynamometer (HHD; Lafayette Manual Muscle Tester Model 01165, Lafayette Instrument Company, Lafayette, IN, USA). The participant was seated with their arms folded across their chest, hip and knee joint angles at 90 degrees, and feet above the floor. The participant exerted maximal force for three seconds to the HHD, which was held stationary by the tester about 10 cm above the ankle joint. Mean peak force from three trials was calculated.
Balance path length (total distance travelled by the centre of pressure) was assessed during a 30-second bipedal standing balance task with feet apart and eyes open using a Nintendo Wii Balance Board (RVL-021; Nintendo, Kyoto, Japan) and custom software. The test measures movements in centre of pressure with acceptable reliability and validity compared to a laboratory-grade force platform[23,24]. Mean values from two 30-second trials with 30 second inter-trial rest periods were calculated. Higher scores indicated poorer balance.
Finally, sarcopenia was defined according to the algorithm suggested by the European Working Group on Sarcopenia (EWGSOP) as low ALM normalised to height (ALMHt[2]; men: <7.26 kg/m2, women: <5.5 kg/m2) with either low hand grip strength (men: <30 kg, women: <20 kg) or low gait speed (both men and women ≤0.8 m/s)[25].
Statistical analyses
Continuous data were assessed for normality and non-parametric tests were used as appropriate. In order to compare key characteristics of overweight and obesity between individuals with and without poor physical performance, independent samples t-tests and Mann-Whitney U tests compared calf muscle density, visceral fat area, fasting glucose, HOMA-IR and CRP between groups stratified by low (≤9) or normal (>9) SPPB scores. Spearman correlations examined associations for muscle density and visceral fat area with blood biochemistry parameters, and also for fasting glucose, HOMA-IR and CRP levels with physical function measures. Scatterplots and Pearson correlations were obtained for associations between total body fat, visceral fat area, muscle density, and physical function measures. Correlation coefficients were interpreted using guidelines provided by Hinkle et al.[26]. Multivariable linear regression analyses examined associations of visceral fat area and muscle density with fasting glucose after mutual adjustment and further adjustment for age, sex, CRP and moderate/vigorous physical activity. These analyses were repeated with HOMA-IR as the dependent variable and a multivariable regression also explored associations of visceral fat area and muscle density with CRP after mutual adjustment and further adjustment for age, sex, fasting glucose and moderate/vigorous physical activity. Finally, multivariable linear regression models examined associations of muscle density with physical function measures. To explore associations of muscle density after adjustment for demographic variables associated with physical function, Model 1 was adjusted for age, sex and moderate/vigorous physical activity. Model 2 was further adjusted for fasting glucose and visceral fat area in a stepwise fashion to determine whether associations were independent of the T2DM characteristics abdominal obesity and hyperglycaemia. Fasting glucose was preferentially included in these models over HOMA-IR given it demonstrated a stronger association with both physical performance and muscle density in univariable analyses. Finally, CRP was added as a covariate in Model 3 to determine whether associations were additionally independent of systemic inflammation levels. Variance Inflation Factors were examined to ensure there were no multicollinearity issues in all models.
Mediation analyses were also performed to examine whether fasting glucose, visceral fat area, and CRP mediated observed significant associations between muscle density and physical function parameters in multivariable linear regression models. These analyses were performed using the SPSS PROCESS macro which uses bootstrapped unstandardised multiple linear regressions with 5,000 samples[27]. The estimates of the total indirect effects for the mediator variables (fasting glucose, visceral fat area, and CRP) were calculated with muscle density as the independent variable and the relevant physical function measure as the dependent variable. Covariates age, sex and moderate/vigorous physical activity were also included in these mediation models.
P-values <0.05 or 95% confidence intervals (CI) not including the null point were considered statistically significant. All analyses were performed in SPSS Statistics 24 (IBM, USA).
Results
Descriptive characteristics for 85 adults aged 50 years and older who participated in this study are presented in [Table 1]. Approximately half (52%) were obese (BMI ≥30 kg/m2), and 19% and 57% had low hand grip strength and low gait speed, respectively, but none had low ALMHt[2] according to the EWGSOP definition of sarcopenia.
Table 1.
Descriptive characteristics for N=85 participants.
| Age (y) | 62.8 ±7.9 |
| Female (%) | 58 |
| Retired or pension (%) | 42 |
| Self-rated health excellent or very good (%) | 39 |
| Self-reported CVD (%) | 46 |
| Self-reported diabetes (%) | 21 |
| Fasting glucose (mmol/L), median (IQR) | 5.6 (5.2, 6.5) |
| Fasting insulin (mIU/L), median (IQR) | 7.0 (4.0, 12.3) |
| HOMA-IR, median (IQR) | 1.6 (1.1, 4.0) |
| HDL cholesterol (mmol/L), median (IQR) | 1.4 (1.1, 1.6) |
| Triglycerides (mmol/L), median (IQR) | 1.3 (1.0, 1.8) |
| CRP (mg/L), median (IQR) | 2.0 (0.1, 5.0) |
| 25OHD (nmol/L) | 49.6 ±17.7 |
| Moderate/vigorous activity (mins/week) | 130.4 ±221.2 |
| Body weight (kg) | 88.0 ±18.3 |
| BMI (kg/m2) | 32.3 ±6.1 |
| Total body fat (%) | 37.9 ±8.7 |
| Visceral fat area (g) | 194.7 ±75.5 |
| Calf muscle CSA (mm2) | 7499.1 ±1601.7 |
| Calf muscle density (mg/cm3) | 72.0 ±3.9 |
| Hand grip strength (kg) | 31.1 ±10.9 |
| Knee extension strength (kg) | 17.1 ±9.3 |
| Path length (cm) | 40.4 ±17.4 |
| Stair climb time (s) | 5.9 ±2.6 |
| Chair stands time (s) | 14.5 ±8.9 |
| Gait speed (m/s) | 0.8 ±0.2 |
| SPPB score | 9.9 ±1.8 |
| M-FES score | 127.6 ±18.3 |
All data are mean ± SD or frequency (%) unless otherwise specified. Abbreviations: CVD; cardiovascular disease, IQR; interquartile range, HOMA-IR; Homeostatic Model Assessment of Insulin Resistance, HDL; high-density lipoprotein, CRP; C-reactive protein, 25OHD; 25-hydroxyvitamin D, BMI; body mass index, ALM; appendicular lean mass, CSA; cross-sectional area, SPPB; Short Physical Performance Battery, M-FES; Modified Falls Efficacy Scale.
[Figure 1] presents scatterplots for associations of total body fat and visceral fat area with calf muscle density. Pearson correlations revealed similar low negative correlations for both visceral fat area and total body fat with muscle density. Comparing associations of visceral fat area and muscle density with biochemistry measures (Table 2), visceral fat area appeared to be more consistently associated with these biochemical outcomes. Muscle density was negatively correlated with CRP levels only, whereas visceral fat area was positively correlated with fasting glucose, insulin, HOMA-IR, triglycerides and CRP, and had a negative correlation with HDL cholesterol. Multivariable regression demonstrated that visceral fat area was positively associated with fasting glucose (0.009; 0.001, 0.017; P=0.027), but not HOMA-IR (P=0.070), after adjustment for age, sex, physical activity, muscle density and CRP levels. After adjustment for age, sex, physical activity and fasting glucose levels, and following mutual adjustment, visceral fat area (B=0.025; 95% CI 0.009, 0.042; P=0.003), but not muscle density (-0.154; -0.439, 0.132; P=0.287), was associated with CRP.
Figure 1.
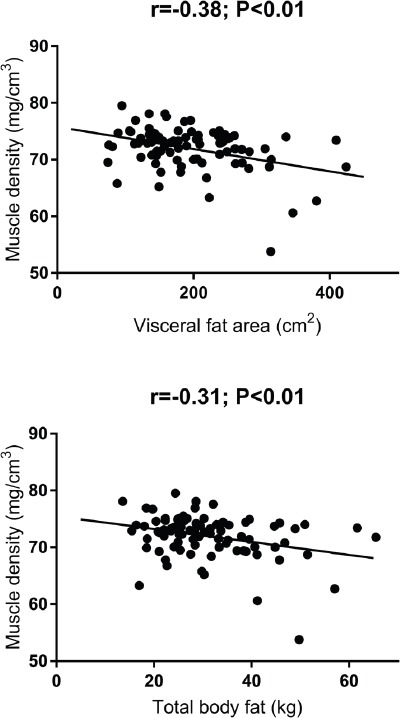
Scatterplots for associations of calf muscle density with total body fat percentage and visceral fat area.
Table 2.
Correlation coefficients (P-values) for calf muscle density and visceral fat area with biochemistry parameters.
| Calf muscle density | Visceral fat area | |
|---|---|---|
| Fasting glucose | -0.163 (0.140) | 0.418 (<0.001) |
| Insulin | 0.073 (0.509) | 0.411 (<0.001) |
| HOMA-IR | 0.031 (0.781) | 0.406 (<0.001) |
| HDL cholesterol | -0.015 (0.895) | -0.394 (<0.001) |
| Triglycerides | 0.077 (0.485) | 0.233 (0.033) |
| CRP | -0.225 (0.038) | 0.418 (<0.001) |
| 25OHD | -0.103 (0.349) | -0.130 (0.240) |
All Spearman correlations. Abbreviations: HOMA-IR; Homeostatic Model Assessment of Insulin Resistance, HDL; high-density lipoprotein, CRP; C-reactive protein, 25OHD; 25-hydroxyvitamin D.
[Figure 2] compares characteristics of T2DM according to physical performance status. Participants with a SPPB score ≤9 (41%; indicating poor physical performance) had significantly lower calf muscle density, but similar visceral fat area, as those with normal SPPB scores. There were also no differences in CRP levels between groups, but fasting glucose levels were significantly higher in those with poor physical performance. Despite this, there were no differences between groups in HOMA-IR scores (P=0.229; data not shown). Furthermore, as reported in [Table 3], calf muscle density was negatively correlated with path length, stair climb and chair stands time, and positively correlated with SPPB and M-FES scores. Visceral fat area and fasting glucose were negatively correlated with SPPB score only. CRP was positively correlated with balance path length and stair climb time.
Figure 2.
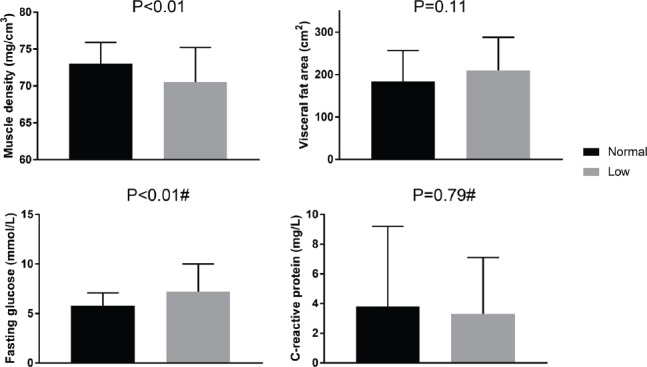
Comparisons of calf muscle density, visceral fat area, fasting glucose and C-reactive protein levels between groups stratified by low (≤9) or normal (>9) SPPB scores. #Mann-Whitney test for difference between groups, others are independent samples t-tests.
Table 3.
Correlation coefficients (P-values) for features of insulin resistance with physical function parameters.
| Calf muscle density | Visceral fat area | Fasting glucose* | HOMA-IR* | CRP* | |
|---|---|---|---|---|---|
| Hand grip strength | 0.085 (0.438) | 0.166 (0.130) | -0.004 (0.969) | 0.094 (0.396) | -0.141 (0.200) |
| Knee extension strength | 0.197 (0.070) | -0.143 (0.192) | -0.194 (0.078) | -0.063 (0.569) | -0.164 (0.132) |
| Path length | -0.353 (0.001) | 0.072 (0.527) | 0.165 (0.149) | 0.090 (0.434) | 0.281 (0.012) |
| Stair climb time | -0.434 (<0.001) | 0.207 (0.057) | 0.162 (0.142) | 0.105 (0.344) | 0.238 (0.028) |
| Chair stands time | -0.370 (0.001) | 0.034 (0.763) | 0.202 (0.070) | 0.028 (0.802) | 0.034 (0.762) |
| Gait speed | 0.170 (0.123) | -0.160 (0.147) | -0.151 (0.175) | -0.126 (0.258) | -0.078 (0.479) |
| SPPB score | 0.322 (0.003) | -0.220 (0.043) | -0.293 (0.007) | -0.140 (0.207) | -0.008 (0.941) |
| M-FES score | 0.401 (<0.001) | -0.169 (0.122) | -0.112 (0.314) | -0.050 (0.655) | 0.053 (0.629) |
Pearson correlations except *Spearman correlations.
[Table 4] presents multivariable linear regression analyses describing associations for calf muscle density with physical function measures after adjustment for confounders. In Model 1, after adjustment for age, sex and physical activity, higher calf muscle density was associated with lower balance path length, stair climb and chair stands time, and higher overall SPPB and M-FES scores. Each of these associations remained significant after further adjustment for fasting glucose and visceral fat area (Model 2), and additionally, CRP (Model 3). Bootstrapped mediation models adjusted for age, sex and physical activity demonstrated that fasting glucose, visceral fat area and CRP did not mediate the significant associations between muscle density and physical function measures observed in model 3. The estimates of the total indirect effects of these variables on path length (95% CI: -0.90, 0.33), stair climb time (-0.15, 0.02), chair stands time (-0.15, 0.53), SPPB score (-0.04, 0.09) and M-FES score (-0.52, 0.46) were all non-significant.
Table 4.
Multivariable linear regression analyses exploring associations between muscle density and physical function with adjustment for features of insulin resistance.
| Model 1 | Model 2 | Model 3 | |
|---|---|---|---|
| Hand grip strength (kg) | 0.043 (-0.359, 0.444) | -0.034 (-0.484, 0.415) | -0.015 (-0.469, 0.440) |
| Knee extension strength (kg) | 0.395 (-0.121, 0.912) | 0.130 (-0.440, 0.699) | 0.112 (-0.465, 0.689) |
| Path length (cm) | -1.780 (-2.696, -0.865) | -1.638 (-2.687, -0.589) | -1.573 (-2.630, -0.515) |
| Stair climb time (s) | -0.267 (-0.405, -0.129) | -0.235 (-0.393, -0.077) | -0.219 (-0.376, -0.061) |
| Chair stands time (s) | -0.797 (-1.405, -0.188) | -0.886 (-1.556, -0.216) | -0.866 (-1.553, -0.179) |
| Gait speed (m/s) | 0.005 (-0.005, 0.014) | 0.003 (-0.008, 0.014) | 0.003 (-0.008, 0.014) |
| SPPB score | 0.144 (0.043, 0.244) | 0.113 (0.004, 0.222) | 0.118 (0.007, 0.228) |
| M-FES score | 2.263 (1.293, 3.234) | 2.302 (1.230, 3.374) | 2.346 (1.261, 3.431) |
Data are regression coefficients and (95% CI) for muscle density (mg/cm3). Model 1 adjusted for age, sex and moderate/vigorous physical activity. Model 2 adjusted for Model 1 plus fasting glucose and visceral adipose tissue. Model 3 adjusted for Model 2 plus CRP. Abbreviations: SPPB; Short Physical Performance Battery, M-FES; Modified Falls Efficacy Scale.
Discussion
This cross-sectional study of community-dwelling overweight and obese older adults demonstrated that although some features of T2DM are associated with poorer physical performance, they do not mediate associations of lower levels of calf muscle density with reduced physical function. This suggests that effects of lower muscle density unrelated to T2DM are responsible for poorer function during ageing, and is supported by the fact that muscle density itself was not independently associated with cardiometabolic markers. Muscle density is only one component of many neuromuscular factors which undergo deleterious changes during ageing but these independent associations, if supported by longitudinal data, suggest it should be a focus for interventions targeting physical function in overweight and obese older adults.
It seems logical that accumulation of fat in one ectopic compartment might indicate similar increases in other ectopic compartments, and that appears to be supported by the fact that calf muscle density was negatively correlated with visceral fat area in this study. However, the correlation with visceral fat area was low in magnitude and a previous study using magnetic resonance imaging demonstrated positive sex-adjusted associations for erector spinae IMAT with intra-abdominal adipose tissue (β=0.6; P<0.01) in adults aged ≤50 years, but not older adults (P>0.05)[28]. These findings suggest that higher IMAT is representative of abdominal adiposity in younger adults, with both potentially reflecting higher sedentary behaviour or poor diets. However, distribution of body fat notably shifts from subcutaneous to ectopic depots from middle-age and beyond[29], indicating age-related factors, such as hormonal changes and comorbidities, primarily contribute to accumulation of visceral fat in older adults.
The results from this study suggest that visceral adipose tissue and calf muscle density have differing associations with biochemical cardiometabolic health and inflammatory markers. Only visceral fat area, not calf muscle density, was associated with CRP and fasting glucose after mutual adjustment, and visceral fat area was also significantly correlated with fasting glucose, insulin, HOMA-IR, HDL cholesterol and triglycerides. Higher IMAT levels have been associated with increased insulin resistance[30] and inflammatory markers[31] in studies not adjusting for visceral adipose tissue. However, similar to the current study, Guglielmi et al. reported that serum triglycerides levels were not significantly associated with IMAT after adjustment for abdominal adiposity[28], suggesting that relationships of IMAT with markers of poor cardiometabolic health are not independent of other ectopic fat compartments. Furthermore, an analysis of almost 3,000 participants of the Health ABC Study demonstrated that intermuscular fat was positively associated with insulin levels in normal weight, but not obese, older adults[32]. It is possible that high levels of visceral adiposity commonly observed in obese individuals make a greater contribution to insulin resistance than the smaller IMAT compartment, which may explain why muscle density was not associated with cardiometabolic parameters in the overweight and obese cohort examined in the present study.
Despite the fact that lower levels of calf muscle density were not associated with cardiometabolic or inflammation markers in multivariable models, it was a consistent independent predictor of poor physical function in this population of overweight and obese community-dwelling older adults. Research has demonstrated that characteristics of obesity and T2DM such as abdominal adiposity, insulin resistance and high inflammatory markers are associated with accelerated functional decline in older adults[9]. In the InCHIANTI study, participants with T2DM demonstrated slow walking speed and 10-15% of the difference compared with non-diabetic participants was explained by their lower calf muscle density[33]. The present study similarly suggests that lower levels of calf muscle density make an important independent contribution to poor physical function in overweight and obese older adults. In fully adjusted models, higher calf muscle density was associated with better mobility and balance, consistent with our previous research[14]. These associations likely explain the relationship of higher muscle density with greater self-reported falls efficacy, and high calf muscle density has been associated with reduced likelihood of falls in women[34]. Improvements in muscle density may therefore increase obese older adults’ confidence in their ability to avoid falls during daily activities, which is an important outcome for this population who have increased falls risk[6] and who are likely to benefit from increased activity levels.
Our mediation analyses confirmed that characteristics of T2DM did not mediate associations of lower muscle density with poor physical function, suggesting that other mechanisms explain the effect of IMAT on muscle function. A direct effect of higher IMAT content in muscle may be a reduction in contractile tissue area as well as deleterious alterations in muscle fibre orientation and force capacity[35]. It has been suggested that IMAT impairs blood flow to muscle[13], and this may also have negative effects on muscle function. Furthermore, higher intramuscular fat is linked with mitochondrial dysfunction which may be related to increased risk for T2DM[36], but also declines in physical function[37]. However, it should also be noted that the measurement of CRP as an inflammatory marker in this study may not reflect the associations of muscle density with inflammatory markers such as interleukin-6 and tumour necrosis factor-α which may mediate its relationship with physical function[31].
The primary limitations of this study were its cross-sectional design and relatively small sample size which was recruited via convenience sampling and not based on power calculations. There were also no adjustments made for the multiple comparisons performed in our analyses. The cohort consisted of older overweight and obese community-dwelling adults, and the results may not be generalisable to those of very old age or with extreme obesity. Indeed, no participant in this study met criteria for sarcopenia, although this was explained by the absence of participants with low muscle mass rather than poor physical function. Furthermore, mean calf muscle density in our cohort was slightly higher than that reported in the InCHIANTI study (72 vs 70 mg/cm[3])[33], likely owing to the younger mean age of our cohort (63 vs 74 years). A CT assessment of visceral adipose tissue may have improved comparability with the calf muscle density assessment, although DXA-assessed visceral fat area shows excellent agreement with CT assessments[17] and its independent relationships with biochemical markers of cardiometabolic health provide confidence in the DXA measure in this study. However, CRP, fasting glucose and HOMA-IR are not gold-standard assessments of inflammation and insulin resistance status and future studies should explore measurements including local proinflammatory cytokines and hyperinsulinaemic-euglycaemic clamps.
Nevertheless, the findings of the present study suggest that improvements in features of insulin resistance may not necessarily be beneficial in reducing the effects of lower levels of calf muscle density on physical function in overweight and obese older adults. As such, interventions should specifically target improvements in muscle density. A trial of dietary restriction and exercise versus a health education control for six months in twenty-seven obese middle aged and older women demonstrated that this intervention reduced both thigh and calf IMAT, but only reductions in calf IMAT were associated with an increase in walking speed[38]. Another study demonstrated that six months of dietary restriction and exercise in obese older adults resulted in greater declines in thigh IMAT than exercise and health education, suggesting weight loss is key for reducing IMAT in this population[39]. In addition, in mobility-limited older adults with low vitamin D status, six months of exercise plus a nutritional supplement containing protein and vitamin D, improved thigh muscle composition better than exercise alone[40]. Thus, weight loss (while maintaining adequate nutritional intake), combined with exercise, appears the best strategy for improving lower-limb muscle density with subsequent functional benefits in obese older adults.
In conclusion, higher calf muscle density predicts better physical function in overweight and obese older adults. This effect is independent and does not appear to be explained by lower levels of insulin resistance, visceral adiposity or inflammation, suggesting interventions aimed at improving physical function in obesity should specifically target increasing muscle density.
Acknowledgements
We gratefully acknowledge the study participants and thank Andrew Tang, Tanja Trbojevic Andrew Sutanto, Denny Brail and Luciana Darling for their contributions to participant recruitment and data collection. This study was supported by an Australian Institute for Musculoskeletal Science (AIMSS) Seed Grant and University of Melbourne Early Career Researcher Grant. DS and RAC are both supported by NHMRC RD Wright Biomedical Career Development Fellowships. LBM is supported by an Australian Postgraduate Award.
Footnotes
The authors have no conflict of interest.
Edited by: G. Lyritis
Role of the funding body
The funding bodies had no role in the study design, conduct analysis or interpretation of data, or the decision to publish.
Author Contributions
DS, RC, KS and PE conceived and designed the study. DS, CSL, LM, JM, and AH were involved in participant recruitment, data collection and data entry. GD provided access to research tools and input on analysis and interpretation. DS accepts responsibility for integrity of the data. All authors have read and approved the manuscript.
References
- 1.Flegal KM, Kruszon-Moran D, Carroll MD, Fryar CD, Ogden CL. Trends in obesity among adults in the united states 2005 to 2014. JAMA. 2016;315:2284–91. doi: 10.1001/jama.2016.6458. [DOI] [PMC free article] [PubMed] [Google Scholar]
- 2.Walls HL, Magliano DJ, Stevenson CE, et al. Projected progression of the prevalence of obesity in Australia. Obesity. 2011;20:872–8. doi: 10.1038/oby.2010.338. [DOI] [PubMed] [Google Scholar]
- 3.Lakdawalla DN, Goldman DP, Shang B. The health and cost consequences of obesity among the future elderly. Health Aff (Millwood) 2005;24(Suppl 2):W5R30–41. doi: 10.1377/hlthaff.w5.r30. [DOI] [PubMed] [Google Scholar]
- 4.Villareal DT, Banks M, Siener C, Sinacore DR, Klein S. Physical frailty and body composition in obese elderly men and women. Obes Res. 2004;12:913–20. doi: 10.1038/oby.2004.111. [DOI] [PubMed] [Google Scholar]
- 5.Asp M, Simonsson B, Larm P, Molarius A. Physical mobility, physical activity, and obesity among elderly:findings from a large population-based Swedish survey. Public Health. 147:84–91. doi: 10.1016/j.puhe.2017.01.032. [DOI] [PubMed] [Google Scholar]
- 6.Himes CL, Reynolds SL. Effect of obesity on falls, injury, and disability. J Am Geriatr Soc. 2012;60:124–9. doi: 10.1111/j.1532-5415.2011.03767.x. [DOI] [PubMed] [Google Scholar]
- 7.Hilton TN, Tuttle LJ, Bohnert KL, Mueller MJ, Sinacore DR. Excessive adipose tissue infiltration in skeletal muscle in individuals with obesity, diabetes mellitus, and peripheral neuropathy:association with performance and function. PHYS THER. 2008;88:1336–44. doi: 10.2522/ptj.20080079. [DOI] [PMC free article] [PubMed] [Google Scholar]
- 8.Miljkovic I, Cauley JA, Wang PY, et al. Abdominal myosteatosis is independently associated with hyperinsulinemia and insulin resistance among older men without diabetes. Obesity. 2013;21:2118–25. doi: 10.1002/oby.20346. [DOI] [PMC free article] [PubMed] [Google Scholar]
- 9.Anton SD, Karabetian C, Naugle K, Buford TW. Obesity and Diabetes as Accelerators of Functional Decline;Can Lifestyle Interventions Maintain Functional Status in High Risk Older Adults? Exp Gerontol. 2013;48(9):888–97. doi: 10.1016/j.exger.2013.06.007. [DOI] [PMC free article] [PubMed] [Google Scholar]
- 10.Sayer AA, Dennison EM, Syddall HE, Gilbody HJ, Phillips DIW, Cooper C. Type 2 Diabetes, Muscle Strength, and Impaired Physical Function. Diabetes Care. 2005;28:2541–2. doi: 10.2337/diacare.28.10.2541. [DOI] [PubMed] [Google Scholar]
- 11.Bouchard DR, Janssen I. Dynapenic-obesity and physical function in older adults. J Gerontol A Biol Sci Med Sci. 2010;65:71–7. doi: 10.1093/gerona/glp159. [DOI] [PubMed] [Google Scholar]
- 12.Stenholm S, Rantanen T, Heliövaara M, Koskinen S. The mediating role of C-reactive protein and handgrip strength between obesity and walking limitation. J Am Geriatr Soc. 2008;56:462–9. doi: 10.1111/j.1532-5415.2007.01567.x. [DOI] [PubMed] [Google Scholar]
- 13.Miljkovic I, Kuipers AL, Cauley JA, et al. Greater skeletal muscle fat infiltration is associated with higher all-cause and cardiovascular mortality in older men. J Gerontol A Biol Sci Med Sci. 2015;70:1133–40. doi: 10.1093/gerona/glv027. [DOI] [PMC free article] [PubMed] [Google Scholar]
- 14.Scott D, Trbojevic T, Skinner E, et al. Associations of calf inter-and intra-muscular adipose tissue with cardiometabolic health and physical function in community-dwelling older adults. J Musculoskelet Neuronal Interact. 2015;15:350–7. [PMC free article] [PubMed] [Google Scholar]
- 15.Wallace TM, Levy JC, Matthews DR. Use and Abuse of HOMA Modeling. Diabetes Care. 2004;27:1487–95. doi: 10.2337/diacare.27.6.1487. [DOI] [PubMed] [Google Scholar]
- 16.Brown WJ, Burton NW, Marshall AL, Miller YD. Reliability and validity of a modified self-administered version of the Active Australia physical activity survey in a sample of mid-age women. Aust N Z J Public Health. 2008;32:535–41. doi: 10.1111/j.1753-6405.2008.00305.x. [DOI] [PubMed] [Google Scholar]
- 17.Micklesfield LK, Goedecke JH, Punyanitya M, Wilson KE, Kelly TL. Dual-energy X-ray performs as well as clinical computed tomography for the measurement of visceral fat. Obesity (Silver Spring) 2012;20:1109–14. doi: 10.1038/oby.2011.367. [DOI] [PMC free article] [PubMed] [Google Scholar]
- 18.Bi X, Seabolt L, Shibao C, et al. DXA-measured visceral adipose tissue predicts impaired glucose tolerance and metabolic syndrome in obese Caucasian and African-American women. Eur J Clin Nutr. 2015;69(3):329–36. doi: 10.1038/ejcn.2014.227. [DOI] [PMC free article] [PubMed] [Google Scholar]
- 19.Hill KD, Schwarz JA, Kalogeropoulos AJ, Gibson SJ. Fear of falling revisited. Arch Phys Med Rehabil. 1996;77:1025–9. doi: 10.1016/s0003-9993(96)90063-5. [DOI] [PubMed] [Google Scholar]
- 20.Freiberger E, de Vreede P, Schoene D, et al. Performance-based physical function in older community-dwelling persons:a systematic review of instruments. Age Ageing. 2012;41:712–21. doi: 10.1093/ageing/afs099. [DOI] [PubMed] [Google Scholar]
- 21.Guralnik JM, Ferrucci L, Pieper CF, et al. Lower extremity function and subsequent disability:Consistency across Studies, predictive models, and value of gait speed alone compared with the Short Physical Performance Battery. J Gerontol A Biol Sci Med Sci. 2000;55:M221–M31. doi: 10.1093/gerona/55.4.m221. [DOI] [PubMed] [Google Scholar]
- 22.Bean JF, Kiely DK, LaRose S, Alian J, Frontera WR. Is stair climb power a clinically relevant measure of leg power impairments in at-risk older adults? Arch Phys Med Rehabil. 2007;88:604–9. doi: 10.1016/j.apmr.2007.02.004. [DOI] [PubMed] [Google Scholar]
- 23.Clark RA, Bryant AL, Pua Y, McCrory P, Bennell K, Hunt M. Validity and reliability of the Nintendo Wii Balance Board for assessment of standing balance. Gait Posture. 2010;31:307–10. doi: 10.1016/j.gaitpost.2009.11.012. [DOI] [PubMed] [Google Scholar]
- 24.Huurnink A, Fransz DP, Kingma I, van Dieën JH. Comparison of a laboratory grade force platform with a Nintendo Wii Balance Board on measurement of postural control in single-leg stance balance tasks. J Biomech. 2013;46:1392–5. doi: 10.1016/j.jbiomech.2013.02.018. [DOI] [PubMed] [Google Scholar]
- 25.Cruz-Jentoft AJ, Baeyens JP, Bauer JM, et al. Sarcopenia:European consensus on definition and diagnosis:Report of the European Working Group on Sarcopenia in Older People. Age Ageing. 2010;39:412–23. doi: 10.1093/ageing/afq034. [DOI] [PMC free article] [PubMed] [Google Scholar]
- 26.Hinkle D, Wiersma W, Jurs S. Applied Statistics for the Behavioral Sciences. 5th ed. Boston: Houghton Mifflin; 2003. [Google Scholar]
- 27.Hayes AF. Introduction to mediation, moderation, and conditional process analysis:A regression-based approach:Guilford Publications. 2017 [Google Scholar]
- 28.Guglielmi V, Maresca L, D'Adamo M, et al. Age-related different relationships between ectopic adipose tissues and measures of central obesity in sedentary subjects. PLoS ONE. 2014;9 doi: 10.1371/journal.pone.0103381. [DOI] [PMC free article] [PubMed] [Google Scholar]
- 29.Palmer AK, Kirkland JL. Aging and adipose tissue:potential interventions for diabetes and regenerative medicine. Exp Gerontol. 2016;86:97–105. doi: 10.1016/j.exger.2016.02.013. [DOI] [PMC free article] [PubMed] [Google Scholar]
- 30.Goodpaster BH, Thaete FL, Kelley DE. Thigh adipose tissue distribution is associated with insulin resistance in obesity and in type 2 diabetes mellitus. Am J Clin Nutr. 2000;71:885–92. doi: 10.1093/ajcn/71.4.885. [DOI] [PubMed] [Google Scholar]
- 31.Beasley LE, Koster A, Newman AB, et al. Inflammation and race and gender differences in computerized tomography-measured adipose depots. Obesity. 2009;17:1062–9. doi: 10.1038/oby.2008.627. [DOI] [PMC free article] [PubMed] [Google Scholar]
- 32.Goodpaster BH, Krishnaswami S, Resnick H, et al. Association between regional adipose tissue distribution and both type 2 diabetes and impaired glucose tolerance in elderly men and women. Diabetes Care. 2003;26:372–9. doi: 10.2337/diacare.26.2.372. [DOI] [PubMed] [Google Scholar]
- 33.Volpato S, Bianchi L, Lauretani F, et al. Role of muscle mass and muscle quality in the association between diabetes and gait speed. Diabetes Care. 2012;35:1672–9. doi: 10.2337/dc11-2202. [DOI] [PMC free article] [PubMed] [Google Scholar]
- 34.Frank A, Farthing J, Chilibeck P, Arnold C, Olszynski W, Kontulainen S. Community-dwelling female fallers have lower muscle density in their lower legs than non-fallers:evidence from the Saskatoon Canadian Multicentre Osteoporosis Study (CaMos) cohort. J Nutr Health Aging. 2015;19:113–20. doi: 10.1007/s12603-014-0476-6. [DOI] [PubMed] [Google Scholar]
- 35.Marcus RL, Addison O, Dibble LE, Foreman KB, Morrell G, LaStayo P. Intramuscular adipose tissue, sarcopenia, and mobility function in older individuals. J Aging Res. 2012 doi: 10.1155/2012/629637. doi:10.1155/2012/629637. [DOI] [PMC free article] [PubMed] [Google Scholar]
- 36.Schrauwen P. High-fat diet, muscular lipotoxicity and insulin resistance. Proc Nutr Soc. 2007;66:33–41. doi: 10.1017/S0029665107005277. [DOI] [PubMed] [Google Scholar]
- 37.Marzetti E, Calvani R, Cesari M, et al. Mitochondrial dysfunction and sarcopenia of aging:from signaling pathways to clinical trials. The International Journal of Biochemistry & Cell Biology. doi: 10.1016/j.biocel.2013.06.024. [DOI] [PMC free article] [PubMed] [Google Scholar]
- 38.Manini TM, Buford TW, Lott DJ, et al. Effect of dietary restriction and exercise on lower extremity tissue compartments in obese, older women:a pilot study. J Gerontol A Biol Sci Med Sci. 2014;69:101–8. doi: 10.1093/gerona/gls337. [DOI] [PMC free article] [PubMed] [Google Scholar]
- 39.Santanasto A, Glynn N, Newman M, et al. Impact of weight loss on physical function with changes in strength, muscle mass, and muscle fat infiltration in overweight to moderately obese older adults:a randomized clinical trial. Journal of Obesity. 2011 doi: 10.1155/2011/516576. doi:10.1155/2011/516576. [DOI] [PMC free article] [PubMed] [Google Scholar]
- 40.Englund D, Kirn D, Koochek A, et al. Nutritional supplementation with physical activity improves muscle composition in mobility-limited older adults, the VIVE2 study:a randomized, double-blind, placebo-controlled trial. J Gerontol A Biol Sci Med Sci. 2017 doi: 10.1093/gerona/glx141. [DOI] [PMC free article] [PubMed] [Google Scholar]