

Abstract
The National Clinical Database (NCD) of Japan started its registration in 2011 and over 9 000 000 cases from more than 5000 facilities were registered over a 6‐year period. This is the report of NCD based upon gastrointestinal surgery information in excess of 3 200 000 cases from 2011 to 2016 adding data of complications. About 70% of all gastrointestinal surgeries were carried out at certified institutions, and the percentage of surgeries done at certified institutions was particularly high for the esophagus (92.4% in 2016), liver (88.4%), pancreas (89.8%), and spleen (86.8%). The percentage of anesthesiologist participation was more than 90% for almost all organs, except 85.7% for the rectum and anus. Approximately, more than two‐thirds of the surgeries were carried out with the participation of a board‐certified surgeon. Although patients have been getting older, mortalities have not been increasing. There were differences in the incidence of complications according to organ site and procedure. Remarkably, mortality rates of low anterior resection were very low, and those of hepatectomy and acute diffuse peritonitis surgery have been gradually decreasing. Although the complication rates were gradually increasing for esophagectomy or pancreaticoduodenectomy, the mortality rates for these procedures were decreasing. Nationwide, this database is expected to ensure the quality of the board‐certification system and surgical outcomes in gastroenterological surgery.
Keywords: gastroenterological surgery, National Clinical Database, surgical outcome
1. INTRODUCTION
The National Clinical Database (NCD) was founded in 2010 as the parent body of the database system linked to the board‐certification system.1 The NCD database project, which started recordkeeping in January 2011, covers records of ≥95% of the surgeries carried out by regular surgeons in Japan.2 Almost 5000 facilities have enrolled and over 9 100 000 cases have been registered as of the end of December 2016.
In the gastrointestinal surgery section, all surgical cases are registered and require detailed input items for eight procedures representing the performance of surgery in each specialty (esophagectomy, distal gastrectomy, total gastrectomy, right hemicolectomy, low anterior resection, hepatectomy, pancreatoduodenectomy, and surgery for acute diffuse peritonitis). Risk models of mortality for each procedure were created using approximately 120 000 cases registered in 2011, and each model has been accepted and published in peer‐reviewed journals.3, 4, 5, 6, 7, 8, 9, 10 All reports were the first‐risk stratification studies, based on a Japanese nationwide Web‐based database. Mortality rates were almost satisfactory compared to those in the Western world. In case of esophagectomy, risk models may not be markedly influenced by choice of open or laparoscopic esophagectomy.3 The 30‐day mortality may underestimate the true risk for death, and operative mortality is recommended as a standard outcome measure after colorectal surgery.7 As for acute diffuse peritonitis, 38.7% of the 8482 patients were admitted to a hospital by direct ambulance transport.10 Based on these studies, we can use a real‐time feedback system, which includes a risk calculator for the mortality (predicted postoperative 30‐day mortality and operative mortality) of preoperative patients and performance reports of each participating hospital.11 The latter shows each facility's severity‐adjusted clinical performance (benchmark) in comparison with the national data and the risk‐adjusted cumulative expected–observed death. Better or worse outcomes can be detected by the monitoring report. Furthermore, we are proceeding with papers on complications related to each of the eight operative methods for the evaluation of medical standards using data from 2011 and 2012.12, 13, 14, 15, 16, 17 To assure collection of high‐quality data, the Japanese Society of Gastroenterological Surgery (JSGS) have started data verification activities for a gastroenterological session in NCD in 2016.
Following up on the Annual Report 2011–2014,18, 19, 20 we herein report the NCD 2011–2016 based upon gastrointestinal surgery information in 3 215 977 cases of surgery carried out and recorded from 2011 to 2016 adding the data of complications. We would be satisfied if this report aided in the improvement of gastrointestinal surgery treatment in Japan.
2. SUBJECTS AND METHODS
Subjects were surgical data recorded in the NCD, which were stipulated by the “Training Curriculum for Board‐Certified Surgeons in Gastroenterology”, using the “New classification of surgical difficulty”. The board‐certification system of the Japanese Society of Gastroenterological Surgery (JSGS) consists of board‐certified training institutions and board‐certified surgeons in gastroenterological surgery.21 Requirements for board‐certified training institutions are 600 or more gastroenterological operations determined by the certified committee (more than 120 of which are essential major surgery) in the last 3 years. Board‐certified surgeons are also required to carry out 450 or more gastroenterological operations and gastroenterological surgical training for more than 5 years according to the training curriculum in a board‐certified training institution authorized by the JSGS. We targeted data from 2011 to 2016, adding data of complications to data already reported in the Annual Report 2011–2012, 2013, and 2014 on 115 gastrointestinal surgical procedures. Complications included surgical site infection (SSI), wound dehiscence, anastomotic leakage, pancreatic fistula, bile leakage, pneumonia, unplanned intubation, pulmonary embolism, ventilator‐assisted respiration longer than 48 hours, progressive renal insufficiency, acute renal failure, urinary tract infection, cerebrovascular accident with neurological deficit, coma longer than 24 hours, peripheral nerve injury, cardiac arrest requiring cardiopulmonary resuscitation, myocardial infarction, bleeding complications defined by transfusions in excess of 1 unit of blood, deep venous thrombosis, and sepsis. Postoperative complications were categorized into six grades according to the Clavien‐Dindo (C‐D) classification.22, 23 In this study, grade III (complications requiring intervention) or higher complications were defined as severe complications. Furthermore, we separated and studied the operative methods from among these 115 procedures that we deemed important in terms of medical standards as the eight main operative methods.
Here we clarified the number of surgical cases and the mortality rates related to the 115 selected gastrointestinal operative procedures. We also clarified the changes over time in the number of surgical cases and mortality rates related to the eight main operative procedures from 2011 to 2016. We also comparatively studied patient sex, age groups, institution groups, and percentage contribution of certified surgeons related to the eight main operative procedures.
The following points need to be considered in the interpretation of the data reported here. (i) As a maximum of eight operative procedures can be recorded for each case in the NCD, the total number of surgeries in “Results of the 115 gastrointestinal surgical procedures for board‐certification system” is not the actual total number of surgical cases. (ii) Cases with errors in patient age, sex, and postoperative 30‐day status were excluded. (iii) Cases in which several operative methods were carried out simultaneously were tallied for all operative methods. (iv) Postoperative 30‐day mortality included all cases of mortality within 30 days after surgery regardless of pre‐ or post‐discharge status. Calculation of operative mortality included all patients who died during the index hospitalization, including hospital stays of up to 90 days, and any patient who died after hospital discharge within 30 days of the operation date.
3. RESULTS
3.1. The 115 selected gastrointestinal operative procedures in the “Training Curriculum for Board‐Certified Surgeons in Gastroenterology”
The total number of cases represented by the 115 selected gastrointestinal surgical procedures recorded in the NCD between 1 January 2011 and 31 December 2016 was 3 215 977. Based on organ involvement, 51 883 cases involved the esophagus (1.6%); 439 540 cases the stomach and duodenum (13.7%); 1 174 168 cases the small intestine and colon (36.5%); 303 957 cases the rectum and anus (9.5%); 155 065 cases the liver (4.8%); 756 526 cases the gall bladder (23.5%); 98 365 cases the pancreas (3.1%); 23 271 cases the spleen (0.7%); and 213 202 cases other organs (6.6%) (Table 1). The increase of cases especially with malignant colorectal diseases was remarkable. The male : female ratio was approximately 6:4 overall, and there were some variations according to organs. Year by year, older patients have been increasing, especially for the stomach and duodenum, small intestine and colon, and rectum and anus (Table 1).
Table 1.
Annual changes of surgeries by sex, age group, and organ for the 115 selected gastrointestinal operative procedures in the training curriculum for board‐certified surgeons in gastroenterology
| Organ | Year | No. surgeries | Percentage by sex | Percentage according to age group (years) | ||||||
|---|---|---|---|---|---|---|---|---|---|---|
| Male | Female | <60 | 60 to <65 | 65 to <70 | 70 to <75 | 75 to <80 | ≥80 | |||
| Esophagus | 2011 | 7246 | 81.8 | 18.2 | 22.5 | 19.6 | 21.1 | 18.7 | 12.0 | 6.0 |
| 2012 | 8819 | 82.2 | 17.8 | 22.1 | 19.7 | 20.0 | 19.5 | 12.9 | 6.0 | |
| 2013 | 8642 | 81.5 | 18.5 | 20.8 | 17.5 | 21.0 | 20.6 | 13.2 | 6.9 | |
| 2014 | 9021 | 81.5 | 18.4 | 20.8 | 16.5 | 21.4 | 20.9 | 13.8 | 6.6 | |
| 2015 | 8943 | 80.8 | 19.2 | 19.6 | 15.3 | 22.4 | 22.5 | 13.1 | 7.1 | |
| 2016 | 9212 | 79.6 | 20.4 | 20.1 | 14.4 | 22.9 | 20.5 | 14.5 | 7.5 | |
| Stomach and duodenum | 2011 | 66 740 | 68.0 | 32.0 | 20.1 | 14.4 | 14.0 | 17.1 | 16.4 | 18.0 |
| 2012 | 76 186 | 68.3 | 31.7 | 18.9 | 14.4 | 14.5 | 17.1 | 16.4 | 18.6 | |
| 2013 | 75 583 | 67.9 | 32.1 | 18.6 | 13.1 | 15.5 | 17.2 | 16.9 | 18.7 | |
| 2014 | 74 920 | 67.6 | 32.4 | 17.9 | 12.1 | 16.0 | 17.8 | 16.7 | 19.5 | |
| 2015 | 73 877 | 67.8 | 32.2 | 17.4 | 11.1 | 17.1 | 17.8 | 16.6 | 19.9 | |
| 2016 | 72 234 | 67.8 | 32.2 | 17.0 | 10.2 | 18.1 | 17.1 | 16.6 | 21.0 | |
| Small intestine and colon | 2011 | 151 143 | 56.7 | 43.3 | 37.4 | 10.9 | 10.5 | 12.1 | 12.2 | 16.9 |
| 2012 | 184 810 | 56.7 | 43.3 | 36.4 | 10.7 | 10.7 | 12.2 | 12.5 | 17.4 | |
| 2013 | 198 677 | 56.9 | 43.1 | 35.6 | 10.1 | 11.3 | 12.7 | 12.4 | 17.8 | |
| 2014 | 206 857 | 56.9 | 43.1 | 34.7 | 9.4 | 12.0 | 13.1 | 12.4 | 18.4 | |
| 2015 | 214 453 | 57.1 | 42.9 | 34.0 | 8.9 | 12.9 | 13.1 | 12.3 | 18.7 | |
| 2016 | 218 228 | 57.3 | 42.7 | 33.7 | 8.4 | 13.6 | 12.5 | 12.4 | 19.3 | |
| Rectum and anus | 2011 | 41 061 | 59.1 | 40.9 | 22.0 | 16.1 | 14.6 | 15.4 | 14.2 | 17.7 |
| 2012 | 49 704 | 58.3 | 41.7 | 22.3 | 14.8 | 14.6 | 15.5 | 14.3 | 18.5 | |
| 2013 | 49 980 | 58.0 | 42.0 | 20.9 | 13.9 | 15.2 | 16.1 | 14.6 | 19.3 | |
| 2014 | 51 454 | 58.3 | 41.7 | 20.4 | 13.1 | 16.0 | 16.4 | 14.2 | 19.9 | |
| 2015 | 56 092 | 57.8 | 42.2 | 22.3 | 11.8 | 16.7 | 15.7 | 14.0 | 19.4 | |
| 2016 | 55 666 | 57.3 | 42.7 | 22.0 | 11.1 | 17.9 | 15.0 | 13.6 | 20.4 | |
| Liver | 2011 | 22 855 | 67.3 | 32.7 | 22.2 | 16.5 | 16.3 | 18.7 | 17.2 | 9.2 |
| 2012 | 26 288 | 66.3 | 33.7 | 22.1 | 15.7 | 16.7 | 18.0 | 17.4 | 10.2 | |
| 2013 | 25 814 | 66.1 | 33.9 | 21.3 | 14.6 | 17.6 | 18.7 | 17.3 | 10.5 | |
| 2014 | 26 518 | 66.3 | 33.7 | 21.5 | 13.7 | 18.1 | 19.8 | 16.6 | 10.3 | |
| 2015 | 26 378 | 65.7 | 34.3 | 20.8 | 12.8 | 18.9 | 19.4 | 16.5 | 11.5 | |
| 2016 | 27 212 | 66.4 | 33.6 | 20.3 | 11.5 | 20.5 | 18.6 | 17.0 | 12.1 | |
| Gall bladder | 2011 | 103 183 | 54.5 | 45.4 | 34.3 | 14.0 | 12.2 | 13.8 | 12.8 | 13.0 |
| 2012 | 122 513 | 55.2 | 44.8 | 32.9 | 13.8 | 12.4 | 13.9 | 13.2 | 13.8 | |
| 2013 | 129 162 | 55.3 | 44.7 | 32.6 | 12.9 | 13.0 | 14.2 | 13.2 | 14.0 | |
| 2014 | 131 182 | 55.6 | 44.4 | 32.1 | 11.8 | 13.9 | 14.5 | 13.2 | 14.5 | |
| 2015 | 133 126 | 55.6 | 44.4 | 32.0 | 11.2 | 15.0 | 14.1 | 13.0 | 14.8 | |
| 2016 | 137 360 | 55.4 | 44.6 | 32.6 | 10.6 | 15.5 | 13.1 | 12.9 | 15.3 | |
| Pancreas | 2011 | 13 477 | 59.9 | 40.1 | 20.0 | 15.6 | 16.9 | 19.7 | 17.7 | 10.2 |
| 2012 | 15 550 | 60.0 | 40.0 | 19.8 | 15.2 | 17.0 | 19.5 | 18.2 | 10.3 | |
| 2013 | 16 380 | 59.7 | 40.3 | 19.1 | 13.6 | 18.0 | 20.7 | 17.7 | 10.9 | |
| 2014 | 17 313 | 59.5 | 40.5 | 18.4 | 12.4 | 19.0 | 21.0 | 18.2 | 11.1 | |
| 2015 | 17 407 | 59.1 | 40.9 | 18.2 | 11.3 | 19.4 | 21.6 | 18.1 | 11.4 | |
| 2016 | 18 238 | 58.9 | 41.1 | 18.2 | 10.4 | 19.9 | 20.4 | 19.0 | 12.2 | |
| Spleen | 2011 | 3609 | 61.3 | 38.7 | 35.3 | 15.6 | 14.7 | 14.8 | 11.9 | 7.8 |
| 2012 | 4142 | 61.4 | 38.6 | 32.9 | 16.3 | 15.0 | 15.1 | 12.9 | 7.8 | |
| 2013 | 4509 | 61.8 | 38.2 | 30.8 | 14.9 | 15.9 | 16.5 | 13.1 | 8.7 | |
| 2014 | 4272 | 61.8 | 38.2 | 29.9 | 13.0 | 17.3 | 17.0 | 13.8 | 9.1 | |
| 2015 | 3568 | 60.4 | 39.6 | 29.7 | 11.4 | 17.3 | 16.6 | 14.1 | 10.8 | |
| 2016 | 3171 | 57.3 | 42.7 | 31.9 | 11.7 | 17.7 | 15.7 | 12.5 | 10.5 | |
| Others | 2011 | 23 218 | 55.0 | 45.0 | 32.0 | 11.9 | 11.3 | 13.3 | 13.8 | 17.6 |
| 2012 | 28 779 | 55.4 | 44.6 | 31.1 | 11.7 | 11.7 | 13.8 | 13.7 | 18.0 | |
| 2013 | 36 363 | 53.1 | 46.9 | 28.3 | 10.9 | 12.7 | 14.1 | 14.8 | 19.1 | |
| 2014 | 39 854 | 53.7 | 46.3 | 28.1 | 10.1 | 13.1 | 14.5 | 14.4 | 19.8 | |
| 2015 | 41 465 | 53.2 | 46.8 | 27.4 | 9.4 | 14.0 | 14.5 | 14.2 | 20.6 | |
| 2016 | 43 523 | 54.0 | 46.0 | 27.5 | 9.2 | 14.6 | 13.5 | 14.0 | 21.2 | |
In terms of the institution groups in which the surgeries were carried out, approximately 70% of all surgeries were done at certified institutions, and the percentage of surgeries carried out at certified institutions was particularly high for the esophagus (92.4% in 2016), liver (88.4%), pancreas (89.8%), and spleen (86.8%) (Table 2). The percentage of anesthesiologist participation was more than 90% for almost all organs, except 85.7% for the rectum and anus. Approximately more than two‐thirds of the surgeries were carried out with the participation of a board‐certified surgeon. The percentage of certified surgeons that were operators was high for the esophagus (70.0% in 2016), liver (59.6%), and pancreas (62.4%). The total number of recorded surgeries increased each year (Figure 1). Postoperative complications, 30‐day mortality rates, and operative mortality rates are shown in Table 3. Complication rates were comparatively higher for the esophagus and the pancreas; however, the mortality rates for these organ procedures were not so high. Figure 1 shows number of surgeries, mortality rates, and complications of the 115 gastrointestinal surgical procedures according to organ involvement. Tables 4, 5, 6, 7, 8, 9, 10, 11, 12 show the number of surgeries using each of the 115 gastrointestinal surgical procedures, according to recording year and organ.
Table 2.
Institution and anesthesiologist and specialist participation rates by organ for the 115 selected gastrointestinal operative procedures
| Organ | Year | No. surgeries | Percentage by institution group | Anesthesiologist participation (%) | Board‐certified surgeon participation (%) | Medical practitioners (%) | |||
|---|---|---|---|---|---|---|---|---|---|
| Certified institution | Related institution | Other | Board‐certified surgeons | Non‐board‐certified surgeons | |||||
| Esophagus | 2011 | 7246 | 93.5 | 5.9 | 0.6 | 97.0 | 87.0 | 62.8 | 37.2 |
| 2012 | 8819 | 78.1 | 5.9 | 16.0 | 97.4 | 87.0 | 62.7 | 37.3 | |
| 2013 | 8642 | 90.6 | 7.1 | 2.4 | 97.3 | 88.4 | 64.4 | 35.6 | |
| 2014 | 9021 | 91.1 | 6.1 | 2.8 | 97.9 | 90.1 | 67.6 | 32.4 | |
| 2015 | 8943 | 91.5 | 6.0 | 2.5 | 97.9 | 91.1 | 69.4 | 30.6 | |
| 2016 | 9212 | 92.4 | 5.0 | 2.6 | 98.2 | 91.2 | 70.0 | 30.0 | |
| Stomach and duodenum | 2011 | 66 740 | 80.2 | 17.3 | 2.6 | 92.8 | 69.3 | 35.1 | 64.9 |
| 2012 | 76 186 | 63.5 | 15.6 | 20.9 | 93.5 | 70.3 | 35.6 | 64.4 | |
| 2013 | 75 583 | 76.3 | 19.3 | 4.4 | 93.3 | 73.5 | 37.7 | 62.3 | |
| 2014 | 74 920 | 77.0 | 18.2 | 4.8 | 93.6 | 75.9 | 39.2 | 60.8 | |
| 2015 | 73 877 | 77.1 | 18.3 | 4.6 | 93.9 | 76.1 | 39.2 | 60.8 | |
| 2016 | 72 234 | 79.6 | 16.1 | 4.3 | 94.6 | 78.7 | 41.0 | 59.0 | |
| Small intestine and colon | 2011 | 151 143 | 76.8 | 20.2 | 2.9 | 88.1 | 59.2 | 25.1 | 74.9 |
| 2012 | 184 810 | 60.6 | 18.2 | 21.2 | 88.9 | 59.9 | 25.4 | 74.6 | |
| 2013 | 198 677 | 72.6 | 22.2 | 5.2 | 89.6 | 62.7 | 26.6 | 73.4 | |
| 2014 | 206 857 | 73.0 | 21.4 | 5.6 | 90.8 | 65.4 | 28.1 | 71.9 | |
| 2015 | 214 453 | 73.8 | 20.7 | 5.5 | 91.6 | 66.3 | 28.5 | 71.5 | |
| 2016 | 218 228 | 75.6 | 19.0 | 5.5 | 92.4 | 68.1 | 29.5 | 70.5 | |
| Rectum and anus | 2011 | 41 061 | 76.9 | 19.0 | 4.1 | 86.3 | 68.3 | 36.9 | 63.1 |
| 2012 | 49 704 | 60.4 | 18.2 | 21.4 | 85.7 | 68.6 | 37.6 | 62.4 | |
| 2013 | 49 980 | 72.9 | 21.7 | 5.4 | 87.3 | 71.2 | 39.4 | 60.6 | |
| 2014 | 51 454 | 73.5 | 20.9 | 5.6 | 87.9 | 73.7 | 41.6 | 58.4 | |
| 2015 | 56 092 | 72.5 | 20.8 | 6.7 | 84.9 | 73.5 | 41.5 | 58.5 | |
| 2016 | 55 666 | 74.1 | 19.4 | 6.6 | 85.7 | 74.7 | 42.1 | 57.9 | |
| Liver | 2011 | 22 855 | 89.3 | 9.7 | 1.1 | 95.6 | 85.2 | 55.2 | 44.8 |
| 2012 | 26 288 | 74.2 | 9.2 | 16.7 | 95.4 | 85.7 | 57.4 | 42.6 | |
| 2013 | 25 814 | 86.3 | 10.7 | 2.9 | 96.3 | 87.5 | 57.1 | 42.9 | |
| 2014 | 26 518 | 86.3 | 10.0 | 3.7 | 96.4 | 89.0 | 59.6 | 40.4 | |
| 2015 | 26 378 | 87.3 | 9.5 | 3.2 | 96.6 | 89.1 | 59.1 | 40.9 | |
| 2016 | 27 212 | 88.4 | 8.8 | 2.9 | 96.8 | 90.0 | 59.6 | 40.4 | |
| Gall bladder | 2011 | 103 183 | 73.9 | 22.5 | 3.6 | 91.8 | 61.9 | 26.4 | 73.6 |
| 2012 | 122 513 | 57.5 | 19.6 | 22.9 | 92.1 | 62.8 | 26.3 | 73.7 | |
| 2013 | 129 162 | 69.9 | 24.1 | 5.9 | 92.2 | 65.4 | 27.3 | 72.7 | |
| 2014 | 131 182 | 70.3 | 23.3 | 6.4 | 92.3 | 67.4 | 28.1 | 71.9 | |
| 2015 | 133 126 | 70.8 | 22.8 | 6.4 | 92.9 | 68.4 | 28.1 | 71.9 | |
| 2016 | 137 360 | 72.4 | 21.3 | 6.3 | 93.5 | 69.4 | 28.9 | 71.1 | |
| Pancreas | 2011 | 13 477 | 88.1 | 10.8 | 1.2 | 95.8 | 85.2 | 57.7 | 42.3 |
| 2012 | 15 550 | 72.8 | 8.7 | 18.5 | 96.3 | 86.5 | 59.9 | 40.1 | |
| 2013 | 16 380 | 86.5 | 11.0 | 2.4 | 95.9 | 87.6 | 60.2 | 39.8 | |
| 2014 | 17 313 | 86.9 | 9.9 | 3.3 | 96.2 | 89.1 | 61.3 | 38.7 | |
| 2015 | 17 407 | 88.4 | 9.1 | 2.4 | 96.4 | 90.3 | 61.6 | 38.4 | |
| 2016 | 18 238 | 89.8 | 8.0 | 2.3 | 96.8 | 91.1 | 62.4 | 37.6 | |
| Spleen | 2011 | 3609 | 87.0 | 11.6 | 1.4 | 94.6 | 75.2 | 44.9 | 55.1 |
| 2012 | 4142 | 70.5 | 9.5 | 20.0 | 81.7 | 75.8 | 44.4 | 55.6 | |
| 2013 | 4509 | 83.2 | 13.8 | 3.0 | 95.2 | 75.4 | 43.3 | 56.7 | |
| 2014 | 4272 | 85.4 | 11.5 | 3.1 | 94.6 | 77.5 | 45.2 | 54.8 | |
| 2015 | 3568 | 85.6 | 12.3 | 2.1 | 94.8 | 78.9 | 45.5 | 54.5 | |
| 2016 | 3171 | 86.8 | 10.1 | 3.1 | 95.7 | 80.5 | 48.0 | 52.0 | |
| Others | 2011 | 23 218 | 80.2 | 17.0 | 2.8 | 90.3 | 60.4 | 27.2 | 72.8 |
| 2012 | 28 779 | 65.7 | 15.2 | 19.1 | 91.0 | 61.1 | 27.6 | 72.4 | |
| 2013 | 36 363 | 76.1 | 19.3 | 4.6 | 91.5 | 63.4 | 28.5 | 71.5 | |
| 2014 | 39 854 | 76.6 | 18.2 | 5.1 | 91.9 | 64.9 | 29.7 | 70.3 | |
| 2015 | 41 465 | 78.0 | 17.2 | 4.8 | 92.4 | 65.6 | 29.4 | 70.6 | |
| 2016 | 43 523 | 79.4 | 15.8 | 4.8 | 92.7 | 67.3 | 30.3 | 69.7 | |
Figure 1.
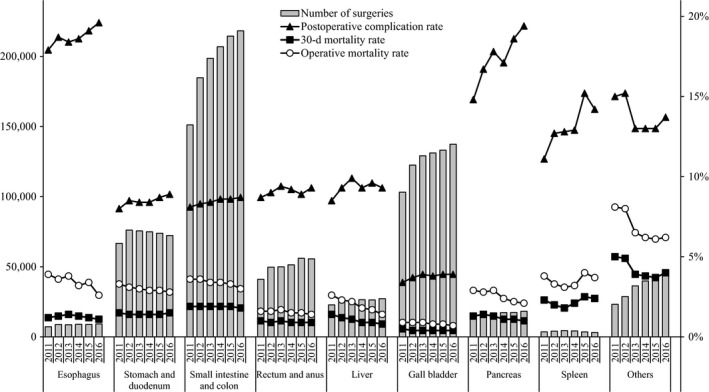
Annual changes of number of surgeries, 30‐day mortality, operative mortality, and complications: Analysis of 115 surgical procedures. Postoperative complication rate: the rate of Clavien‐Dindo (C‐D) classification grade III (complications requiring intervention) or higher complications.
Table 3.
No. surgeries and mortality rates according to organ treated using the 115 selected gastrointestinal operative procedures
| Organ | Year | No. surgeries | No. postoperative complicationsa/rate (%) | No. 30‐day mortalities/rate (%) | No. operative mortalities/rate (%) |
|---|---|---|---|---|---|
| Esophagus | 2011 | 7246 | 1294/17.9 | 87/1.2 | 279/3.9 |
| 2012 | 8819 | 1653/18.7 | 117/1.3 | 315/3.6 | |
| 2013 | 8642 | 1593/18.4 | 121/1.4 | 327/3.8 | |
| 2014 | 9021 | 1679/18.6 | 115/1.3 | 289/3.2 | |
| 2015 | 8943 | 1709/19.1 | 103/1.2 | 304/3.4 | |
| 2016 | 9212 | 1805/19.6 | 100/1.1 | 238/2.6 | |
| Stomach and duodenum | 2011 | 66 740 | 5354/8.0 | 992/1.5 | 2183/3.3 |
| 2012 | 76 186 | 6447/8.5 | 1085/1.4 | 2381/3.1 | |
| 2013 | 75 583 | 6380/8.4 | 1059/1.4 | 2269/3.0 | |
| 2014 | 74 920 | 6328/8.4 | 1064/1.4 | 2174/2.9 | |
| 2015 | 73 877 | 6418/8.7 | 1007/1.4 | 2110/2.9 | |
| 2016 | 72 234 | 6413/8.9 | 1066/1.5 | 2016/2.8 | |
| Small intestine and colon | 2011 | 151 143 | 12 184/8.1 | 2943/1.9 | 5390/3.6 |
| 2012 | 184 810 | 15 395/8.3 | 3564/1.9 | 6583/3.6 | |
| 2013 | 198 677 | 16 709/8.4 | 3723/1.9 | 6803/3.4 | |
| 2014 | 206 857 | 17 776/8.6 | 3822/1.9 | 6961/3.4 | |
| 2015 | 214 453 | 18 372/8.6 | 4019/1.9 | 7092/3.3 | |
| 2016 | 218 228 | 19 020/8.7 | 3933/1.8 | 6621/3.0 | |
| Rectum and anus | 2011 | 41 061 | 3584/8.7 | 395/1.0 | 676/1.6 |
| 2012 | 49 704 | 4488/9.0 | 462/0.9 | 802/1.6 | |
| 2013 | 49 980 | 4684/9.4 | 517/1.0 | 858/1.7 | |
| 2014 | 51 454 | 4711/9.2 | 449/0.9 | 792/1.5 | |
| 2015 | 56 092 | 4986/8.9 | 519/0.9 | 824/1.5 | |
| 2016 | 55 666 | 5194/9.3 | 503/0.9 | 766/1.4 | |
| Liver | 2011 | 22 855 | 1933/8.5 | 309/1.4 | 590/2.6 |
| 2012 | 26 288 | 2454/9.3 | 310/1.2 | 605/2.3 | |
| 2013 | 25 814 | 2549/9.9 | 275/1.1 | 575/2.2 | |
| 2014 | 26 518 | 2466/9.3 | 246/0.9 | 481/1.8 | |
| 2015 | 26 378 | 2537/9.6 | 234/0.9 | 451/1.7 | |
| 2016 | 27 212 | 2543/9.3 | 222/0.8 | 382/1.4 | |
| Gall bladder | 2011 | 103 183 | 3473/3.4 | 483/0.5 | 946/0.9 |
| 2012 | 122 513 | 4587/3.7 | 531/0.4 | 1082/0.9 | |
| 2013 | 129 162 | 4982/3.9 | 546/0.4 | 1130/0.9 | |
| 2014 | 131 182 | 5020/3.8 | 569/0.4 | 1097/0.8 | |
| 2015 | 133 126 | 5231/3.9 | 541/0.4 | 1036/0.8 | |
| 2016 | 137 360 | 5320/3.9 | 559/0.4 | 980/0.7 | |
| Pancreas | 2011 | 13 477 | 1994/14.8 | 175/1.3 | 386/2.9 |
| 2012 | 15 550 | 2595/16.7 | 213/1.4 | 437/2.8 | |
| 2013 | 16 380 | 2917/17.8 | 211/1.3 | 482/2.9 | |
| 2014 | 17 313 | 2966/17.1 | 195/1.1 | 423/2.4 | |
| 2015 | 17 407 | 3229/18.6 | 185/1.1 | 379/2.2 | |
| 2016 | 18 238 | 3543/19.4 | 185/1.0 | 390/2.1 | |
| Spleen | 2011 | 3609 | 400/11.1 | 83/2.3 | 137/3.8 |
| 2012 | 4142 | 528/12.7 | 84/2.0 | 138/3.3 | |
| 2013 | 4509 | 575/12.8 | 79/1.8 | 139/3.1 | |
| 2014 | 4272 | 549/12.9 | 88/2.1 | 137/3.2 | |
| 2015 | 3568 | 543/15.2 | 88/2.5 | 144/4.0 | |
| 2016 | 3171 | 449/14.2 | 76/2.4 | 117/3.7 | |
| Others | 2011 | 23 218 | 3494/15.0 | 1163/5.0 | 1887/8.1 |
| 2012 | 28 779 | 4388/15.2 | 1399/4.9 | 2293/8.0 | |
| 2013 | 36 363 | 4712/13.0 | 1401/3.9 | 2346/6.5 | |
| 2014 | 39 854 | 5176/13.0 | 1521/3.8 | 2489/6.2 | |
| 2015 | 41 465 | 5380/13.0 | 1541/3.7 | 2545/6.1 | |
| 2016 | 43 523 | 5975/13.7 | 1760/4.0 | 2684/6.2 |
Complications were defined by Clavien‐Dindo grade IIIa‐V.
Table 4.
Annual changes in the number of surgeries according to the 115 selected gastrointestinal operative procedures (esophagus)
| Organ | Degree of difficulty | Procedure | No. surgeries | |||||
|---|---|---|---|---|---|---|---|---|
| 2011 | 2012 | 2013 | 2014 | 2015 | 2016 | |||
| Esophagus | Low | Cervical periesophageal abscess drainage | 23 | 27 | 34 | 42 | 37 | 43 |
| Med | Esophageal suture (perforation, injury) | 156 | 204 | 198 | 185 | 199 | 215 | |
| Med | Thoracic periesophageal abscess drainage | 22 | 23 | 18 | 27 | 27 | 21 | |
| Med | Esophageal foreign body extraction | 19 | 21 | 26 | 25 | 30 | 32 | |
| Med | Esophageal diverticulum resection | 27 | 32 | 35 | 48 | 41 | 34 | |
| Med | Benign esophageal tumor removal | 61 | 69 | 66 | 68 | 52 | 64 | |
| Med | Esophageal resection (removal only) | 388 | 506 | 580 | 570 | 571 | 721 | |
| Med | Esophageal reconstruction: reconstruction only (gastric tube reconstruction) | 699 | 844 | 888 | 799 | 848 | 772 | |
| Med | Esophageal fistula construction | 97 | 106 | 128 | 126 | 125 | 162 | |
| Med | Esophagocardioplasty | 321 | 418 | 392 | 398 | 362 | 365 | |
| Med | Achalasia surgery | 77 | 109 | 84 | 118 | 101 | 210 | |
| High | Esophagectomy | 4916 | 5946 | 5694 | 6091 | 6060 | 6041 | |
| High | Esophageal reconstruction: reconstruction only (colon reconstruction) | 65 | 56 | 63 | 77 | 51 | 40 | |
| High | Esophageal bypass | 93 | 110 | 137 | 143 | 152 | 130 | |
| High | Bronchoesophageal fistula surgery | 6 | 5 | 9 | 12 | 7 | 13 | |
| High | Secondary esophageal reconstruction | 276 | 343 | 290 | 292 | 280 | 349 | |
Table 5.
Annual changes in the number of surgeries according to the 115 selected gastrointestinal operative procedures (stomach and duodenum)
| Organ | Degree of difficulty | Procedure | No. surgeries | |||||
|---|---|---|---|---|---|---|---|---|
| 2011 | 2012 | 2013 | 2014 | 2015 | 2016 | |||
| Stomach and duodenum | Low | Gastrostomy and suture gastrorrhaphy | 52 | 69 | 74 | 66 | 65 | 77 |
| Low | Diverticulum, polypectomy (excluding endoscopic resection) | 156 | 186 | 231 | 247 | 226 | 202 | |
| Low | Truncal vagotomy | 3 | 6 | 6 | 2 | 6 | 3 | |
| Low | Gastroenterostomy (including duodenal jejunostomy) | 4651 | 5330 | 5571 | 5893 | 5636 | 5633 | |
| Low | Gastric fistula construction (excluding PEG) | 1717 | 1698 | 1633 | 1722 | 1790 | 1748 | |
| Low | Gastric pyloroplasty | 116 | 129 | 115 | 126 | 100 | 69 | |
| Low | Gastric volvulus (volvulus) surgery and rectopexy | 40 | 38 | 39 | 0 | 47 | 42 | |
| Low | Gastric suture (including gastric suture for gastric rupture, suture closure for gastroduodenal perforation, omental implantation and omental transposition) | 4707 | 5738 | 5669 | 5837 | 5858 | 6164 | |
| Low | Local gastrectomy (including wedge resection) | 2466 | 3108 | 3233 | 3354 | 3625 | 3766 | |
| Med | Gastrectomy (including distal gastrectomy, pylorus preserving gastrectomy and segmental [transverse] gastrectomy) | 34 160 | 38 750 | 39 957 | 38 584 | 37 819 | 36 852 | |
| Med | Selective vagotomy | 8 | 8 | 10 | 7 | 6 | 4 | |
| High | Total gastrectomy (including fundusectomy) | 18 652 | 21 122 | 19 035 | 19 071 | 18 695 | 17 670 | |
| High | Left upper abdominal exenteration | 12 | 4 | 10 | 11 | 4 | 4 | |
Table 6.
Annual changes in the number of surgeries according to the 115 selected gastrointestinal operative procedures (small intestine and colon)
| Organ | Degree of difficulty | Procedure | No. surgeries | |||||
|---|---|---|---|---|---|---|---|---|
| 2011 | 2012 | 2013 | 2014 | 2015 | 2016 | |||
| Small intestine and colon | Low | Enterotomy and enterorrhaphy | 2982 | 3505 | 4025 | 4362 | 4412 | 4311 |
| Low | Disinvagination (invasive) | 172 | 250 | 234 | 239 | 209 | 242 | |
| Low | Partial enterectomy (benign) | 5792 | 7602 | 8564 | 8938 | 9449 | 9591 | |
| Low | Ileocecal resection (benign) | 3238 | 4104 | 4313 | 4472 | 4523 | 4675 | |
| Low | Partial colectomy and sigmoid colectomy (benign) | 4946 | 6239 | 6626 | 7358 | 7583 | 7971 | |
| Low | Appendectomy | 43 437 | 51 316 | 54 421 | 54 319 | 54 897 | 55 168 | |
| Low | Enterostomy and closure (without enterectomy) | 15 192 | 19 371 | 21 600 | 23 425 | 24 666 | 25 458 | |
| Med | Enterectomy (malignant) | 2448 | 2703 | 3016 | 3082 | 3320 | 3360 | |
| Med | Ileocecal resection (malignant) | 5492 | 9274 | 10 327 | 11 368 | 12 224 | 12 872 | |
| Med | Partial colectomy and sigmoid colectomy (malignant) | 25 034 | 29 863 | 31 495 | 32 092 | 33 518 | 33 936 | |
| Med | Right hemicolectomy | 17 890 | 21 034 | 21 814 | 22 446 | 22 850 | 22 829 | |
| Med | Left hemicolectomy | 5241 | 5347 | 5644 | 5763 | 6119 | 6178 | |
| Med | Total colectomy | 2846 | 3131 | 1892 | 1701 | 1752 | 1735 | |
| Med | Intestinal obstruction surgery (with bowel resection) | 5117 | 6496 | 7412 | 7775 | 7912 | 7898 | |
| Med | Enterostomy and closure (with enterectomy) | 11 008 | 14 162 | 16 853 | 19 049 | 20 520 | 21 525 | |
| High | Proctocolectomy and ileoanal (canal) anastomosis | 308 | 413 | 441 | 468 | 499 | 479 | |
Table 7.
Annual changes in the number of surgeries according to the 115 selected gastrointestinal operative procedures (rectum and anus)
| Organ | Degree of difficulty | Procedure | No. surgeries | |||||
|---|---|---|---|---|---|---|---|---|
| 2011 | 2012 | 2013 | 2014 | 2015 | 2016 | |||
| Rectum and anus | Low | Transanal rectal tumor removal | 2483 | 3300 | 1657 | 1513 | 3690 | 3651 |
| Low | Proctocele surgery (transanal) | 1802 | 2461 | 2488 | 2602 | 2773 | 2805 | |
| Med | Rectectomy (benign) | 300 | 386 | 2196 | 2060 | 1914 | 1688 | |
| Med | High anterior resection | 7053 | 8920 | 8985 | 9496 | 9934 | 10 477 | |
| Med | Hartmann's procedure | 3562 | 4614 | 4865 | 5194 | 5650 | 5755 | |
| Med | Proctocele surgery (abdominoperineal) | 659 | 996 | 1119 | 1181 | 1411 | 1538 | |
| Med | Malignant anorectal tumor excision (transanal) | 1517 | 1037 | 898 | 864 | 821 | 778 | |
| Med | Anal sphincteroplasty (by tissue replacement) | 969 | 1378 | 1721 | 1718 | 2132 | 2045 | |
| High | Rectectomy (malignant) | 5308 | 5828 | 4474 | 4531 | 4825 | 5096 | |
| High | Low anterior resection | 16 984 | 20 321 | 21 096 | 21 861 | 22 493 | 21 387 | |
| High | Pelvic evisceration | 359 | 389 | 412 | 374 | 385 | 402 | |
| High | Anorectal malignant tumor excision (posterior approach) | 65 | 74 | 69 | 60 | 64 | 44 | |
Table 8.
Annual changes in the number of surgeries according to the 115 selected gastrointestinal operative procedures (liver)
| Organ | Degree of difficulty | Procedure | No. surgeries | |||||
|---|---|---|---|---|---|---|---|---|
| 2011 | 2012 | 2013 | 2014 | 2015 | 2016 | |||
| Liver | Low | Hepatorrhaphy | 172 | 202 | 161 | 196 | 147 | 161 |
| Low | Liver abscess drainage (excluding percutaneous procedures) | 42 | 47 | 54 | 44 | 59 | 55 | |
| Low | Hepatic cyst resection. Suture. Drainage | 425 | 535 | 606 | 695 | 695 | 741 | |
| Low | Partial hepatectomy | 9431 | 10 919 | 10 708 | 11 598 | 12 063 | 12 604 | |
| Low | Liver biopsy (excluding percutaneous procedures) | 122 | 264 | 176 | 165 | 175 | 126 | |
| Low | Liver coagulonecrotic therapy (excluding percutaneous procedures) | 1958 | 2122 | 1083 | 1069 | 939 | 854 | |
| Med | Lateral segmentectomy of the liver | 1390 | 1632 | 1773 | 1807 | 1666 | 1704 | |
| Med | Esophageal and gastric varix surgery | 94 | 109 | 67 | 61 | 46 | 67 | |
| High | Hepatectomy (segmented or more; excluding lateral segments) | 7434 | 8239 | 7937 | 7666 | 7439 | 7610 | |
| High | Systematic subsegmentectomy | 996 | 1353 | 2374 | 2257 | 2221 | 2367 | |
| High | Liver transplant | 692 | 775 | 757 | 848 | 790 | 800 | |
| High | Hepatopancreatoduodenectomy | 99 | 91 | 118 | 112 | 138 | 123 | |
Table 9.
Annual changes in the number of surgeries according to the 115 selected gastrointestinal operative procedures (gall bladder)
| Organ | Degree of difficulty | Procedure | No. surgeries | |||||
|---|---|---|---|---|---|---|---|---|
| 2011 | 2012 | 2013 | 2014 | 2015 | 2016 | |||
| Gall bladder | Low | Cholangiotomy | 142 | 163 | 174 | 139 | 141 | 132 |
| Low | Cysticolithectomy | 1094 | 1093 | 750 | 641 | 611 | 571 | |
| Low | Cholecystectomy | 93 665 | 112 048 | 119 455 | 122 026 | 124 267 | 128 809 | |
| Low | External cholecystostomy | 104 | 119 | 127 | 124 | 109 | 146 | |
| Low | Cystoenteric anastomosis | 70 | 73 | 61 | 61 | 67 | 59 | |
| Med | Cysticolithectomy | 3682 | 4117 | 3880 | 3574 | 3342 | 3057 | |
| Med | Biliary tract reconstruction | 150 | 162 | 265 | 315 | 362 | 347 | |
| Med | Biliary bypass | 1594 | 1751 | 1765 | 1686 | 1613 | 1490 | |
| Med | Cholangioplasty | 201 | 180 | 192 | 168 | 156 | 176 | |
| Med | Duodenal papilloplasty | 66 | 68 | 50 | 33 | 31 | 37 | |
| Med | Choledochal dilatation | 217 | 240 | 254 | 242 | 248 | 291 | |
| Med | Biliary fistula closure | 43 | 42 | 42 | 37 | 40 | 34 | |
| High | Malignant gallbladder tumor surgery (excluding simple cholecystectomy) | 869 | 1013 | 929 | 963 | 969 | 948 | |
| High | Malignant bile duct tumor surgery | 1268 | 1426 | 1202 | 1153 | 1155 | 1245 | |
| High | Biliary atresia surgery | 18 | 18 | 16 | 20 | 15 | 18 | |
Table 10.
Annual changes in the number of surgeries according to the 115 selected gastrointestinal operative procedures (pancreas)
| Organ | Degree of difficulty | Procedure | No. surgeries | |||||
|---|---|---|---|---|---|---|---|---|
| 2011 | 2012 | 2013 | 2014 | 2015 | 2016 | |||
| Pancreas | Low | External pancreatic cyst drainage | 29 | 27 | 13 | 21 | 8 | 13 |
| Low | External pancreatic duct drainage | 17 | 20 | 26 | 28 | 22 | 34 | |
| Med | Pancreatorrhaphy | 22 | 17 | 21 | 34 | 27 | 17 | |
| Med | Partial pancreatic resection | 126 | 148 | 202 | 182 | 165 | 177 | |
| Med | Distal pancreatectomy (benign) | 1018 | 1398 | 1372 | 1557 | 1477 | 1536 | |
| Med | Pancreatoenteric anastomosis | 81 | 71 | 59 | 49 | 44 | 39 | |
| Med | Pancreatic (duct) anastomosis | 223 | 295 | 309 | 388 | 280 | 269 | |
| Med | Acute pancreatitis surgery | 94 | 117 | 104 | 103 | 90 | 132 | |
| Med | Pancreatolithiasis surgery | 17 | 17 | 14 | 35 | 31 | 29 | |
| Med | Plexus pancreaticus capitalis resection | 1 | 1 | 2 | 0 | 1 | 1 | |
| High | Pancreaticoduodenectomy | 8305 | 9329 | 10 068 | 10 400 | 10 576 | 11 028 | |
| High | Distal pancreatectomy (malignant) | 2861 | 3344 | 3483 | 3750 | 3930 | 4173 | |
| High | Total pancreatectomy | 348 | 408 | 423 | 496 | 503 | 545 | |
| High | Duodenum preserving pancreas head resection | 201 | 193 | 111 | 85 | 63 | 49 | |
| High | Segmental pancreatic resection | 131 | 163 | 138 | 165 | 162 | 169 | |
| High | Distal pancreatectomy | 3 | 2 | 35 | 20 | 28 | 27 | |
Table 11.
Annual changes in the number of surgeries according to the 115 selected gastrointestinal operative procedures (spleen)
| Organ | Degree of difficulty | Procedure | No. surgeries | |||||
|---|---|---|---|---|---|---|---|---|
| 2011 | 2012 | 2013 | 2014 | 2015 | 2016 | |||
| Spleen | Low | Splenorrhaphy | 22 | 35 | 26 | 24 | 17 | 30 |
| Med | Splenectomy | 3564 | 4063 | 4457 | 4215 | 3525 | 3117 | |
| Med | Partial splenic resection | 23 | 44 | 26 | 33 | 26 | 24 | |
Table 12.
Annual changes in the number of surgeries according to the 115 selected gastrointestinal operative procedures (other)
| Organ | Degree of difficulty | Procedure | Number of surgeries | |||||
|---|---|---|---|---|---|---|---|---|
| 2011 | 2012 | 2013 | 2014 | 2015 | 2016 | |||
| Other | Low | Localized intra‐abdominal abscess surgery | 2526 | 2944 | 3231 | 3262 | 2942 | 2764 |
| Low | Exploratory laparotomy | 5036 | 6852 | 7532 | 8271 | 8982 | 9629 | |
| Med | Acute diffuse peritonitis surgery | 7753 | 9177 | 10 447 | 12 085 | 13 030 | 13 981 | |
| Med | Ventral hernia surgery | 5053 | 6095 | 11 387 | 12 298 | 12 494 | 12 896 | |
| Med | Diaphragm suture | 183 | 218 | 246 | 213 | 257 | 253 | |
| Med | Esophageal hiatus hernia surgery | 511 | 602 | 725 | 757 | 800 | 842 | |
| Med | Retroperitoneal tumor surgery | 622 | 837 | 806 | 805 | 807 | 850 | |
| Med | Abdominal wall/mesenteric/omental tumor resection | 979 | 1398 | 1402 | 1509 | 1506 | 1707 | |
| Med | Gastrointestinal perforation closure | 504 | 576 | 522 | 589 | 587 | 549 | |
| High | Diaphragmatic hiatus hernia surgery | 51 | 80 | 65 | 65 | 60 | 52 | |
3.2. Eight main operative procedures
The respective number of surgeries carried out annually for the eight main operative procedures, mortalities and complications between 2011 and 2016 are shown in Table 13 and Figure 2. Subsequently, the male : female ratio leaned toward males for all operative methods, with males particularly predominant with esophagectomy, gastrectomy (distal and total), and hepatectomy. In addition, the percentage of those patients who were ≥80 years was high for gastrectomy (distal and total), right hemicolectomy, and acute diffuse peritonitis surgery (Table 13). Regarding the institution groups in which surgeries were carried out, more than 70% of the surgeries were done at certified institutions and was particularly high for esophagectomy (94.5% in 2016), hepatectomy (non‐lateral segments) (90.7%), and pancreaticoduodenectomy (89.4%). Percentage of anesthesiologist participation was more than 90% for all eight procedures. Approximately 90% of esophagectomy, hepatectomy (non‐lateral segments), and pancreaticoduodenectomy procedures involved board‐certified surgeon participation, while the percentages of the same for right hemicolectomy and acute diffuse peritonitis surgery were 74.2% and 66.8% in 2016, respectively (Table 14). Table 15 shows the mortality rates of the eight main operative procedures. Other than acute diffuse peritonitis surgery, the postoperative 30‐day mortality rate was 0.3%‐2.1% and the operative mortality rate was 0.6%‐4.1%. The postoperative 30‐day mortality rate and operative mortality rate for acute diffuse peritonitis surgery was 7.5% and 11.2% in 2016, respectively (Table 15; Figure 2). Number of cases of acute diffuse peritonitis surgery is increasing; however, the morbidity and mortality rates are decreasing. There were differences in the incidence of complications according to organ site and procedure. Remarkably, mortality rates of low anterior resection were very low (0.3% and 0.6% for 30‐day mortality and operative mortality in 2016, respectively), and those of hepatectomy (1.3% and 2.3% in 2016) and acute diffuse peritonitis surgery (7.5% and 11.2% in 2016) have been gradually decreasing. Although the complication rates were gradually increasing for esophagectomy (20.5% in 2016) and pancreaticoduodenectomy (20.3% in 2016), the mortality rates for these procedures (0.8% and 1.8%, and 0.9% and 2.1% for 30‐day mortality and operative mortality in 2016, respectively) were decreasing.
Table 13.
Annual changes of surgeries by sex, age group, and organ for the eight main operative procedures
| Organ | Year | No. surgeries | Percentage by sex | Percentage according to age group (years) | ||||||
|---|---|---|---|---|---|---|---|---|---|---|
| Male | Female | <60 | 60 to <65 | 65 to <70 | 70 to <75 | 75 to <80 | ≥80 | |||
| Esophagectomy | 2011 | 4916 | 84.1 | 15.9 | 20.4 | 20.8 | 22.5 | 19.4 | 12.2 | 4.7 |
| 2012 | 5946 | 84.4 | 15.6 | 19.7 | 21.3 | 20.7 | 20.3 | 13.1 | 4.9 | |
| 2013 | 5694 | 83.6 | 16.4 | 18.3 | 18.3 | 22.6 | 21.3 | 13.8 | 5.8 | |
| 2014 | 6091 | 84.0 | 16.0 | 18.7 | 17.8 | 22.8 | 22.0 | 13.4 | 5.2 | |
| 2015 | 6060 | 82.9 | 17.1 | 17.9 | 16.3 | 23.6 | 23.5 | 13.1 | 5.7 | |
| 2016 | 6041 | 81.7 | 18.3 | 17.8 | 15.8 | 25.3 | 21.6 | 14.3 | 5.2 | |
| Gastrectomy (distal) | 2011 | 34 160 | 66.6 | 33.4 | 18.1 | 15.0 | 14.2 | 17.4 | 16.8 | 18.5 |
| 2012 | 38 750 | 66.9 | 33.1 | 16.9 | 14.8 | 15.0 | 17.8 | 16.5 | 18.8 | |
| 2013 | 39 957 | 66.7 | 33.3 | 16.3 | 13.5 | 15.8 | 17.8 | 17.6 | 19.0 | |
| 2014 | 38 584 | 66.4 | 33.6 | 15.7 | 12.4 | 16.6 | 18.4 | 17.3 | 19.5 | |
| 2015 | 37 819 | 66.6 | 33.4 | 14.8 | 11.3 | 17.5 | 18.2 | 17.5 | 20.6 | |
| 2016 | 36 852 | 66.6 | 33.4 | 14.5 | 10.4 | 18.5 | 17.6 | 17.4 | 21.6 | |
| Total gastrectomy | 2011 | 18 652 | 73.7 | 26.3 | 16.6 | 14.7 | 16.0 | 19.7 | 18.0 | 15.0 |
| 2012 | 21 122 | 74.2 | 25.8 | 15.5 | 14.8 | 15.7 | 19.2 | 18.5 | 16.3 | |
| 2013 | 19 035 | 74.0 | 26.0 | 14.7 | 13.5 | 16.9 | 19.4 | 19.2 | 16.3 | |
| 2014 | 19 071 | 73.7 | 26.3 | 14.0 | 12.3 | 17.2 | 20.1 | 18.9 | 17.5 | |
| 2015 | 18 695 | 74.5 | 25.5 | 13.7 | 11.1 | 18.9 | 20.8 | 18.2 | 17.4 | |
| 2016 | 17 670 | 74.4 | 25.6 | 12.6 | 10.3 | 19.6 | 19.5 | 19.0 | 19.0 | |
| Right hemicolectomy | 2011 | 17 890 | 50.5 | 49.5 | 12.8 | 11.6 | 13.1 | 17.3 | 18.8 | 26.5 |
| 2012 | 21 034 | 50.3 | 49.7 | 13.1 | 10.9 | 13.1 | 17.0 | 19.0 | 26.9 | |
| 2013 | 21 814 | 50.6 | 49.4 | 13.0 | 10.0 | 13.4 | 17.6 | 18.9 | 27.1 | |
| 2014 | 22 446 | 50.6 | 49.4 | 12.0 | 9.2 | 13.8 | 18.2 | 18.6 | 28.2 | |
| 2015 | 22 850 | 50.5 | 49.5 | 11.5 | 8.6 | 14.6 | 18.1 | 18.1 | 29.1 | |
| 2016 | 22 829 | 51.3 | 48.7 | 11.4 | 7.7 | 15.9 | 16.7 | 18.5 | 29.8 | |
| Low anterior resection | 2011 | 16 984 | 64.8 | 35.2 | 24.1 | 18.5 | 16.5 | 16.2 | 12.9 | 11.7 |
| 2012 | 20 321 | 64.8 | 35.2 | 24.2 | 17.6 | 16.5 | 16.6 | 13.1 | 12.0 | |
| 2013 | 21 096 | 64.2 | 35.8 | 23.8 | 16.5 | 17.4 | 16.9 | 13.5 | 11.8 | |
| 2014 | 21 861 | 64.8 | 35.2 | 23.1 | 15.7 | 18.3 | 17.9 | 13.1 | 11.9 | |
| 2015 | 22 493 | 64.4 | 35.6 | 23.5 | 14.2 | 19.6 | 17.1 | 13.6 | 12.0 | |
| 2016 | 21 387 | 64.4 | 35.6 | 23.4 | 13.6 | 20.7 | 16.8 | 13.2 | 12.2 | |
| Hepatectomy (non‐lateral segments) | 2011 | 7434 | 70.4 | 29.6 | 20.1 | 16.4 | 16.5 | 20.4 | 18.0 | 8.7 |
| 2012 | 8239 | 69.5 | 30.5 | 19.8 | 16.1 | 17.4 | 19.5 | 18.5 | 8.8 | |
| 2013 | 7937 | 69.4 | 30.6 | 19.4 | 14.2 | 18.0 | 20.3 | 18.2 | 9.9 | |
| 2014 | 7666 | 69.2 | 30.8 | 18.5 | 13.8 | 18.5 | 21.5 | 17.6 | 10.0 | |
| 2015 | 7439 | 68.9 | 31.1 | 18.7 | 12.5 | 19.3 | 20.9 | 17.6 | 11.1 | |
| 2016 | 7610 | 68.7 | 31.3 | 18.0 | 11.9 | 21.1 | 20.4 | 17.5 | 11.1 | |
| Pancreaticoduodenectomy | 2011 | 8305 | 61.9 | 38.1 | 16.1 | 16.0 | 17.3 | 20.9 | 18.8 | 10.9 |
| 2012 | 9329 | 62.0 | 38.0 | 14.7 | 15.8 | 18.0 | 20.6 | 20.2 | 10.6 | |
| 2013 | 10 068 | 60.9 | 39.1 | 14.0 | 12.6 | 19.6 | 22.5 | 19.4 | 11.8 | |
| 2014 | 10 400 | 59.5 | 40.5 | 18.4 | 12.4 | 19.0 | 21.0 | 18.2 | 11.1 | |
| 2015 | 10 576 | 60.7 | 39.3 | 14.2 | 11.7 | 20.0 | 22.9 | 19.3 | 12.0 | |
| 2016 | 11 028 | 61.1 | 38.9 | 14.2 | 10.3 | 20.6 | 21.8 | 20.3 | 12.7 | |
| Acute diffuse peritonitis surgery | 2011 | 7753 | 60.0 | 40.0 | 31.4 | 11.2 | 9.7 | 11.7 | 13.2 | 22.9 |
| 2012 | 9177 | 61.0 | 39.0 | 30.3 | 11.2 | 10.1 | 11.6 | 13.4 | 23.4 | |
| 2013 | 10 447 | 60.1 | 39.9 | 29.1 | 10.3 | 11.5 | 11.8 | 13.1 | 24.1 | |
| 2014 | 12 085 | 61.2 | 38.8 | 28.4 | 9.5 | 12.2 | 12.3 | 12.9 | 24.7 | |
| 2015 | 13 030 | 59.4 | 40.6 | 28.2 | 8.9 | 12.5 | 13.1 | 12.3 | 25.0 | |
| 2016 | 13 981 | 60.2 | 39.8 | 27.4 | 8.6 | 13.4 | 12.4 | 12.3 | 26.0 | |
Figure 2.
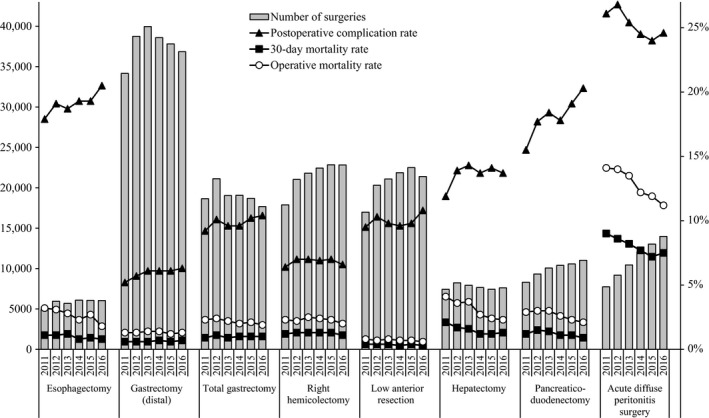
Annual changes of number of surgeries, 30‐day mortality, operative mortality, and complications: Analysis of eight major surgical procedures. Postoperative complication rate: the rate of Clavien‐Dindo (C‐D) classification grade III or higher complications.
Table 14.
Institution and anesthesiologist and specialist participation rates by organ for the eight main operative procedures
| Organ | Year | No. surgeries | Percentage by institution group | Anesthesiologist participation (%) | Board‐certified surgeon participation (%) | Medical practitioners (%) | |||
|---|---|---|---|---|---|---|---|---|---|
| Certified institution | Related institution | Other | Board‐certified surgeons | Non‐board‐certified surgeons | |||||
| Esophagectomy | 2011 | 4916 | 94.2 | 5.3 | 0.5 | 97.6 | 88.4 | 63.5 | 36.5 |
| 2012 | 5946 | 78.3 | 4.9 | 16.8 | 98.1 | 89.0 | 64.8 | 35.2 | |
| 2013 | 5694 | 92.9 | 5.9 | 1.2 | 98.0 | 90.8 | 66.6 | 33.4 | |
| 2014 | 6091 | 93.6 | 4.7 | 1.7 | 98.6 | 92.6 | 70.2 | 29.8 | |
| 2015 | 6060 | 93.6 | 4.6 | 1.8 | 98.5 | 93.5 | 72.1 | 27.9 | |
| 2016 | 6041 | 94.5 | 3.8 | 1.7 | 98.8 | 93.7 | 73.2 | 26.8 | |
| Gastrectomy (distal) | 2011 | 34 160 | 81.1 | 16.6 | 2.3 | 93.2 | 71.3 | 37.0 | 63.0 |
| 2012 | 38 750 | 64.5 | 15.2 | 20.3 | 93.9 | 72.5 | 37.9 | 62.1 | |
| 2013 | 39 957 | 76.6 | 19.2 | 4.1 | 93.6 | 76.1 | 40.6 | 59.4 | |
| 2014 | 38 584 | 77.7 | 17.8 | 4.5 | 94.0 | 78.4 | 42.1 | 57.9 | |
| 2015 | 37 819 | 77.3 | 18.3 | 4.4 | 94.1 | 78.1 | 41.3 | 58.7 | |
| 2016 | 36 852 | 80.2 | 15.9 | 4.0 | 95.0 | 81.8 | 43.8 | 56.2 | |
| Total gastrectomy | 2011 | 18 652 | 80.9 | 16.8 | 2.3 | 93.9 | 71.6 | 37.4 | 62.6 |
| 2012 | 21 122 | 63.0 | 15.3 | 21.7 | 94.3 | 72.1 | 38.0 | 62.0 | |
| 2013 | 19 035 | 77.2 | 18.9 | 3.9 | 94.2 | 75.0 | 39.5 | 60.5 | |
| 2014 | 19 071 | 77.8 | 17.9 | 4.3 | 94.4 | 77.7 | 41.7 | 58.3 | |
| 2015 | 18 695 | 77.9 | 17.9 | 4.1 | 94.5 | 78.2 | 42.6 | 57.4 | |
| 2016 | 17 670 | 80.0 | 15.9 | 4.0 | 95.0 | 81.4 | 45.0 | 55.0 | |
| Right hemicolectomy | 2011 | 17 890 | 75.7 | 21.2 | 3.1 | 92.7 | 66.0 | 30.5 | 69.5 |
| 2012 | 21 034 | 60.0 | 18.3 | 21.7 | 93.0 | 67.1 | 30.8 | 69.2 | |
| 2013 | 21 814 | 72.1 | 22.3 | 5.6 | 92.9 | 69.7 | 32.6 | 67.4 | |
| 2014 | 22 446 | 71.2 | 23.1 | 5.7 | 93.4 | 71.9 | 33.6 | 66.4 | |
| 2015 | 22 850 | 72.1 | 22.0 | 5.9 | 94.1 | 72.4 | 33.5 | 66.5 | |
| 2016 | 22 829 | 73.8 | 20.1 | 6.1 | 94.5 | 74.2 | 34.3 | 65.7 | |
| Low anterior resection | 2011 | 16 984 | 79.4 | 17.7 | 2.9 | 93.4 | 72.7 | 41.6 | 58.4 |
| 2012 | 20 321 | 64.0 | 16.2 | 19.7 | 93.8 | 73.0 | 42.3 | 57.7 | |
| 2013 | 21 096 | 76.3 | 19.5 | 4.2 | 93.7 | 75.5 | 44.3 | 55.7 | |
| 2014 | 21 861 | 76.2 | 19.0 | 4.9 | 94.4 | 78.2 | 47.2 | 52.8 | |
| 2015 | 22 493 | 76.9 | 18.3 | 4.8 | 94.6 | 79.2 | 47.7 | 52.3 | |
| 2016 | 21 387 | 79.0 | 16.4 | 4.7 | 95.0 | 81.0 | 48.8 | 51.2 | |
| Hepatectomy (non‐lateral segments) | 2011 | 7434 | 91.1 | 8.0 | 0.8 | 96.4 | 88.9 | 61.5 | 38.5 |
| 2012 | 8239 | 75.9 | 7.9 | 16.3 | 96.8 | 89.3 | 64.0 | 36.0 | |
| 2013 | 7937 | 88.1 | 9.7 | 2.2 | 96.9 | 91.0 | 65.2 | 34.8 | |
| 2014 | 7666 | 88.2 | 8.7 | 3.1 | 96.7 | 92.3 | 66.6 | 33.4 | |
| 2015 | 7439 | 89.2 | 8.6 | 2.2 | 97.2 | 92.3 | 66.6 | 33.4 | |
| 2016 | 7610 | 90.7 | 7.1 | 2.1 | 97.1 | 93.3 | 67.7 | 32.3 | |
| Pancreaticoduodenectomy | 2011 | 8305 | 87.8 | 11.0 | 1.2 | 95.9 | 85.7 | 58.7 | 41.3 |
| 2012 | 9329 | 72.4 | 8.8 | 18.8 | 96.6 | 87.2 | 60.9 | 39.1 | |
| 2013 | 10 068 | 85.9 | 11.7 | 2.4 | 96.0 | 87.9 | 60.5 | 39.5 | |
| 2014 | 10 400 | 86.4 | 10.4 | 3.3 | 96.4 | 90.3 | 62.2 | 37.8 | |
| 2015 | 10 576 | 88.5 | 9.2 | 2.4 | 96.9 | 90.9 | 62.1 | 37.9 | |
| 2016 | 11 028 | 89.4 | 8.3 | 2.3 | 97.1 | 91.7 | 63.3 | 36.7 | |
| Acute diffuse peritonitis surgery | 2011 | 7753 | 80.6 | 16.9 | 2.4 | 90.0 | 58.5 | 23.5 | 76.5 |
| 2012 | 9177 | 65.2 | 16.4 | 18.4 | 90.4 | 59.4 | 22.7 | 77.3 | |
| 2013 | 10 447 | 77.7 | 18.1 | 4.2 | 91.2 | 62.4 | 23.9 | 76.1 | |
| 2014 | 12 085 | 77.7 | 17.2 | 5.1 | 91.9 | 63.3 | 25.1 | 74.9 | |
| 2015 | 13 030 | 79.8 | 15.9 | 4.3 | 92.2 | 64.5 | 24.9 | 75.1 | |
| 2016 | 13 981 | 82.2 | 13.8 | 4.0 | 93.0 | 66.8 | 26.1 | 73.9 | |
Table 15.
No. surgeries and mortality rates according to organ treated using the eight main operative procedures
| Organ | Year | No. surgeries | No. postoperative complicationsa/rate (%) | No. 30‐day mortalities/rate (%) | No. operative mortalities/rate (%) |
|---|---|---|---|---|---|
| Esophagectomy | 2011 | 4916 | 879/17.9 | 55/1.1 | 158/3.2 |
| 2012 | 5946 | 1135/19.1 | 63/1.1 | 183/3.1 | |
| 2013 | 5694 | 1067/18.7 | 67/1.2 | 161/2.8 | |
| 2014 | 6091 | 1178/19.3 | 49/0.8 | 140/2.3 | |
| 2015 | 6060 | 1171/19.3 | 57/0.9 | 166/2.7 | |
| 2016 | 6041 | 1240/20.5 | 49/0.8 | 109/1.8 | |
| Gastrectomy (distal) | 2011 | 34 160 | 1774/5.2 | 208/0.6 | 451/1.3 |
| 2012 | 38 750 | 2205/5.7 | 232/0.6 | 516/1.3 | |
| 2013 | 39 957 | 2450/6.1 | 239/0.6 | 542/1.4 | |
| 2014 | 38 584 | 2356/6.1 | 264/0.7 | 523/1.4 | |
| 2015 | 37 819 | 2325/6.1 | 222/0.6 | 452/1.2 | |
| 2016 | 36 852 | 2314/6.3 | 249/0.7 | 473/1.3 | |
| Total gastrectomy | 2011 | 18 652 | 1716/9.2 | 177/0.9 | 427/2.3 |
| 2012 | 21 122 | 2135/10.1 | 224/1.1 | 503/2.4 | |
| 2013 | 19 035 | 1831/9.6 | 169/0.9 | 428/2.2 | |
| 2014 | 19 071 | 1840/9.6 | 185/1.0 | 379/2.0 | |
| 2015 | 18 695 | 1907/10.2 | 178/1.0 | 387/2.1 | |
| 2016 | 17 670 | 1835/10.4 | 174/1.0 | 336/1.9 | |
| Right hemicolectomy | 2011 | 17 890 | 1150/6.4 | 213/1.2 | 410/2.3 |
| 2012 | 21 034 | 1470/7.0 | 263/1.3 | 471/2.2 | |
| 2013 | 21 814 | 1527/7.0 | 280/1.3 | 538/2.5 | |
| 2014 | 22 446 | 1544/6.9 | 287/1.3 | 530/2.4 | |
| 2015 | 22 850 | 1607/7.0 | 301/1.3 | 534/2.3 | |
| 2016 | 22 829 | 1510/6.6 | 253/1.1 | 449/2.0 | |
| Low anterior resection | 2011 | 16 984 | 1616/9.5 | 75/0.4 | 136/0.8 |
| 2012 | 20 321 | 2092/10.3 | 88/0.4 | 149/0.7 | |
| 2013 | 21 096 | 2059/9.8 | 80/0.4 | 175/0.8 | |
| 2014 | 21 861 | 2098/9.6 | 70/0.3 | 152/0.7 | |
| 2015 | 22 493 | 2210/9.8 | 95/0.4 | 156/0.7 | |
| 2016 | 21 387 | 2306/10.8 | 68/0.3 | 126/0.6 | |
| Hepatectomy (non‐lateral segments) | 2011 | 7434 | 886/11.9 | 155/2.1 | 303/4.1 |
| 2012 | 8239 | 1146/13.9 | 142/1.7 | 293/3.6 | |
| 2013 | 7937 | 1135/14.3 | 130/1.6 | 290/3.7 | |
| 2014 | 7666 | 1052/13.7 | 94/1.2 | 208/2.7 | |
| 2015 | 7439 | 1049/14.1 | 87/1.2 | 182/2.4 | |
| 2016 | 7610 | 1046/13.7 | 96/1.3 | 178/2.3 | |
| Pancreaticoduodenectomy | 2011 | 8305 | 1285/15.5 | 97/1.2 | 238/2.9 |
| 2012 | 9329 | 1654/17.7 | 137/1.5 | 281/3.0 | |
| 2013 | 10 068 | 1853/18.4 | 142/1.4 | 307/3.0 | |
| 2014 | 10 400 | 1847/17.8 | 111/1.1 | 267/2.6 | |
| 2015 | 10 576 | 2025/19.1 | 120/1.1 | 247/2.3 | |
| 2016 | 11 028 | 2242/20.3 | 98/0.9 | 232/2.1 | |
| Acute diffuse peritonitis surgery | 2011 | 7753 | 2022/26.1 | 697/9.0 | 1096/14.1 |
| 2012 | 9177 | 2456/26.8 | 785/8.6 | 1289/14.0 | |
| 2013 | 10 447 | 2652/25.4 | 861/8.2 | 1408/13.5 | |
| 2014 | 12 085 | 2966/24.5 | 927/7.7 | 1472/12.2 | |
| 2015 | 13 030 | 3126/24.0 | 943/7.2 | 1551/11.9 | |
| 2016 | 13 981 | 3445/24.6 | 1052/7.5 | 1572/11.2 |
Complications were defined by Clavien‐Dindo grade IIIa‐V.
Increase in the incidence of endoscopic surgery is shown in Table 16. Endoscopic surgeries have been prevalent especially in gastrointestinal procedures, while laparoscopic hepatectomy or pancreaticoduodenectomy have been carried out in limited institutions. Even for acute diffuse peritonitis, laparoscopic surgery has been done in 15.5% of all surgeries in 2016.
Table 16.
Annual changes of endoscopic surgeries for the eight main operative procedures
| Organ | Year | No. surgeries | Endoscopic surgery | % Endoscopic surgery |
|---|---|---|---|---|
| Esophagectomy | 2011 | 4917 | 1525 | 31.0 |
| 2012 | 5948 | 2200 | 37.0 | |
| 2013 | 5694 | 2315 | 40.7 | |
| 2014 | 6091 | 2569 | 42.2 | |
| 2015 | 6060 | 2659 | 43.9 | |
| 2016 | 6041 | 2961 | 49.0 | |
| Gastrectomy (distal) | 2011 | 34 198 | 10 801 | 31.6 |
| 2012 | 38 774 | 13 098 | 33.8 | |
| 2013 | 39 959 | 16 507 | 41.3 | |
| 2014 | 38 584 | 14 432 | 37.4 | |
| 2015 | 37 819 | 14 357 | 38.0 | |
| 2016 | 36 852 | 15 333 | 41.6 | |
| Total gastrectomy | 2011 | 18 674 | 2258 | 12.1 |
| 2012 | 21 139 | 3060 | 14.5 | |
| 2013 | 19 038 | 3669 | 19.3 | |
| 2014 | 19 071 | 3620 | 19.0 | |
| 2015 | 18 695 | 3707 | 19.8 | |
| 2016 | 17 670 | 4007 | 22.7 | |
| Right hemicolectomy | 2011 | 17 899 | 4842 | 27.1 |
| 2012 | 21 047 | 6954 | 33.0 | |
| 2013 | 21 816 | 9124 | 41.8 | |
| 2014 | 22 446 | 8269 | 36.8 | |
| 2015 | 22 850 | 8755 | 38.3 | |
| 2016 | 22 829 | 9622 | 42.1 | |
| Low anterior resection | 2011 | 16 996 | 5018 | 29.5 |
| 2012 | 20 333 | 7649 | 37.6 | |
| 2013 | 21 098 | 10 814 | 51.3 | |
| 2014 | 21 861 | 11 298 | 51.7 | |
| 2015 | 22 493 | 12 080 | 53.7 | |
| 2016 | 21 387 | 12 478 | 58.3 | |
| Hepatectomy (non‐lateral segments) | 2011 | 7440 | 242 | 3.3 |
| 2012 | 8246 | 389 | 4.7 | |
| 2013 | 7938 | 567 | 7.1 | |
| 2014 | 7666 | 392 | 5.1 | |
| 2015 | 7439 | 127 | 1.7 | |
| 2016 | 7610 | 433 | 5.7 | |
| Pancreaticoduodenectomy | 2011 | 8310 | 67 | 0.8 |
| 2012 | 9340 | 121 | 1.3 | |
| 2013 | 10 069 | 156 | 1.5 | |
| 2014 | 10 400 | 124 | 1.2 | |
| 2015 | 10 576 | 53 | 0.5 | |
| 2016 | 11 028 | 118 | 1.1 | |
| Acute diffuse peritonitis surgery | 2011 | 7767 | 488 | 6.3 |
| 2012 | 9189 | 652 | 7.1 | |
| 2013 | 10 452 | 1070 | 10.2 | |
| 2014 | 12 085 | 1381 | 11.4 | |
| 2015 | 13 030 | 1638 | 12.6 | |
| 2016 | 13 981 | 2164 | 15.5 |
4. DISCUSSION
Since the start of NCD registration in 2011, surgeons in Japan, especially JSGS members, have constructed a robust nationwide database. We can see the real clinical status of surgical outcomes in Japan. The number of registered surgeries has been increasing year by year. Mortality rates for all of the procedures seem to be acceptable as a nationwide outcome, as they are satisfactorily lower than those reported from other countries.24, 25 These results may be explained by the high participation rate of board‐certified surgeons. Board‐certified surgeons in gastroenterological surgery contribute to favorable outcomes in Japan.21 A multivariable logistic regression model showed that a greater board‐certified surgeon number in hospitals predicted a favorable surgical outcome in relation to operative mortality. Analyzing the data of NCD, we can validate an appropriate number of board‐certified surgeons required to authorize hospitals to carry out invasive surgeries. On the basis of this report, we are now planning to make a revised risk model using the recent data. In the field of hepato‐biliary‐pancreatic surgery, The Japanese Society of Hepato‐Biliary‐Pancreatic Surgery (JSHBPS) established a board‐certification system for expert surgeons (hepato‐biliary‐pancreatic [HBP] field) in 2008, and certification of expert surgeons started in 2011.26, 27 Miura et al.28, 29 reported that a multiple logistic regression model showed that the cut‐offs of high‐level HBP surgeries carried out per year at hospitals that predicted 30‐day mortality after hepatectomy of more than one segment and pancreatoduodenectomy were 10 and 50. Competencies and requirements for board‐certified institutions, instructors, and expert surgeons to carry out hepatectomy or pancreatoduodenectomy were found to be appropriate.
As for complications, this is the first report of the annual complication rate in the 115 selected gastrointestinal operative procedures in the training curriculum for board‐certified surgeons in gastroenterology, and eight main procedures representing the performance of surgery using NCD data. There were differences in the incidence of complications according to organ site or operative procedure. As the complication rates in this report were the sum of all complications with C‐D classification grade III or higher, it is necessary to further analyze on postoperative complication. The registered number of surgeries has been increasing, and older are patients increasing, the trend of which generally means difficulty in maintaining a low complication rate. However, mortality rates have been maintained at a rather low level. Strict indication for surgery and appropriate perioperative management might affect the low mortality rate. It has been shown that performance data released to the public promote quality improvement activity at the hospital level,30, 31 and vice versa.32 It is necessary to analyze with explanations the tendency of surgical outcomes over time. A risk‐adjusted analysis based on nationwide data allows personnel to establish and provide feedback on the risks that patients face before undergoing a procedure.11 The NCD also provides data on each facility's severity‐adjusted clinical performance (benchmark), which can be compared with national data. We can trace periodically where we are in the national standard.
Thinking of the future development of NCD, long‐term clinical outcomes will be demanded, especially in cancer registries. The NCD generalizes site‐specific cancer registries by taking advantage of their excellent organizing ability. Some site‐specific cancer registries, including pancreatic, breast, and liver cancer registries have already been combined with the NCD.33 Aggregation of the cancer registration system and NCD would definitely produce a novel and important database, not only in the field of clinical medicine but also public health. Another possible linkage to NCD is the medical insurance database including diagnosis procedure combination (DPC) data, which includes not only clinical information on disease but also the medical costs by disease or treatment.34
After the first stage of the establishment of the national database, NCD has been proceeding to the second stage, development and utilization. Many studies are in progress to improve quality control of surgical procedures using the NCD. Future evolution of the NCD will be promising with impacts to the public.
DISCLOSURE
Conflicts of Interest: Authors declare no conflicts of interest concerning this project.
ACKNOWLEDGEMENTS
We would like to express the deepest appreciation to Prof. Toshiaki Watanabe for his dedicated contribution to the NCD project. We thank Dr Hiroshi Hasegawa for data collection. We thank all the data managers and hospitals participating in this NCD project for their continued efforts in entering the data.
Kakeji Y, Takahashi A, Udagawa H, et al. Surgical outcomes in gastroenterological surgery in Japan: Report of National Clinical database 2011–2016. Ann Gastroenterol Surg. 2018;2:37–54. https://doi.org/10.1002/ags3.12052
REFERENCES
- 1. Miyata H, Gotoh M, Hashimoto H, et al. Challenges and prospects of a clinical database linked to the board certification system. Surg Today. 2014;44:1991–9. [DOI] [PubMed] [Google Scholar]
- 2. Seto Y, Kakeji Y, Miyata H, Iwanaka T. National Clinical Database (NCD) in Japan for gastroenterological surgery: brief introduction. Ann Gastroenterol Surg. 2017;1:80–1. [DOI] [PMC free article] [PubMed] [Google Scholar]
- 3. Takeuchi H, Miyata H, Gotoh M, et al. A risk model for esophagectomy using data of 5354 patients included in a Japanese nationwide web‐based database. Ann Surg. 2014;260:259–66. [DOI] [PubMed] [Google Scholar]
- 4. Kurita N, Miyata H, Gotoh M, et al. Risk model for distal gastrectomy when treating gastric cancer on the basis of data from 33,917 Japanese patients collected using a nationwide web‐based data entry system. Ann Surg. 2015;262:295–303. [DOI] [PubMed] [Google Scholar]
- 5. Watanabe M, Miyata H, Gotoh M, et al. Total gastrectomy risk model: data from 20,011 Japanese patients in a nationwide internet‐based database. Ann Surg. 2014;260:1034–9. [DOI] [PubMed] [Google Scholar]
- 6. Kobayashi H, Miyata H, Gotoh M, et al. Risk model for right hemicolectomy based on 19,070 Japanese patients in the National Clinical Database. J Gastroenterol. 2014;49:1047–55. [DOI] [PubMed] [Google Scholar]
- 7. Matsubara N, Miyata H, Gotoh M, et al. Mortality after common rectal surgery in Japan: a study on low anterior resection from a newly established nationwide large‐scale clinical database. Dis Colon Rectum. 2014;57:1075–81. [DOI] [PubMed] [Google Scholar]
- 8. Kenjo A, Miyata H, Gotoh M, et al. Risk stratification of 7,732 hepatectomy cases in 2011 from the National Clinical Database for Japan. J Am Coll Surg. 2014;218:412–22. [DOI] [PubMed] [Google Scholar]
- 9. Kimura W, Miyata H, Gotoh M, et al. A pancreaticoduodenectomy risk model derived from 8575 cases from a national single‐race population (Japanese) using a web‐based data entry system: the 30‐day and in‐hospital mortality rates for pancreaticoduodenectomy. Ann Surg. 2014;259:773–80. [DOI] [PubMed] [Google Scholar]
- 10. Nakagoe T, Miyata H, Gotoh M, et al. Surgical risk model for acute diffuse peritonitis based on a Japanese nationwide database: an initial report on the surgical and 30‐day mortality. Surg Today. 2015;45:1233–43. [DOI] [PubMed] [Google Scholar]
- 11. Gotoh M, Miyata H, Hashimoto H, et al. National Clinical Database feedback implementation for quality improvement of cancer treatment in Japan: from good to great through transparency. Surg Today. 2016;46:38–47. [DOI] [PMC free article] [PubMed] [Google Scholar]
- 12. Kunisaki C, Miyata H, Konno H, et al. Modeling preoperative risk factors for potentially lethal morbidities using a nationwide Japanese web‐based database of patients undergoing distal gastrectomy for gastric cancer. Gastric Cancer. 2017;20:496–507. [DOI] [PubMed] [Google Scholar]
- 13. Kikuchi H, Miyata H, Konno H, et al. Development and external validation of preoperative risk models for operative morbidities after total gastrectomy using a Japanese web‐based nationwide registry. Gastric Cancer. 2017;20:987–97. [DOI] [PMC free article] [PubMed] [Google Scholar]
- 14. Watanabe T, Miyata H, Konno H, et al. Prediction model for complications after low anterior resection based on data from 33,411 Japanese patients included in the National Clinical Database. Surgery. 2017;161:1597–608. [DOI] [PubMed] [Google Scholar]
- 15. Yokoo H, Miyata H, Konno H, et al. Models predicting the risks of six life‐threatening morbidities and bile leakage in 14,970 hepatectomy patients registered in the National Clinical Database of Japan. Medicine (Baltimore). 2016;95:e5466. [DOI] [PMC free article] [PubMed] [Google Scholar]
- 16. Aoki S, Miyata H, Gotoh M, et al. Risk factors of serious postoperative complications after pancreaticoduodenectomy and risk calculators for predicting postoperative complications: a nationwide study of 17,564 patients in Japan. J Hepatobiliary Pancreat Sci. 2017;24:243–51. [DOI] [PMC free article] [PubMed] [Google Scholar]
- 17. Saze Z, Miyata H, Konno H, et al. Risk models of operative morbidities in 16,930 critically ill surgical patients based on a Japanese Nationwide Database. Medicine (Baltimore). 2015;94:e1224. [DOI] [PMC free article] [PubMed] [Google Scholar]
- 18. Konno HWG, Udagawa H, Unno M, et al. Annual report of national clinical database in gastroenterological surgery 2011–2012. Jpn J Gastroenterol Surg. 2013;46:952–63. [Google Scholar]
- 19. Wakabayashi GHK, Udagawa H, Unno M, et al. Annual report of national clinical database in gastroenterological surgery 2014. Jpn J Gastroenterol Surg. 2015;48:1032–44. [Google Scholar]
- 20. Kakeji Y, Udagawa H, Unno M, et al. Annual report of national clinical database in gastroenterological surgery 2015. Jpn J Gastroenterol Surg. 2017;50:166–76. [Google Scholar]
- 21. Konno H, Kamiya K, Kikuchi H, et al. Association between the participation of board‐certified surgeons in gastroenterological surgery and operative mortality after eight gastroenterological procedures. Surg Today. 2017;47:611–8. [DOI] [PubMed] [Google Scholar]
- 22. Dindo D, Demartines N, Clavien PA. Classification of surgical complications: a new proposal with evaluation in a cohort of 6336 patients and results of a survey. Ann Surg. 2004;240:205–13. [DOI] [PMC free article] [PubMed] [Google Scholar]
- 23. Katayama H, Kurokawa Y, Nakamura K, et al. Extended Clavien‐Dindo classification of surgical complications: Japan Clinical Oncology Group postoperative complications criteria. Surg Today. 2016;46:668–85. [DOI] [PMC free article] [PubMed] [Google Scholar]
- 24. Anazawa T, Paruch JL, Miyata H, et al. Comparison of national operative mortality in gastroenterological surgery using web‐based prospective data entry systems. Medicine (Baltimore). 2015;94:e2194. [DOI] [PMC free article] [PubMed] [Google Scholar]
- 25. Pearse RM, Moreno RP, Bauer P, et al. Mortality after surgery in Europe: a 7 day cohort study. Lancet. 2012;380:1059–65. [DOI] [PMC free article] [PubMed] [Google Scholar]
- 26. Takada T. Preface I: highly advanced surgery in the hepatobiliary and pancreatic field. J Hepatobiliary Pancreat Sci. 2012;19:1. [Google Scholar]
- 27. Unno M. Preface II: highly advanced surgery in the hepatobiliary and pancreatic field. J Hepatobiliary Pancreat Sci. 2012;19:2. [Google Scholar]
- 28. Miura F, Yamamoto M, Gotoh M, et al. Validation of the board certification system for expert surgeons (hepato‐biliary‐pancreatic field) using the data of the National Clinical Database of Japan: part 1—hepatectomy of more than one segment. J Hepatobiliary Pancreat Sci. 2016;23:313–23. [DOI] [PubMed] [Google Scholar]
- 29. Miura F, Yamamoto M, Gotoh M, et al. Validation of the board certification system for expert surgeons (hepato‐biliary‐pancreatic field) using the data of the National Clinical Database of Japan: part 2—pancreatoduodenectomy. J Hepatobiliary Pancreat Sci. 2016;23:353–63. [DOI] [PubMed] [Google Scholar]
- 30. Fung CH, Lim YW, Mattke S, Damberg C, Shekelle PG. Systematic review: the evidence that publishing patient care performance data improves quality of care. Ann Intern Med. 2008;148:111–23. [DOI] [PubMed] [Google Scholar]
- 31. Lee TH. Eulogy for a quality measure. N Engl J Med. 2007;357:1175–7. [DOI] [PubMed] [Google Scholar]
- 32. Werner RM, Asch DA. The unintended consequences of publicly reporting quality information. JAMA. 2005;293:1239–44. [DOI] [PubMed] [Google Scholar]
- 33. Anazawa T, Miyata H, Gotoh M. Cancer registries in Japan: National Clinical Database and site‐specific cancer registries. Int J Clin Oncol. 2015;20:5–10. [DOI] [PubMed] [Google Scholar]
- 34. Yasunaga H, Hashimoto H, Horiguchi H, Miyata H, Matsuda S. Variation in cancer surgical outcomes associated with physician and nurse staffing: a retrospective observational study using the Japanese Diagnosis Procedure Combination Database. BMC Health Serv Res. 2012;12:129. [DOI] [PMC free article] [PubMed] [Google Scholar]