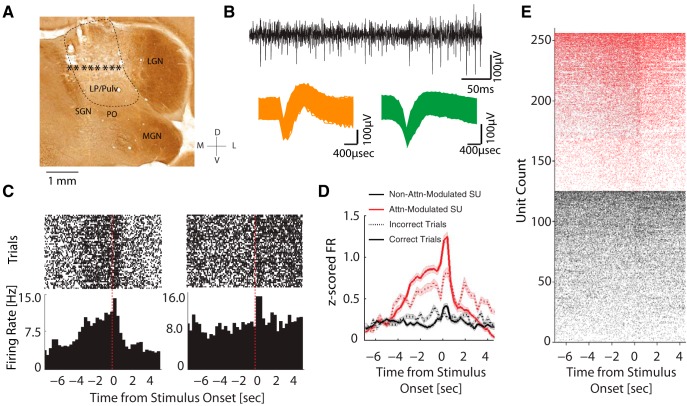
Figure 2.
Single-unit responses during task performance. A, Representative coronal section; stars indicate the estimated locations of the electrode tips. Electrodes outside of LP/pulvinar (LP/Pulv) were excluded. LGN, lateral geniculate nucleus; MGN, medial geniculate nucleus; PO, nucleus of the posterior group; SGN, suprageniculate nucleus. B, top, Example of high-pass filtered raw trace from representative recording session. Bottom, Action potentials of two representative single units. C, Peri-event raster plots (top) and peri-event histograms of the corresponding firing rates (bottom) of two representative neurons. The unit on the left exhibited an increasing firing during the delay period, whereas the unit on the right did not show such modulation but rather increased its firing rate after stimulus onset. D, Z-score normalized population firing rate of attention-modulated (red, n = 130) and non-attention-modulated units (black, n = 129) in correct trials (solid lines) and in incorrect trials (dotted lines). Attention-modulated units gradually increased their firing rate during the delay period. Both neuron types displayed a transient increase in firing rate after stimulus onset, with stronger responses in attention-modulated neurons. Shaded areas indicate SEM. E, Peri-event raster plots from all the attention-modulated (red, n = 130) and non-attention-modulated units (black, n = 129) in all correct trials. Units from each category are sorted by their mean firing rate in the delay period.

