

Abstract
Most eukaryotes have two Rad51/RecA family recombinases, Rad51, which promotes recombination during mitotic double‐strand break (DSB) repair, and the meiosis‐specific recombinase Dmc1. During meiosis, the strand exchange activity of Rad51 is downregulated through interactions with the meiosis‐specific protein Hed1, which helps ensure that strand exchange is driven by Dmc1 instead of Rad51. Hed1 acts by preventing Rad51 from interacting with Rad54, a cofactor required for promoting strand exchange during homologous recombination. However, we have a poor quantitative understanding of the regulatory interplay between these proteins. Here, we use real‐time single‐molecule imaging to probe how the Hed1‐ and Rad54‐mediated regulatory network contributes to the identity of mitotic and meiotic presynaptic complexes. Based on our findings, we define a model in which kinetic competition between Hed1 and Rad54 helps define the functional identity of the presynaptic complex as cells undergo the transition from mitotic to meiotic repair.
Keywords: homologous recombination, meiosis, Rad51 recombinase, single‐molecule imaging
Subject Categories: DNA Replication, Repair & Recombination
Introduction
Homologous recombination (HR) is a universally conserved process that is used to repair double‐strand breaks (DSBs), protect genomic integrity, and ensure genetic diversity within populations (Neale & Keeney, 2006; San Filippo et al, 2008; Symington et al, 2014). HR proceeds through the resection of broken double‐strand DNA (dsDNA), yielding long single‐strand DNA (ssDNA) overhangs, which are paired with a homologous dsDNA elsewhere in the genome, that is used as a template for repair of the damaged DNA (San Filippo et al, 2008; Symington et al, 2014).
During HR, the 3′ ssDNA overhang is first bound by the heterotrimeric eukaryotic ssDNA‐binding protein RPA (replication protein A), which protects the ssDNA from nucleases, removes secondary structure, and serves as a signal for initiating the DNA damage response (Wold, 1997; San Filippo et al, 2008; Chen & Wold, 2014; Symington et al, 2014). RPA is then replaced by Rad51, which forms an extended right‐handed helical filament on the 3′ ssDNA overhang (Conway et al, 2004; Chen et al, 2008; Sheridan et al, 2008; Kowalczykowski, 2015; Morrical, 2015). The resulting nucleoprotein filament is referred to as the presynaptic complex (San Filippo et al, 2008; Heyer et al, 2010; Symington et al, 2014). The Rad51 presynaptic complex pairs the bound ssDNA with the complementary strand of a homologous dsDNA, and this strand invasion reaction results in displacement of the non‐complementary strand. The resulting D‐loop intermediate can be processed through several different pathways, leading to repair of the damaged DNA (Paques & Haber, 1999; San Filippo et al, 2008; Heyer et al, 2010; Mehta & Haber, 2014; Symington et al, 2014).
Rad54 is a member of the Swi/Snf family of dsDNA translocases, it is a required cofactor that stimulates the strand invasion activity of Rad51, and it is one of the most highly conserved eukaryotic HR proteins (Heyer et al, 2006; Mazin et al, 2010; Ceballos & Heyer, 2011; Kowalczykowski, 2015). Rad54 deletion imparts sensitivity to DNA‐damaging agents (Petukhova et al, 1999; Wesoly et al, 2006), causes defects in strand invasion (Sugawara et al, 2003; Renkawitz et al, 2013), and leads to the accumulation of toxic HR intermediates (Shah et al, 2010). Rad54 is a key accessory factor for regulating Rad51 activity. Association with the presynaptic complex stimulates the ATP hydrolysis activity of Rad54 and greatly increases the efficiency of Rad51‐mediated strand invasion (Jiang et al, 1996; Petukhova et al, 1998; Mazin et al, 2000; Van Komen et al, 2000; Raschle et al, 2004). Collectively, it is believed that protein–protein interactions between Rad51 and Rad54 enhance both the homology search and strand invasion during mitotic HR (Kowalczykowski, 2015). In addition, Rad54 has been implicated in stabilization of the Rad51 presynaptic complex (Mazin et al, 2003), DNA branch migration (Bugreev et al, 2006; Rossi & Mazin, 2008), nucleosome remodeling (Alexiadis & Kadonaga, 2002; Alexeev et al, 2003; Jaskelioff et al, 2003), and removal of Rad51 after completion of strand exchange (Symington & Heyer, 2006; Ceballos & Heyer, 2011; Wright & Heyer, 2014).
During meiosis, HR‐mediated repair of programmed DSBs creates a physical linkage between homologous chromosomes, helping to ensure proper chromosome segregation and allowing for the creation of new allelic combinations (Lao & Hunter, 2010; Brown & Bishop, 2014; Lam & Keeney, 2014; Zickler & Kleckner, 2015). Meiotic recombination requires a number of meiosis‐specific proteins and also coincides with the selective inhibition of Rad51 (Neale & Keeney, 2006; Brown & Bishop, 2014). Rad51 inhibition is achieved through two meiosis‐specific regulatory proteins, Hed1 and Mek1 (Niu et al, 2009; Brown & Bishop, 2014). Mek1 is a kinase that phosphorylates a number of proteins during meiosis, including Rad54 (Niu et al, 2009) and histone H3 (Govin et al, 2010; Kniewel et al, 2017), to help suppress sister‐directed repair (Liu et al, 2014). Hed1 is a regulatory factor that interferes with Rad54 binding to Rad51 (Busygina et al, 2008, 2012). Rad54 is a required cofactor for Rad51 strand invasion activity in vivo; therefore, Hed1 binding downregulates the activity of Rad51 in meiosis. Hed1 deletion results in delayed appearance of meiotic DSBs and delayed production of crossover recombination products (Lao et al, 2013). Hed1 is also phosphorylated by Mek1, thereby promoting Hed1 stability (Callender et al, 2016). Meiotic recombination also requires the meiosis‐specific recombinase Dmc1 (Bishop et al, 1992; Bishop, 1994; Neale & Keeney, 2006; Brown & Bishop, 2014). Saccharomyces cerevisiae Dmc1 is ~45% identical to Rad51, and Dmc1 is thought to act as the active recombinase during meiosis, with Rad51 acting as an accessory factor to mediate Dmc1 filament assembly (Cloud et al, 2012; Brown & Bishop, 2014). Rdh54 is a Rad54 homolog that, while expressed in mitotic cells, is thought to play a primary role during meiosis, potentially acting as a Dmc1‐specific accessory factor (Dresser et al, 1997; Klein, 1997; Nimonkar et al, 2012). Interestingly, Rad54 stimulates Dmc1‐mediated strand invasion in vitro (Nimonkar et al, 2012; Busygina et al, 2013) and deletion of RAD54 in S. cerevisiae causes delayed progression through meiosis and decreased spore viability (Shinohara et al, 1997), leading to speculation that these phenotypes may be caused by an interaction between Rad54 and Dmc1. However, genetic evidence suggests the role of Rad54 during meiosis is to repair excess DSBs through sister chromatid recombination and is not required for interhomolog recombination (Shinohara et al, 1997, 2003). It remains unclear whether Rad54 can physically discriminate between Rad51 and Dmc1, and it also remains unclear how the regulatory interplay between Hed1 and Rad54 controls the activities of Rad51 as cells transition into meiosis.
Here, we utilize ssDNA curtains to observe the protein–protein and protein–DNA interactions that contribute to the maturation of mitotic and meiotic presynaptic complexes. We find that RPA prevents premature association of both Rad54 and Hed1 with ssDNA, helping to ensure a defined progression of assembly events. However, RPA is readily replaced with either Rad51 or Dmc1 in our assays (Gibb et al, 2014b; Qi et al, 2015; Qi & Greene, 2016; Ma et al, 2017c), allowing Rad54 to associate with the presynaptic complexes. The complexes formed between Rad54 and either Rad51 or Dmc1 are remarkably stable. However, once bound, the continued presence of Rad54 becomes independent of either Rad51 or Dmc1 filament stability, suggesting that Rad54 is loaded directly onto the underlying ssDNA. We also demonstrate that Hed1 binds selectively to Rad51 presynaptic complexes, and these binding interactions are essentially irreversible, so long as the Rad51 filament remains intact. In addition, we demonstrate that the Hed1 ssDNA‐binding domain is dispensable for its association with the Rad51 presynaptic complex, but deletion of amino acids responsible for Hed1 ssDNA‐binding activity prevents Hed1‐mediated inhibition of Rad54 binding. Given these findings, we describe a model in which kinetic competition between Hed1 and Rad54 for binding interactions with Rad51 helps define the functional identity of the resulting presynaptic complexes during the transition into meiosis.
Results
RPA restricts Rad54 association with single‐stranded DNA
The interaction between Rad51 and Rad54 is essential for promoting efficient recombination (Tan et al, 2003; Heyer et al, 2006; Mazin et al, 2010; Shah et al, 2010). Rad54 binds to the Rad51 presynaptic complex, but quantitative measures of this interaction remain unavailable (Mazin et al, 2003; Raschle et al, 2004). Therefore, we sought to quantitate the association of Rad54 with the presynaptic complex using ssDNA curtains with total internal fluorescent microscopy (TIRFM) (Gibb et al, 2014b; Ma et al, 2017c). This approach allows us to visualize individual ssDNA molecules that can be sequentially coated with GFP‐ or mCherry‐RPA followed by unlabeled Rad51, in a situation that closely mimics physiological assembly of the presynaptic complex (Fig 1A).
Figure 1. GFP‐Rad54 binds to Rad51‐ssDNA filaments.
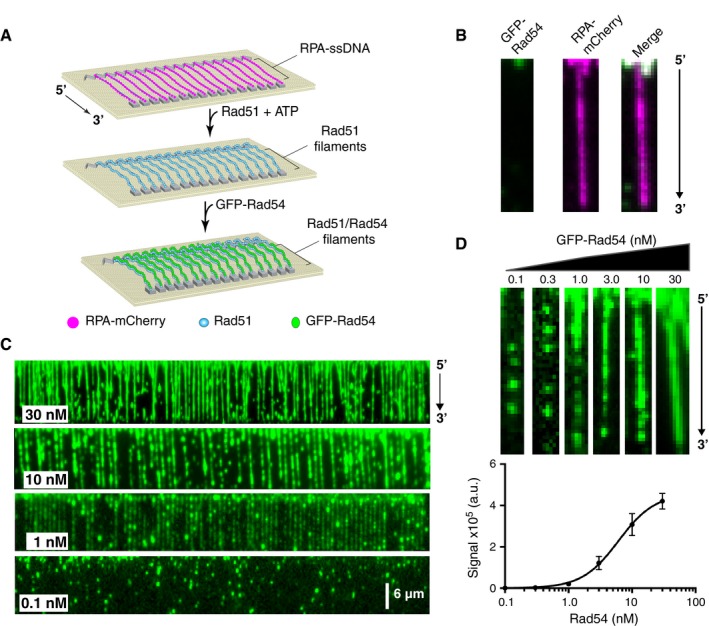
- Schematic diagram outlining the ssDNA curtain assays used to test for GFP‐Rad54 binding to the Rad51‐ssDNA filaments. The cartoon illustrates the progression of steps from RPA‐coated ssDNA to Rad51‐ssDNA filaments, followed by the binding of Rad54, as indicated.
- Wide‐field images of a single ssDNA molecule bound by RPA‐mCherry and chased with 30 nM GFP‐Rad54. The left panel shows the GFP‐Rad54 signal, the middle panel shows the mCherry‐RPA signal, and the right panel shows the merged image.
- Wide‐field TIRFM images of Rad51‐ssDNA molecules (unlabeled) bound by GFP‐Rad54 (shown in green). The images were collected using 0.1, 1.0, 10, or 30 nM GFP‐Rad54 as indicated.
- Examples of single Rad51‐ssDNA molecules (unlabeled) bound by 0.1, 0.3, 1.0, 3.0, 10, or 30 nM GFP‐Rad54 (top panel). Graph showing the GFP‐Rad54 signal intensity, integrated over the entire lengths of the ssDNA substrates, as a function of GFP‐Rad54 concentration (bottom panel). The data were fit by non‐linear regression, and error bars represent the standard deviation (s.d.) for individual ssDNA molecules at each concentration of GFP‐Rad54. The number of Rad51‐ssDNA molecules (n) analyzed at each GFP‐Rad54 concentration was as follows: 0.1 nM (n = 30), 0.3 nM (n = 30), 1.0 nM (n = 60), 3.0 nM (n = 48), 10 nM (n = 60), and 30.0 nM (n = 60).
Source data are available online for this figure.
To monitor Rad54 binding, we used GFP‐tagged Rad54 (Fig EV1A). Purified GFP‐Rad54 was active for DNA‐dependent ATP hydrolysis activity and also stimulated Rad51‐mediated D‐loop formation similar to WT Rad54 (Fig EV1B and D). The RPA‐ssDNA complex is one of the earliest intermediates during HR (Heyer et al, 2010; Gibb et al, 2014b), and Rad54 harbors a ssDNA‐binding domain (Wright & Heyer, 2014). Therefore, to test that Rad54 recruitment did not occur before Rad51 filament formation, we first tested the ability of GFP‐Rad54 to bind mCherry‐RPA filaments. Rad54 was unable to bind RPA filaments under the concentration regime tested (up to 30 nM GFP‐Rad54) (Fig 1B), indicating that RPA prevents the binding of Rad54 to ssDNA in the absence of Rad51, which is consistent with in vivo observations of recombination foci in S. cerevisiae (Lisby et al, 2004).
Figure EV1. Biochemical activities of GFP‐Rad54.
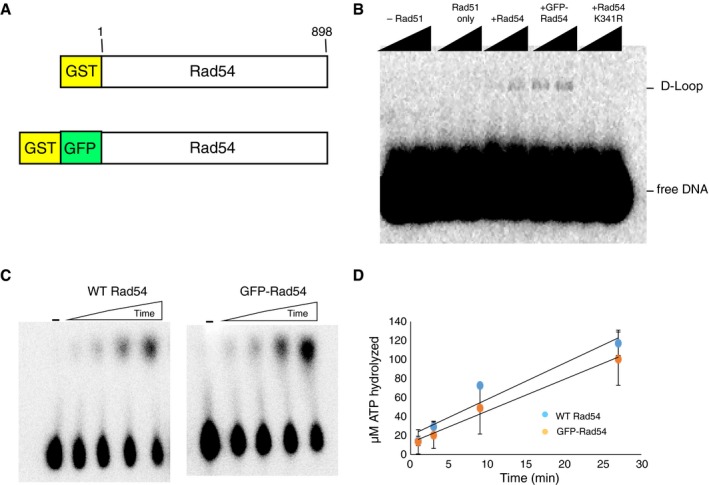
- Schematic diagram of the GFP‐Rad54 fusion construct used in this study.
- Gel image showing that GFP‐Rad54 retains in vitro D‐loop activity. The ATP hydrolysis‐deficient mutant Rad54 K351R (30 nM) is shown as a negative control.
- Comparison of ATP hydrolysis activities for 30 nM Rad54 and 30 nM GFP‐Rad54.
- Quantification of ATP hydrolysis rates for 30 nM Rad54 or 30 nM GFP‐Rad54. Error bars represent s.d. of three independent experiments (N = 3).
Rad54 association with the Rad51‐ssDNA presynaptic complex
Next, we tested GFP‐Rad54 binding to Rad51‐ssDNA filaments, which were prepared by exchanging the fluorescently tagged RPA for unlabeled Rad51, as previously described (Gibb et al, 2014b; Qi et al, 2015). In striking contrast to results with RPA‐ssDNA, GFP‐Rad54 bound to the Rad51‐ssNDA filaments at concentrations as low as 0.1 nM (Fig 1C). At low concentrations, we could readily discern GFP‐Rad54 as individual stationary, fluorescent puncta bound to the Rad51‐ssDNA (Fig 1C and D). With increasing protein concentrations, the binding of Rad54 appeared more uniform along the Rad51‐ssDNA filaments and appeared to approach saturation around 30 nM GFP‐Rad54 (Fig 1C). We quantitated the cumulative fluorescent signal intensity at equilibrium by integrating the GFP signal intensity over the entire lengths of the Rad51‐ssDNA filaments at 0.1, 0.3, 1.0, 3.0, 10, and 30 nM GFP‐Rad54. The resulting data were fit by non‐linear regression, yielding a dissociation constant (K d) of 6.1 ± 0.6 nM, a Hill coefficient of 1.51 ± 0.3, and mean maximum signal intensity (Bmax) of ~4.57 ± 0.4 × 10⁵ (a.u.) (Fig 1D). It is important to note that we could not go higher than 30 nM GFP‐Rad54, due to high background; thus, values determined from the non‐linear regression are based on the extrapolated saturation point. Importantly, we do not observe Rad54 translocation on the ssDNA substrates (even though ATP is present in all of the assays), as has been observed for Rad54 bound to dsDNA (Amitani et al, 2006; Ceballos & Heyer, 2011). The absence of translocation activity supports existing models in which the ssDNA‐binding domain interacts with the presynaptic ssDNA, whereas the dsDNA‐binding motor domain of Rad54 is oriented outward toward solution to allow for interactions with dsDNA during the homology search and strand invasion (Ceballos & Heyer, 2011; Wright & Heyer, 2014).
We next estimated the number of Rad54 molecules bound at saturation. We took advantage of the fact that at low concentrations, we were able to observe individual GFP‐Rad54 binding events (Fig EV2A). We could determine the number of GFP molecules associated with these binding events by monitoring the number of photo‐bleaching steps. From this analysis, we observed that the majority (~60%) of binding events resulted in single‐step photo‐bleaching, with a smaller number of events showing two, three, or four photo‐bleaching steps (Fig EV2B and C). Control experiments confirmed that these events were due to photo‐bleaching and not due to protein dissociation (Fig EV2D). These data indicate that under these conditions, Rad54 binds initially as a monomer to the Rad51‐ssDNA filaments. We next measured the total GFP signal intensity associated with the single‐step photo‐bleaching events and found this to be 147 ± 20 intensity units per molecule of GFP‐Rad54 (Fig EV2E). Taking the mean maximum GFP‐Rad54 signal intensity (Bmax) from the Rad54 titration curve (Fig 1D) and dividing by average signal intensity per molecule yielded a value of ~3,100 molecules of GFP‐Rad54 per ssDNA molecule. For a ssDNA ~36,000 bases in length (Qi et al, 2015), this would give a value of ~1 Rad54 molecule per ~12 nucleotides (nt) or ~1 Rad54 molecule for every ~4 Rad51 monomers. It should be noted that these estimates are based on ssDNA that is completely saturated with Rad51, with each monomer occupying three nucleotides. In our experimental system, it is likely there will be some gaps in the Rad51 filaments, and these discontinuities may alter the ratio of Rad54 to Rad51. Regardless, these estimates provide an indication of the strong association between Rad54 and Rad51 within the presynaptic complex.
Figure EV2. Single‐step photo‐bleaching assays for GFP‐Rad54 binding to Rad51‐ssDNA .
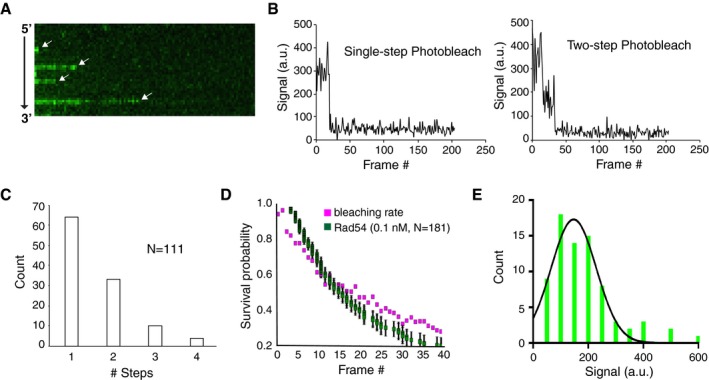
- Kymograph depicting binding of GFP‐Rad54 (0.1 nM; green) to the Rad51‐ssDNA filament (unlabeled). The white arrows indicate individual Rad54 binding and bleaching events.
- Representative traces showing one‐ and two‐step photo‐bleaching events for GFP‐Rad54 (0.1 nM) bound to Rad51‐ssDNA.
- Quantification of the number of observed photo‐bleaching steps determined from low concentration binding of GFP‐Rad54 (0.1 nM).
- Survival probability of individual molecules of GFP‐Rad54 (green squares; n = 181) bound to the Rad51‐ssDNA filament compared to rate of GFP‐Rad54 photo‐bleaching (magenta). Error bars for the survival probability data were derived from bootstrapping analysis using a custom Python script.
- Distribution of signal intensity drops for individual GFP‐Rad54 photo‐bleaching events. The data were fit by a log‐normal distribution, with a mean of 147 ± 20 intensity units. The error represents a 95% confidence interval for the data fit.
Rad54 binding to Rad51 and Dmc1 presynaptic complexes
Dmc1 is a meiosis‐specific recombinase found in most eukaryotes (Bishop et al, 1992; Neale & Keeney, 2006; Brown & Bishop, 2014). Rad54 is required for normal progression through meiosis (Shinohara et al, 1997), and Rad54 interacts with Dmc1 and stimulates Dmc1 strand exchange activity in vitro (Nimonkar et al, 2012; Busygina et al, 2013). However, genetic evidence suggests that Rad54 and Dmc1 function in alternate pathways (Dresser et al, 1997; Bishop et al, 1999; Liu et al, 2014). To help further examine the potential role(s) of Rad54 in meiosis, here we sought to determine whether Rad54 could physically discriminate between Rad51 and Dmc1.
We first tested the ability of GFP‐Rad54 to bind Dmc1 filaments (Fig 2A) and found a concentration‐dependent increase in Rad54 binding under equilibrium binding conditions, which was comparable to Rad54 binding on Rad51 filaments (Fig 2B). Analysis of GFP‐Rad54 binding to the Dmc1‐ssDNA filaments under increasing GFP‐Rad54 concentrations by non‐linear regression (Fig 2B) yielded a dissociation constant (K d) of 3.5 ± 0.73 nM, a Hill coefficient of 1.33 ± 0.5, and mean maximum signal intensity (Bmax) of ~2.13 ± 0.5 × 10⁵ (a.u.) (Fig 2C). Interestingly, the Bmax value for GFP‐Rad54 binding to Dmc1‐ssDNA was ~twofold lower than that observed for GFP‐Rad54 binding to Rad51‐ssDNA (Fig 2C), corresponding to ~1 Rad54 molecule per ~24 nucleotides (nt) or ~1 Rad54 molecule for every ~8 Dmc1 monomers. We next monitored the GFP‐Rad54 binding kinetics to either Rad51‐ssDNA or Dmc1‐ssDNA filaments in real time (Fig 2D). Quantitation of the resulting data revealed no discernable difference in the rate of GFP‐Rad54 association with either the Rad51‐ or Dmc1‐ssDNA filaments (Fig 2D and E). Analysis of the maximum signal intensity values (Bmax) for GFP‐Rad54 binding confirmed a ~two‐ to threefold lower saturation level for GFP‐Rad54 to Dmc1‐ssDNA filaments relative to the Rad51‐ssDNA filaments (Fig 2F). This finding is in agreement with our equilibrium binding analysis, and together, these findings suggest that Rad51‐ssDNA filaments support the binding of roughly twice as much GFP‐Rad54 compared to Dmc1‐ssDNA filaments of equivalent length.
Figure 2. Comparison of GFP‐Rad54 binding to Dmc1‐ and Rad51‐ssDNA filaments.
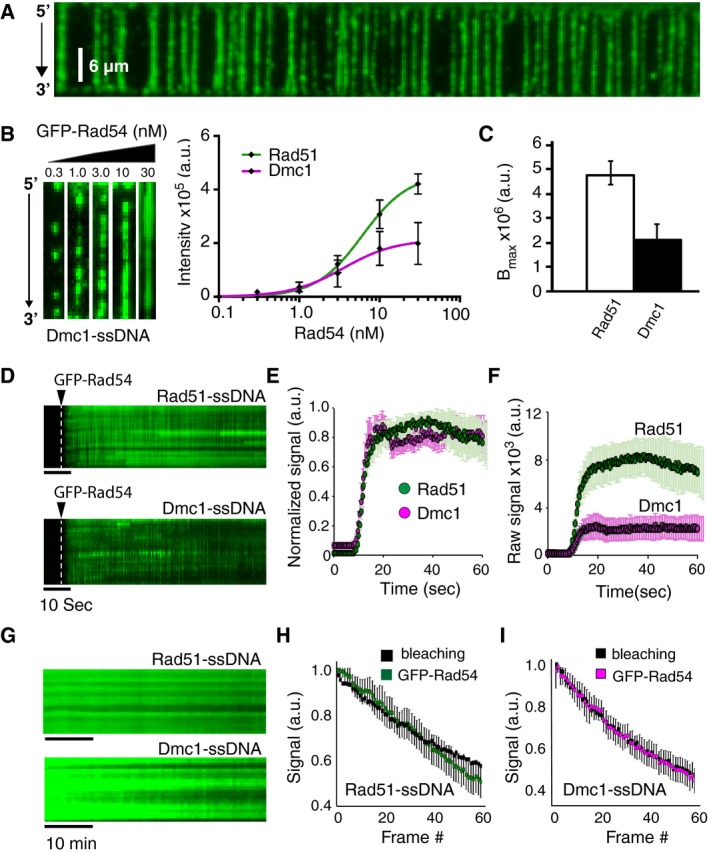
- Wide‐field TIRFM image of Dmc1‐ssDNA (unlabeled) bound by GFP‐Rad4 (10 nM; shown in green).
- Images of single Dmc1‐ssDNA molecules (unlabeled) bound by GFP‐Rad54 (left panel). Graph showing the GFP‐Rad54 signal intensity, integrated over the entire lengths of the ssDNA substrates, as a function of GFP‐Rad54 concentration (right panel). The data were fit by non‐linear regression, and error bars represent s.d. for individual ssDNA molecules at each concentration of GFP‐Rad54. The number of Dmc1‐ssDNA molecules analyzed at each GFP‐Rad54 concentration was as follows: 0.1 nM (n = 30); 0.3 nM (n = 30); 1.0 nM (n = 30); 3.0 nM (n = 30); 10 nM (n = 30); and 30.0 nM (n = 30). Note that the curve for Rad51 shown here is reproduced from Fig 1D to allow for ready comparison between the Rad51 and Dmc1 data.
- Maximum signal intensity (Bmax) for the integrated GFP‐Rad54 signal collected from Rad51‐ssDNA and Dmc1‐ssDNA molecules in panel (B). Values were obtained from non‐linear regression analysis of the GFP‐Rad54 titration data for Rad51‐ssDNA and Dmc1‐ssDNA, and the error bars represent 95% confidence intervals for the fit data.
- Kymographs depicting real‐time association of GFP‐Rad54 (green) with Rad51‐ssDNA (top panel) and Dmc1‐ssDNA (bottom panel).
- Quantification of normalized integrated fluorescence intensity for GFP‐Rad54 association kinetics on Rad51‐ssDNA (green circles; n = 20) and Dmc1‐ssDNA (magenta circles; n = 25) filaments. Error bars represent s.d. for individual Rad51‐ or Dmc1‐ssDNA molecules.
- Quantification of raw integrated fluorescence intensity for GFP‐Rad54 association kinetics on Rad51‐ssDNA (green circles; n = 20) and Dmc1‐ssDNA (magenta circles; n = 25) filaments. Error bars represent s.d. for individual Rad51‐ or Dmc1‐ssDNA molecules.
- Kymographs depicting the dissociation of GFP‐Rad54 (green) with Rad51‐ssDNA (top panel) and Dmc1‐ssDNA (bottom panel) after free GFP‐Rad54 was flushed from the sample chamber.
- Normalized fluorescence data comparing the rate of GFP‐Rad54 signal loss due to protein dissociation from experiments performed with Rad51‐ssDNA (green; n = 30), to the rate of GFP‐Rad54 photo‐bleaching (black; n = 40); error bars represent s.d. between different ssDNA molecules. Photo‐bleaching data were collected by continuously illuminating the sample while collecting images at 100‐ms intervals, whereas dissociation rate data were collected at 1‐min intervals and the laser was shuttered between each image, as previously described (Gibb et al, 2014a).
- Normalized fluorescence data comparing the rate of GFP‐Rad54 signal loss due to protein dissociation from experiments performed with Dmc1‐ssDNA (magenta; n = 25), to the rate of GFP‐Rad54 photo‐bleaching (black; n = 25); error bars represent s.d. between different ssDNA molecules.
Source data are available online for this figure.
Rad54 binds tightly to the Rad51 and Dmc1 presynaptic complexes
We next evaluated the stability of GFP‐Rad54 bound to both Rad51‐ and Dmc1‐ssDNA filaments. For these measurements, we incubated GFP‐Rad54 with either Rad51‐ or Dmc1‐ssDNA filaments under saturating conditions, flushed the sample chambers with buffer to remove excess GFP‐Rad54, and then monitored the change in GFP‐Rad54 fluorescent signal over a 1‐h time period (Fig 2G–I). Under these conditions, the loss of GFP‐Rad54 fluorescence signal loss might be attributed to either the dissociation of GFP‐Rad54 or GFP photo‐bleaching. To discriminate between these two possibilities, we calculated the rate of GFP signal loss with and without laser shuttering, as previously described (Gibb et al, 2014a; Ma et al, 2017b). If the rate is the same in both cases, then signal loss can be attributed to photo‐bleaching, and not to GFP‐Rad54 dissociation (Gibb et al, 2014a). In contrast, if the rates are different, then the loss of GFP signal can be attributed to GFP‐Rad54 dissociation. These experiments revealed that the loss of GFP‐Rad54 signal was the same with and without laser shuttering (Fig 2H and I), indicating that the loss of signal intensity could be attributed to photo‐bleaching with little or no GFP‐Rad54 dissociation taking place during the 1‐h observation window. We conclude that GFP‐Rad54 binds very tightly to both Rad51‐ and Dmc1‐ssDNA filaments, with little or no dissociation taking place over our experimental time scales.
Interestingly, previous fluorescence recovery after photo‐bleaching (FRAP) studies of DNA repair foci induced by ionizing radiation have demonstrated that mammalian RAD54 undergoes rapid (t 1/2 = 0.5 s) and complete (100% mobile fraction) turnover at sites of DNA repair, whereas RAD51 does not (Essers et al, 2002). These studies have also shown that mammalian RAD52 undergoes complete turnover, exhibiting a recovery time (t 1/2) of ~26 s (Essers et al, 2002). The result with mammalian RAD54 is different from our in vitro observations with yeast Rad54, which is surprising given the broad conservation of Rad54 among eukaryotes (Heyer et al, 2010; Mazin et al, 2010). One possible explanation for this difference is that the yeast and mammalian proteins behave differently with respect to interactions with the presynaptic complex. To test this possibility, we performed FRAP experiments of recombination protein foci in vivo. We find that most of the Rad51 (~63%) present within recombination foci remains immobile, while the remaining 37 ± 14% undergoes turnover with a recovery time (t 1/2) of 87 (51–284) s (numbers in parentheses represent 95% confidence intervals; Fig EV3A). Consistent with previous results in mammalian cells (Essers et al, 2002), we also find the recombination mediator protein Rad52 undergoes rapid turnover within recombination foci, with 61 ± 18% of the protein present within a mobile fraction exhibiting a recovery time of 6 (4–17) s, but the remaining ~39% of the Rad52 remains immobile (Fig EV3B). Interestingly, 72 ± 28% of Rad54 within the repair foci undergoes turnover with a recovery time of 79 (60–119) s, and the remaining Rad54 remains immobile (Fig EV3C). These findings indicate that a portion of the S. cerevisiae Rad54 present in DNA damage‐induced recombination foci does not undergo turnover, while the remaining Rad54 exchanges at a rate that is ~160 times slower than that observed in mammalian cells. Taken together, our in vitro and in vivo data support a model wherein S. cerevisiae Rad54 may be a more stable component of the Rad51 presynaptic complex than its mammalian homolog.
Figure EV3. Fluorescence recovery after photo‐bleaching of Rad51, Rad52, and Rad54 DNA repair foci.

-
A–CFRAP data for Rad51 (A), Rad52 (B), and Rad54 (C). Cells expressing YFP‐Rad51 (ML1068), Rad52‐YFP (ML191), or Rad54‐YFP (ML1067) were grown in the presence of 200 μg/ml Zeocin to induce DNA repair foci. Cells with two repair foci were subjected to photo‐bleaching of one focus (indicated by dashed red circle) at t = 8 s. Fluorescence recovery was quantified at subsequent time points (n = 6–7 foci for each protein). The recovery half‐time (t 1/2) is indicated with 95% confidence intervals in parentheses. The protein mobile fraction is indicated ±s.d.
Rad54 binding is not dependent on Rad51 or Dmc1 filament integrity
Once Rad54 binds to the Rad51‐ssDNA filament, it is believed to play a role in preventing Rad51 dissociation upon challenge with high‐salt conditions (Mazin et al, 2003). Based on these observations, one logical hypothesis is that Rad51 and Rad54 form a reinforcing loop in which the pair stabilizes each other. We tested this hypothesis by assembling Rad51‐ssDNA filaments, binding GFP‐Rad54, and then depleting ATP to initiate Rad51 dissociation from the ssDNA. We have previously shown that depletion of ATP results in disassembly of Rad51 from the ssDNA curtains (Qi et al, 2015; Qi & Greene, 2016) and the rate of Rad51 dissociation can be inferred by monitoring the re‐binding of GFP‐ or mCherry‐RPA to the ssDNA (Figs 3A and EV4A). This measurement is possible because as the unlabeled Rad51 leaves the ssDNA, it is quickly replaced by fluorescent RPA from solution (Qi et al, 2015; Ma et al, 2017c). Here, we used two‐color measurements to simultaneously monitor GFP‐Rad54 and mCherry‐RPA. In these experiments, depletion of ATP caused Rad51 to dissociate from the ssDNA, and the association rate of mCherry‐RPA was comparable to experiments conducted in the presence or absence of Rad54 (Fig 3A and B). This finding indicates that Rad54 did not stabilize the Rad51 filament upon depletion of ATP. Similar results for Rad51 dissociation were obtained in control experiments using unlabeled Rad54, confirming that the GFP tag on Rad54 did not alter the behavior of Rad51 (Fig EV4A and B). Surprisingly, we found that GFP‐Rad54 dissociated very slowly upon ATP depletion, and the rate of GFP‐Rad54 signal loss was an order of magnitude slower than the loss of Rad51, yielding an apparent k off of 0.037 ± 0.006/min for GFP‐Rad54, compared to an apparent k off of 0.20 ± 0.015/min for Rad51 (Fig 3B, E, and F). These data indicate that the initial recruitment of Rad54 to the presynaptic ssDNA is dependent on the presence of Rad51, but Rad54 can remain bound to the ssDNA even after the disruption of the Rad51 filaments.
Figure 3. Rad54 remains bound to the presynaptic ssDNA after Rad51 or Dmc1 dissociation.
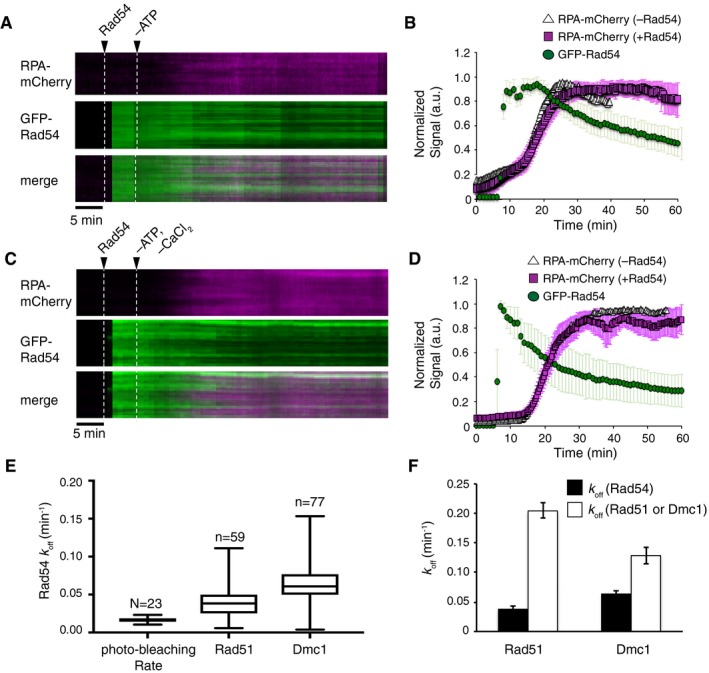
- Kymographs depicting two‐color experiments testing the stability of GFP‐Rad54 (10 nM; green) pre‐bound to the Rad51‐ssDNA filaments upon depletion of ATP in the presence of free RPA‐mCherry (0.1 nM; magenta). The white dashed lines indicate the time points corresponding to the injection of GFP‐Rad54 and removal of ATP, as indicated.
- Quantification of the GFP‐Rad54 signal loss (green circles; n = 59) and the binding of RPA‐mCherry (magenta squares; n = 59) upon ATP depletion from Rad51‐ssDNA. Also shown is the rate of RPA‐mCherry binding to Rad51‐ssDNA filaments upon depletion of ATP for experiments conducted in the absence of GFP‐Rad54 (white triangles; n = 20).
- Kymographs depicting two‐color experiments testing the stability of GFP‐Rad54 (10 nM; green) pre‐bound to the Dmc1‐ssDNA filaments upon depletion of ATP and Ca2+ in the presence of free RPA‐mCherry (0.1 nM; magenta). The white dashed lines indicate the time points corresponding to the injection of GFP‐Rad54 and removal of ATP/Ca2+, as indicated.
- Quantification of the GFP‐Rad54 signal loss (green circles; n = 77) and the binding of RPA‐mCherry (magenta squares; n = 77) upon ATP/Ca2+ depletion from Dmc1‐ssDNA. Also shown is the rate of RPA‐mCherry binding to Dmc1‐ssDNA filaments upon depletion of ATP/Ca2+ for experiments conducted in the absence of GFP‐Rad54 (white triangles; n = 36).
- Box‐and‐whisker plot depicting the distribution of GFP‐Rad54 dissociation rates (k off) calculated for each individual Rad51‐ssDNA filament or Dmc1‐ssDNA filaments, as indicated. The rate of GFP‐Rad54 photo‐bleaching is also shown. The error bars define the min and max rates calculated for each data sets, and the edges and center of the box define the upper quartile, lower quartile, and median of the data set.
- Rad54, Rad51, and Dmc1 dissociation rates (k off) derived by fitting the normalized fluorescence curves in (B and D). The Rad54 dissociation rates are shown in black, and the recombinase (Rad51 or Dmc1, as indicated) dissociation rates are shown in white. Error bars represent the 95% confidence intervals for the data fitting. Rates were calculated from an N of 15 or greater individual ssDNA molecules.
Source data are available online for this figure.
Figure EV4. Rad54 remains bound to ssDNA upon depletion of ATP .
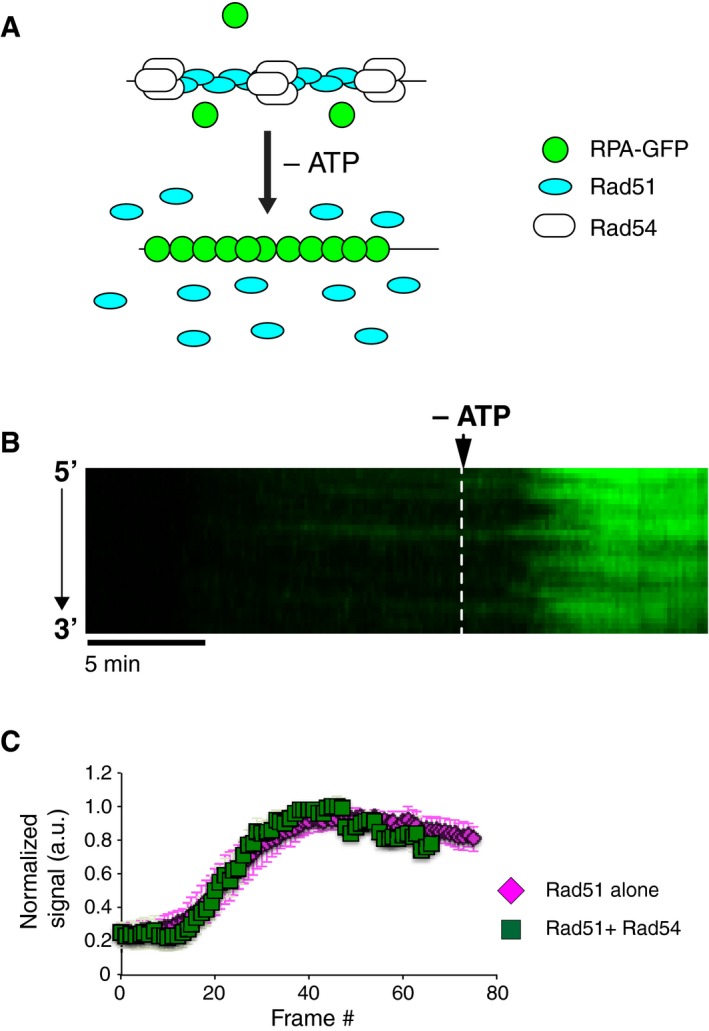
- Diagram outlining the experiment to measure the disassembly of Rad51‐ssDNA filaments bound by Rad54 (unlabeled) upon depletion of ATP by detecting the binding of RPA‐GFP.
- Kymograph depicting the dissociation of Rad51 from ssDNA in the presence of Rad54 (unlabeled) upon depletion of ATP. In this experiment, the loss of Rad51 is revealed as the re‐binding of RPA‐GFP (green).
- Quantification comparing the dissociation rate of Rad51 from ssDNA in the absence (magenta squares) and presence (green squares) of unlabeled Rad54 in ATP depletion experiments. Data collection begins immediately upon depletion of ATP, the Rad51 alone data are reproduced from Fig 3B for comparison, and error bars represent s.d. for individual DNA molecules (N = 25).
We next performed this experiment for Dmc1 filaments bound with Rad54 (Fig 3C and D). In the case of Dmc1, CaCl2 is a necessary cofactor for stable DNA binding (Lee et al, 2005; Busygina et al, 2013), and depletion of ATP alone does not result in filament disassembly in our ssDNA curtain assays (unpublished). Therefore, in order to promote Dmc1 filament disassembly, both ATP and CaCl2 were simultaneously depleted from the buffer. Depletion of both ATP and CaCl2 resulted in dissociation of Dmc1 filaments, which coincided with the re‐binding of mCherry‐RPA, yielding a k off of 0.12 ± 0.01/min, which was comparable to the rate observed for Rad51 filament dissociation upon depletion of ATP (Fig 3D–F). As was the case with Rad51, the rate of Rad54 dissociation from Dmc1 filaments was slower than that of Dmc1 with a k off of just 0.0627 ± 0.005/min (Fig 3D–F). This rate was slightly faster than that observed for Rad54 dissociation from Rad51‐ssDNA filaments. This modest difference in dissociation rates may reflect the reduced number of binding sites observed for Rad54 on Dmc1 filaments or may reflect the existence of an alternative binding mode.
Hed1 binds tightly to the Rad51‐ssDNA presynaptic complex
Hed1 selectively inhibits the association of Rad54 with Rad51 during the early stages of meiosis, thus helping to ensure that meiotic recombination is driven by Dmc1 (Busygina et al, 2008, 2012). However, there is little quantitative understanding of how Hed1 associates with Rad51‐ssDNA and how this association regulates Rad54 binding.
To visualize Hed1 binding, we fused mCherry or GFP to the C‐terminus of Hed1. Hed1‐GFP complements hed1∆ phenotypes in vivo, indicating that the fusion construct retains biological function (Tsubouchi & Roeder, 2006). We first tested the ability of Hed1‐GFP to bind RPA‐ssDNA complexes and found that as with GFP‐Rad54, Hed1‐GFP was unable to bind to RPA‐ssDNA (Fig EV5A). In contrast, Hed1‐mCherry and Hed1‐GFP bound extensively and uniformly to Rad51‐ssDNA filaments (Fig 4A and B). We found no evidence of Hed1‐GFP binding to Dmc1‐ssDNA (Fig 4B), indicating that Hed1 can readily discriminate between the two recombinases, consistent with previous bulk biochemical pull‐down experiments (Busygina et al, 2008). Analysis of Hed1 binding to Rad51‐ssDNA at 0.1, 0.3, 1, 3, 10, and 30 nM Hed1‐GFP concentrations yielded a K d of 7.4 ± 4 nM and a Hill coefficient of 0.96 ± 0.1, indicating that, under our conditions, Hed1 binding was not cooperative (Fig 4C). The images appeared to indicate that Hed1‐GFP bound uniformly along the Rad51‐ssDNA filaments even at low protein concentrations (Fig 4B). This result contrasts with the much more punctate patterns observed for GFP‐Rad54 binding at low protein concentrations (e.g., Fig 1C).
Figure EV5. Stable association of Hed1 with Rad51‐ssDNA filaments.
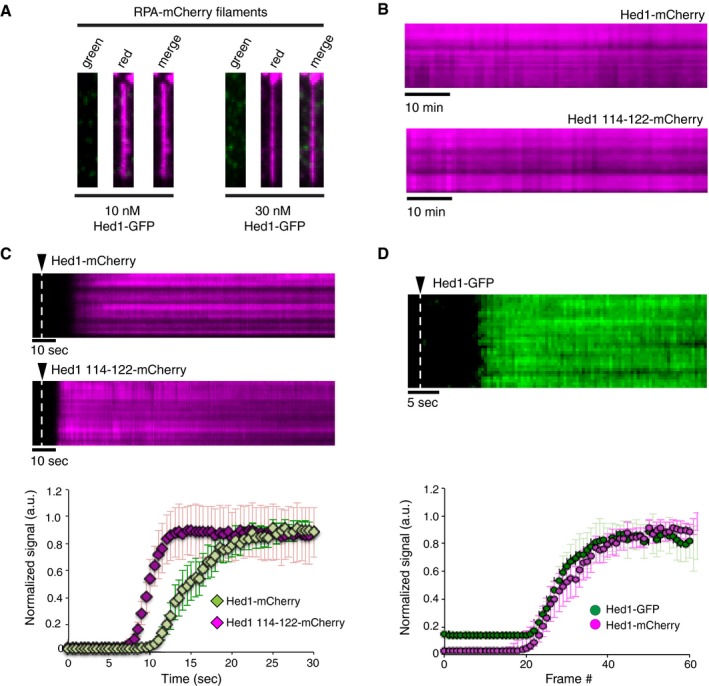
- Wide‐field TIRFM images of single ssDNA molecules bound by RPA‐mCherry (magenta) and in the presence of 10 and 30 nM Hed1‐GFP (green), as indicated.
- Kymographs depicting experiments for measuring Hed1‐mCherry (magenta; top panel) and Hed1∆114‐122‐mCherry (magenta; bottom panel) dissociation from Rad51‐ssDNA (unlabeled) in the presence of 2.5 mM ATP.
- Kymographs depicting the association kinetics of 10 nM Hed1‐mCherry (magenta; top panel) or 10 nM Hed1∆114‐122‐mCherry (magenta; middle panel) to Rad51‐ssDNA. The time points corresponding to the Hed1 injections are indicated (white dashed lines). The corresponding graph (bottom panel) shows quantification of the Hed1 association rate data. The error bars represent the standard deviation between molecules (N = 26 for Hed1‐mCherry and N = 31 Hed1∆114‐122‐mCherry).
- Kymograph showing Hed1‐GFP (green) binding to a Rad51‐ssDNA filament (upper panel). Comparison of association rate data for 10 nM Hed1‐GFP (green circles) and 10 nM Hed1‐mCherry (magenta circles) for binding to Rad51‐ssDNA. The time point corresponding to the Hed1 injection is indicated (white dashed line). Note that the Hed1‐mCherry data are reproduced from Fig 4E for comparison. The error bars represent the standard deviation between individual molecules (N = 26 and N = 15 for Hed1‐GFP and Hed1‐mCherry, respectively).
Figure 4. Hed1 binds tightly to the Rad51 presynaptic complex.
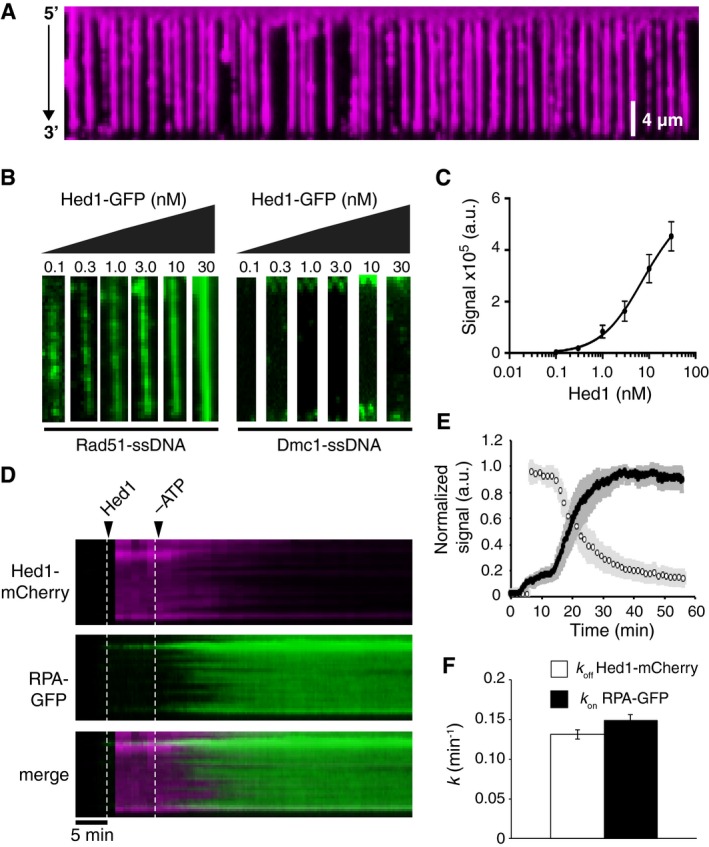
- Wide‐field TIRFM showing Hed1‐mCherry (30 nM; magenta) bound to Rad51‐ssDNA filaments (unlabeled).
- Images of individual Rad51‐ssDNA molecules (left panel) or Dmc1‐ssDNA molecules (right panel) collected in the presence of 0.1, 0.3, 1.0, 3.0, 10, or 30 nM Hed1‐GFP (green).
- Quantification of the equilibrium titration of Hed1‐GFP on Rad51‐ssDNA filaments (n = 15, 20, 20, 24, 22, and 21, respectively). The data were fit by non‐linear regression, and error bars represent the s.d. of single Rad51‐ssDNA molecules.
- Kymographs depicting two‐color experiments to monitor the behavior of Hed1‐mCherry (magenta) pre‐bound to Rad51‐ssDNA upon the depletion of ATP. The dissociation of Rad51 from the ssDNA was monitored using GFP‐RPA (0.1 nM; green).
- Quantification of normalized Hed1‐mCherry dissociation rate (open circles) and RPA‐GFP association (dark circles). Error bars represent the s.d. between individual molecules (N = 24).
- Hed1‐mCherry and Rad51 dissociation rates derived by fitting the data in (E). Error bars represent the 95% confidence interval for the fit data.
Source data are available online for this figure.
We monitored the dissociation of Hed1 and Hed1∆114‐122 from the Rad51‐ssDNA. This Hed1∆114‐122 mutant shows a severe reduction in affinity for ssDNA (Busygina et al, 2008, 2012) and can thus be used in our assays to help distinguish between Hed1 association with the Rad51 presynaptic filament through either protein–protein interactions with Rad51 or Hed1‐ssDNA interactions. These experiments revealed that in the presence of ATP, as with Rad54, the rate of Hed1 or Hed1∆114‐122 signal loss was equivalent to the photo‐bleaching rate (Fig EV5B). Therefore, the binding lifetimes of Hed1 and Hed1∆114‐122 exceeded the 1‐h time windows of our measurements. We next monitored the real‐time association of Hed1‐mCherry with the Rad51‐ssDNA filaments. For comparison, we also generated a mutant version of Hed1 in which amino acids 114‐122 had been removed. These measurements revealed that Hed1‐mCherry bound quickly (k on = 4.3 × 10⁶/M/s) along the Rad51‐ssDNA filaments (Fig EV5C) and that there was no difference in the association when using GFP‐ or mCherry‐tagged versions of Hed1 (Fig EV5C). Surprisingly, Hed1∆114‐122 bound to the Rad51‐ssDNA filaments ~fourfold more rapidly that full‐length Hed1 (k on = 17.6 × 10⁶/M/s; Fig EV5C). However, we found no significant difference between the saturation levels for full‐length Hed1 and Hed1∆114‐122 to Rad51‐ssDNA (not shown). We conclude that Hed1 binds tightly and uniformly to the Rad51‐ssDNA filaments and that deletion of Hed1 amino acids 114‐122 does not reduce binding to the presynaptic filament, but instead increases the rate of association.
Hed1 binding stability is Rad51‐dependent
As shown above, once bound to the presynaptic complex, Rad54 could remain bound even after Rad51 filament disassembly. We considered that Hed1 might share this property because Hed1 can bind to ssDNA, and because Hed1 acts primarily as an antagonist of Rad54. We tested this model by first binding Hed1‐mCherry to Rad51‐ssDNA filaments in buffer containing GFP‐RPA. After a 10‐min incubation, ATP was depleted from the buffer, and the stability of the bound Hed1‐mCherry and association of GFP‐RPA were measured simultaneously. We found that both Rad51 and Hed1 dissociated from the ssDNA after ATP depletion, and the rate of Rad51 dissociation was the same in the presence or absence of Hed1 (Fig 4D–F). Comparison of the Hed1 and the Rad51 off rates (k off) yielded similar values, 0.13 ± 0.02/min and 0.15 ± 0.01/min, respectively (Fig 4F). These data indicate that unlike Rad54, Hed1 stability on the Rad51 filament is entirely dependent upon the integrity of the Rad51‐ssDNA filaments.
Competition between Hed1 and Rad54 dictates functionality of the presynaptic complex
Once bound to the Rad51 presynaptic complex, neither Rad54 nor Hed1 dissociates from the Rad51‐ssDNA over the course of our measurements. These findings support the hypothesis that kinetic competition between Hed1 and Rad54 will dictate the functional identity of the developing presynaptic complex during meiosis.
To explore this concept further, we first tested the ability of Hed1 to inhibit binding of Rad54 when both proteins were present in solution. We did this by co‐injecting saturating amounts of GFP‐Rad54 (30 nM) together with either 0, 0.3, 3, 30, 90, or 300 nM unlabeled (wild type) Hed1. We then measured the integrated signal intensity of GFP‐Rad54 on individual ssDNA strands under each condition. As Hed1 increased, the amount of GFP‐Rad54 binding decreased (Fig 5A), with ~50% of GFP‐Rad54 binding inhibited at equimolar amounts of Hed1 to Rad54. Fitting these data to a dose–response curve yielded an IC50 of 14.4 ± 7 nM, and from this, we calculated the K i of Hed1 to be 5 ± 3 nM (Fig EV6A and B). This value is within error of the K d calculated for Hed1‐GFP and is in agreement with Hed1 acting as a competitive inhibitor of Rad54 binding. Additionally, as the Hed1 concentration increased, the Rad54 binding events reverted from more uniform fluorescence signal to highly punctate structures, similar to those observed at low GFP‐Rad54 concentrations in the absence of Hed1 (e.g. Figs 1C and 5A).
Figure 5. Hed1‐mediated inhibition of Rad54 binding to Rad51‐ssDNA filaments.
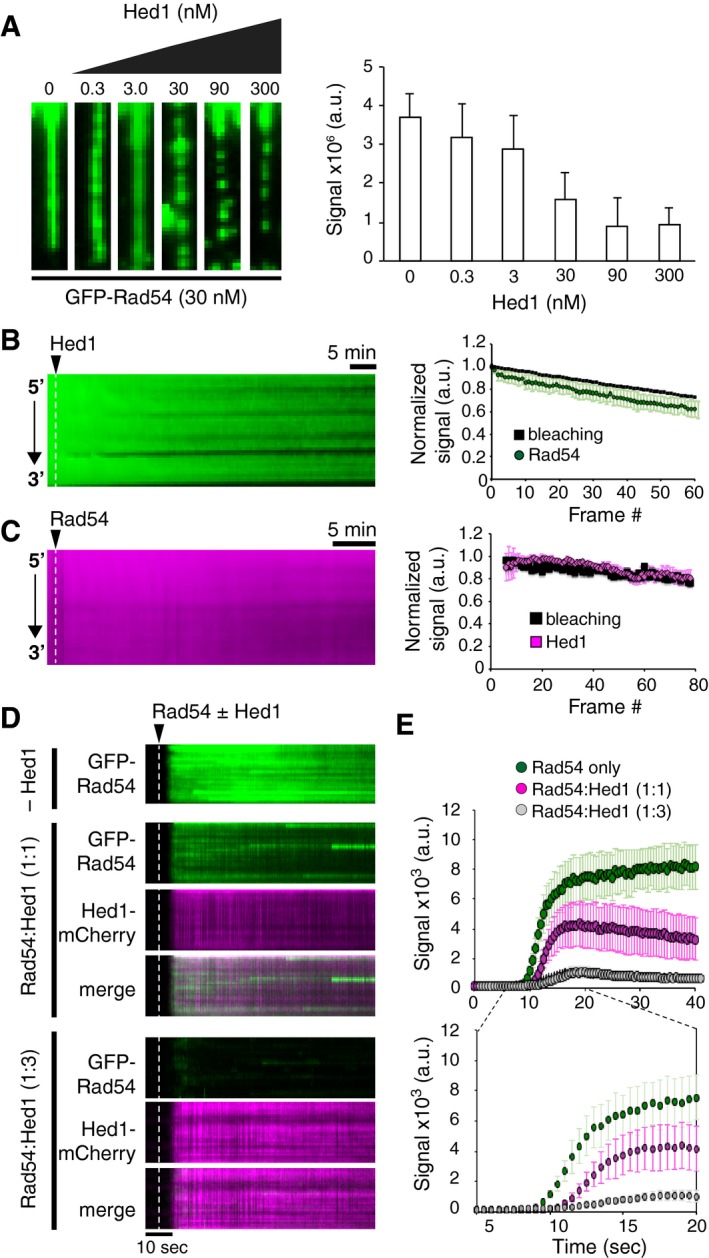
- Wide‐field images of single Rad51‐ssDNA molecules (unlabeled) after co‐incubation with 30 nM GFP‐Rad54 (green) and 0, 0.3, 3.0, 30, 90, or 300 nM unlabeled, wild‐type Hed1 (left panel). Quantification of the integrated signal intensities for individual Rad51‐ssDNA molecules bound by GFP‐Rad54 in the presence of varying concentrations of Hed1 (right panel). Error bars represent s.d. at each indicated Hed1 concentration: 0 mM (n = 30); 0.3 mM (n = 30); 3 mM (n = 30); 30 mM (n = 30); 90 mM (n = 30); and 300 mM (n = 30).
- Kymograph (left panel) and quantification (right panel) of experiment used to determine whether injection of free Hed1 (unlabeled) could disrupt GFP‐Rad54 (green) pre‐bound to Rad51‐ssDNA filaments. The dissociation rate (green circles; n = 25) and photo‐bleaching rate of GFP‐Rad54 (black squares; n = 40) were determined as described in Fig 2H (Gibb et al, 2014a); error bars represent s.d. between different ssDNA molecules.
- Kymograph (left panel) and quantification (right panel) of experiment used to determine whether injection of free Rad54 (unlabeled) could disrupt Hed1‐mCherry (magenta) pre‐bound to Rad51‐ssDNA filaments. The dissociation rate (magenta squares; n = 25) and photo‐bleaching rate of Hed1‐mCherry (black squares; n = 20) were determined as described in Fig 2H (Gibb et al, 2014a); error bars represent s.d. between different ssDNA molecules.
- Kymographs depicting the association of GFP‐Rad54 (green) in direct competition for Rad51‐ssDNA binding with Hed1‐mCherry (magenta). Data were collected in the absence of Hed1‐mCherry, or at 1:1 and 1:3 ratios of GFP‐Rad54 to Hed1‐mCherry, as indicated. The dotted dashed lines represent the injection point for GFP‐Rad54 with or without Hed1‐mCherry.
- Quantitation of GFP‐Rad54 signal intensity in the absence of Hed1‐mCherry (green circles; n = 20; note that these data are reproduced from Fig 2 for comparison), at a 1:1 Rad54/Hed1 molar ratio (magenta circles; n = 40) and at a 1:3 Rad54/Hed1 molar ratio (gray circles; n = 35), as indicated. Also shown is an expanded scale of quantification from (B) to illustrate significance of difference at early time points. The error bars represent the standard deviation between individual molecules.
Source data are available online for this figure.
Figure EV6. Hed1 acts as a competitive inhibitor of Rad54 binding.
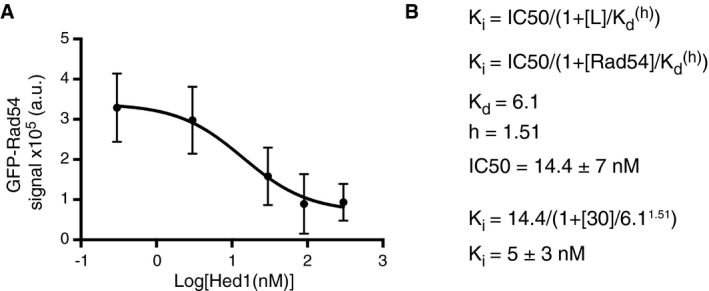
- Data from Fig 5 fit by non‐linear regression. The error bars represent s.d. between individual ssDNA molecules (N = 30 for each titration point).
- Calculation of K i for Hed1 and Rad54.
We next evaluated the ability to free Hed1 to remove pre‐bound Rad54 from Rad51‐ssDNA filaments, and we also performed the reciprocal experiment to determine whether free Rad54 was able to remove pre‐bound Hed1. Saturating amounts (30 nM) of either GFP‐Rad54 (Fig 5B) or Hed1‐mCherry (Fig 5C) were bound to Rad51‐ssDNA filaments, and the unbound proteins were then flushed from the flow cell. The samples were then chased with either 30 nM unlabeled Hed1 (Fig 5B) or 30 nM unlabeled Rad54 (Fig 5C) while monitoring the signal intensity of the pre‐bound proteins. In both cases, addition of the unlabeled protein was unable to promote dissociation of the pre‐bound fluorescent proteins from the Rad51‐ssDNA filaments, and any observed signal loss was instead comparable to the photo‐bleaching rate (Fig 5B and C).
Next, we directly visualized the competition between Rad54 and Hed1 for Rad51‐ssDNA by co‐injecting and directly visualizing both Hed1‐mCherry and GFP‐Rad54 in real time at 0:1, 1:1, and 3:1 molar ratios of Hed1‐mCherry to GFP‐Rad54 (Fig 5D and E). Quantifying the intensity values for GFP‐Rad54 association indicates a marked reduction in Rad54 binding with a ~twofold reduction in saturation values when Rad54 and Hed1 are present at equal molar concentrations, and an ~8‐ to 10‐fold reduction when Hed1 is present at a threefold molar excess over Rad54 (Fig 5E). Taken together, these experiments all support the conclusion that Hed1 and Rad54 are in direct kinetic competition for binding to the Rad51‐ssDNA filaments and the first of these two proteins to bind remains refractory to displacement by proteins in free solution.
Hed1 ssDNA‐binding activity is required to prevent Rad54 binding
Hed1∆114‐122 can bind tightly to Rad51‐ssDNA, but is unable to prevent Rad54 stimulation of strand invasion (Busygina et al, 2012; Fig EV5C). Therefore, we tested the ability of Hed1∆114‐122 to prevent Rad54 binding to the Rad51‐ssDNA filaments. We co‐injected GFP‐Rad54 and Hed1∆114‐122‐mCherry at a 1:3 molar ratio, respectively, and monitored the association of both proteins with the Rad51‐ssDNA filaments. As indicated above, Hed1∆114‐122 binds to the Rad51‐ssDNA filaments much more rapidly than full‐length Hed1. However, this Hed1 mutant was not able to prevent GFP‐Rad54 association with the Rad51‐ssDNA filaments (Fig 6A and B). Quantification of the GFP‐Rad54 saturation levels revealed an insignificant difference in Rad54 binding for experiments conducted in the presence and absence of Hed1∆114‐122 (Fig 6B). This result stands in striking contrast to the ~8‐ to 10‐fold reduction in GFP‐Rad54 binding observed in the case of the full‐length Hed1 (Fig 6B). We conclude that amino acids 114‐122 of Hed1 are essential to prevent association of Rad54 with the Rad51‐ssDNA filaments, as previously demonstrated (Busygina et al, 2012).
Figure 6. Hed1 ssDNA‐binding activity is required to prevent Rad54 from interacting with Rad51‐ssDNA filaments.
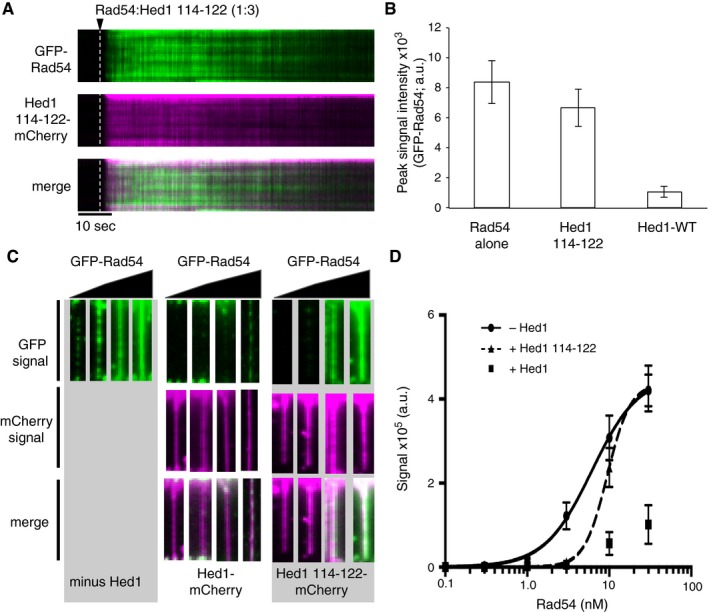
- Kymographs depicting competition between Rad54 (green) and Hed1∆114‐122‐mCherry (magenta) for binding to Rad51‐ssDNA filaments at 1:3 molar ratios of Rad54 to Hed1∆114‐122. The white dashed lines represent the point of Rad54/Hed1(∆114‐122) injection.
- Graph depicting mean peak signal saturation intensities GFP‐Rad54, Hed1∆114‐122‐mCherry, and Hed1‐mCherry, as indicated. Error bars indicate s.d. between DNA molecules (Rad54 alone, N = 20; Hed1∆114‐122, N = 32; Hed1‐WT, N = 35).
- Wide‐field images of single Rad51‐ssDNA molecules in the presence of 1.0, 3.0, 10, and 30 nM GFP‐Rad54 (green) and either minus Hed1, or 30 nM Hed1‐mCherry or Hed1∆114‐122‐mCherry (magenta), as indicated.
- Quantification of integrated GFP signal intensities for Rad51‐ssDNA molecules bound by GFP‐Rad54. Plotted data were fit using non‐linear regression, and error bars represent s.d. between individual DNA molecules (Rad54, N = 60; Hed1‐WT, N = 41; Hed1∆114‐122, N = 40). Note, we were unable to fit the GFP‐Rad54 binding data for experiments with Hed1‐mCherry, because Rad54 binding to the Rad51‐ssDNA was minimal over the concentration range of the titration.
Source data are available online for this figure.
We next evaluated whether pre‐bound Hed1∆114‐122 could affect GFP‐Rad54 association with the Rad51‐ssDNA filaments. To test this, we bound either unlabeled Hed1 or Hed1∆114‐122 to the Rad51 filaments under saturating conditions and then titrated in increasing concentrations of GFP‐Rad54. As expected, Hed1 inhibited Rad54 binding at all concentrations tested (Fig 6C and D). In contrast, Hed1∆114‐122 failed to strongly inhibit binding at the highest concentrations of GFP‐Rad54 (Fig 6C and D). Interestingly, Hed1∆114‐122 did inhibit GFP‐Rad54 binding at lower concentrations of GFP‐Rad54 (Fig 6C and D). Non‐linear regression analysis of the data revealed that Hed1∆114‐122 resulted in a small shift in the K d for GFP‐Rad54 binding to Rad51‐ssDNA from 6.1 ± 0.73 nM in the absence of Hed1∆114‐122 to 9.3 ± 0.6 nM in the presence of Hed1∆114‐122 (Fig 6D). This shift also coincided with a twofold increase in the Hill coefficient for Rad54 binding to the Rad51‐ssDNA from 1.51 to 3.1. This finding suggests that Rad54 may interact with multiple surfaces within the presynaptic complex, and binding sites that dominate at low protein concentrations can be inhibited by Hed1∆114‐122, whereas Rad54 binding at higher concentrations cannot be inhibited by Hed1∆114‐122.
Discussion
Here, we have directly visualized interactions between key recombination proteins that help define the functional identity of the presynaptic complex during the transition from mitotic DSB repair to the meiotic DSB repair. Our findings yield insights into how Hed1 and Rad54 interact with the presynaptic complex, and help establish a conceptual framework for understanding how the activities of the presynaptic complex are regulated during entry into meiosis.
RPA enforces order of assembly
RPA is an essential ssDNA‐protein that is among the first proteins to colocalize with a DSB (Wold, 1997; Chen & Wold, 2014). During HR, RPA is typically considered to protect the 3′ ssDNA overhang that is generated during DNA‐end processing, and RPA is also necessary to help eliminate secondary structure so that Rad51 can form filaments on the ssDNA (Wold, 1997; Chen & Wold, 2014). Our results show that RPA also prevents premature association of Rad54 and Hed1 with ssDNA. This result was not necessarily a foregone conclusion, since both Rad54 and Hed1 have ssDNA‐binding domains and both can bind ssDNA in the absence of RPA (Busygina et al, 2012; Wright & Heyer, 2014), and RPA is capable of undergoing facilitated exchange between free and bound states when high concentrations of free RPA are present in solution (Gibb et al, 2014a; Ma et al, 2017a). Thus, our findings imply that RPA plays a role in actively suppressing Rad54 and Hed1 association with ssDNA and may imply a broader role for RPA in preventing inappropriate interactions of other HR proteins prior to the binding of Rad51. The conclusion that RPA prevents Rad54 from binding to ssDNA in our assays is also consistent with in vivo observations that Rad54 is not recruited to DSBs in the absence of Rad51 (Wolner et al, 2003; Lisby et al, 2004).
Rad54 interacts tightly with the presynaptic complex
Our in vitro ssDNA curtain studies and in vivo FRAP measurements suggest that S. cerevisiae Rad54 is a stable component of the presynaptic complex. Interestingly, our FRAP experiments reveal two populations of Rad54: one population that remains stably associated with DNA repair foci and does not exhibit turnover on the time scales of our measurements and a second population that undergoes slow turnover. In contrast, our in vitro studies only identify a single population of Rad54, which does not undergo turnover. We conclude that the Rad54 observed in the ssDNA curtain measurements most likely reflects the immobile population of protein observed in the FRAP studies. Future work will be necessary to fully understand why a portion of the protein undergoes slow turnover in vivo but not in vitro, but it is likely that there are multiple populations of Rad54 in vivo the sources of which may include, (i) the effects of other HR protein factors that may compete for binding or promote Rad54 turnover, (ii) the existence of posttranslational modifications of Rad54 that affect binding, or (iii) protein turnover that takes place during or after the homology search and strand exchange. Consistent with this later point, wild‐type mammalian RAD54 undergoes complete turnover within recombination in vivo (Essers et al, 2002), but up to ~10% of the RAD54 remains immobile for ATP hydrolysis‐deficient RAD54 mutants (Agarwal et al, 2011). Therefore, in vivo turnover of RAD54 bound to the presynaptic complex may require productive interactions with dsDNA, such as during the homology search and strand invasion reactions. ATP hydrolysis‐deficient RAD54 mutants would not be expected to undergo these processes, thus hindering their turnover within recombination foci (Agarwal et al, 2011). Our assays do not yet incorporate dsDNA substrates, so it is possible that addition of the dsDNA to the Rad54‐bound presynaptic complexes may stimulate Rad54 turnover in our assays.
Interestingly, Rad54 remains associated with the presynaptic ssDNA in vitro, even when most or all of the Rad51 (or Dmc1) dissociates. The finding that Rad54 can remain bound longer than Rad51 has several interesting implications. First, since Rad54 does not dissociate from the ssDNA even upon loss of Rad51, it seems likely that its removal from ssDNA in vivo may require the action of specialized enzymes. Alternatively, Rad54 may more readily dissociate from the dsDNA products generated during strand invasion. Second, this finding also suggests that Rad54 binds directly to the presynaptic ssDNA, even though its initial recruitment is dependent upon the presence of Rad51 or Dmc1. Finally, the ability of Rad54 to remain bound to ssDNA upon dissociation of Rad51 may be important for the ability of Rad54 to promote extension of the invading 3′ end (Sugawara et al, 2003; Wolner et al, 2003; Li et al, 2009).
From a structural perspective, it is difficult to envision that Rad54 and Rad51 (or Dmc1) could co‐occupy the same nucleotides within the ssDNA because the recombinase is expected to be in such intimate contact with the nucleic acids (Conway et al, 2004; Chen et al, 2008; Sheridan et al, 2008; Xu et al, 2017). In addition, the binding characteristics (i.e., K d and k off) for Rad54 interactions with Rad51‐ssDNA and Dmc1‐ssDNA are remarkably similar, with one notable exception: The saturation level for Rad54 association with Dmc1‐ssDNA is ~50% lower than the saturation level observed for Rad54 binding to Rad51 filaments. Thus, mechanistic models describing the association of Rad54 with the presynaptic complex must invoke its ability to interact with the presynaptic ssDNA, be consistent with the structures of recombinase filaments, and should also accommodate for differences in saturation levels between binding to Dmc1 and Rad51. Importantly, previous studies have shown that human RAD54 can associate with RAD51‐ssDNA filaments through multiple modes, the most predominant of which appeared to be RAD54 proteins interspersed throughout the RAD51 filaments, suggesting that RAD54 may bind to small gaps within the filaments (van der Heijden et al, 2007; Sanchez et al, 2013; Fig 7A). This model is consistent with all of our observations for S. cerevisiae Rad54, and extension of this model might suggest that there are fewer gaps present in Dmc1 filaments relative to Rad51 filaments, thus accounting for the differences in Rad54 saturation levels for the two recombinases. This latter point is also consistent with the finding that Dmc1 filament assembly is more cooperative compared to Rad51 (unpublished). Importantly, any ssDNA gaps that are bound by Rad54 must be small enough that they cannot accommodate RPA; otherwise, the bound RPA might inhibit association of Rad54.
Figure 7. Model for kinetic completion between Rad54 and Hed1 as a mechanism for defining presynaptic filament identity.
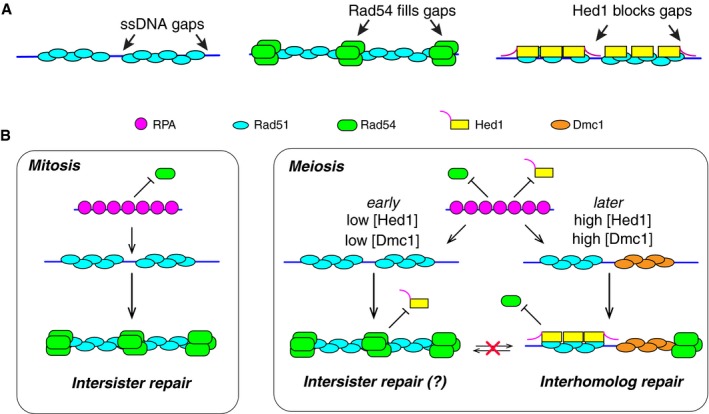
- Cartoon diagram depicting proposed models for Rad54 or Hed1 binding to the Rad51 presynaptic complex. We propose that Rad54 binds to small regions of exposed ssDNA present between Rad51 filaments. This model postulates that while initial recruitment to the filament is dependent on Rad51, stable association of Rad54 with the presynaptic complex is mediated primarily through Rad54 interactions with the ssDNA. In contrast, Hed1 associates directly with Rad51 and does not require stable interactions with the underlying ssDNA for binding stability. Hed1 prevents Rad54 association by blocking access to the small ssDNA gaps present at the ends of the Rad51 filaments, and this inhibition requires the ssDNA‐binding amino acids within Hed1.
- Cartoon diagram showing the differences between mitotic and meiotic presynaptic complexes and also depicting that transition from mitotic presynaptic filaments to meiotic presynaptic filaments is controlled by a kinetic competition between Rad54 and Hed1 that is ultimately related to the relative abundance of each protein. During meiosis, Rad54 will bind to the Rad51 presynaptic complexes when Hed1 abundance is low, whereas Rad54 will be blocked from interacting with Rad51 presynaptic complexes when Hed1 abundance is high. Once assembled, transitions between the two types of complexes will only take place if the proteins are actively removed from the ssDNA. Additional details are presented in the main text.
Hed1 interacts tightly with the Rad51 presynaptic complex
Genetic and biochemical studies have shown that Hed1 interacts with Rad51 and inhibits strand exchange activity by preventing Rad54 from associating with the presynaptic complex (Tsubouchi & Roeder, 2006; Busygina et al, 2008, 2012; Callender et al, 2016). Here, we have expanded our understanding of Hed1‐mediated regulation by establishing quantitative measures of its interactions with the presynaptic complex, which have led to a model for kinetic competition between Hed1 and Rad54. Our observations have several important implications for understanding how Hed1 associates with the Rad51 presynaptic complex, and for the mechanism of Hed1‐mediated inhibition of Rad54. We show that Hed1 has a high affinity for Rad51‐ssDNA filaments, and once bound, the off rate of Hed1 is extremely slow, and binding is essentially irreversible under our conditions so long as the Rad51 remains intact. Hed1 does not alter the stability of Rad51 in our ATP depletion assays, and Hed1 dissociation coincides with Rad51 filament disassembly upon depletion of ATP. This finding is different from what is observed in bulk biochemical assays (Busygina et al, 2012), and we speculate that two experimental details may contribute to this difference, namely our use of long ssDNA substrates, which we anticipate will yield more stable filaments than those assembled on short oligonucleotides, and our use of a microfluidic system, which allows for rapid and complete depletion of free ATP from the buffer. Therefore, in contrast to Rad54, Hed1 requires the continued presence of Rad51 to remain bound to the presynaptic filament, indicating that the binding and dissociation of these two HR factors occur through different mechanisms. Furthermore, the finding that Hed1 discriminates completely between Rad51 and Dmc1, whereas Rad54 does not, also indicates that the Hed1 binding mechanism likely involves direct protein–protein contacts with Rad51‐specific amino acids, which we anticipate would be absent from Dmc1. Interestingly, the Hed1 amino acids required for ssDNA binding are not required for interactions with Rad51‐ssDNA; indeed, Hed1∆114‐122 associates more rapidly with Rad51‐ssDNA compared to full‐length Hed1. However, Hed1∆114‐122 does not inhibit Rad54 binding. Instead, Hed1∆114‐122 and Rad54 can bind simultaneously to the Rad51‐ssDNA presynaptic complex.
Taken together, these data are consistent with a model in which Hed1 and Rad54 occupy different, but possibly overlapping, binding sites within the Rad51 presynaptic complex (Fig 7A). As indicated above, our data support a model in which Rad54 binds to exposed ssDNA between adjacent Rad51 filaments bound to the same ssDNA. Hed1 cannot be bound exclusively to the same gaps; otherwise, the ssDNA‐binding‐deficient mutant Hed1∆114‐122 would not be able to co‐occupy the Rad51 presynaptic complexes with Rad54. Instead, our data suggest that Hed1 binds the presynaptic complex through protein–protein interactions with Rad51. We proposed that mechanistically, Hed1 binds to Rad51 and then shields any exposed ssDNA at the ends of the Rad51 filaments, which in turn prevents association of Rad54 with the presynaptic complex (Fig 7A). Interestingly, while Rad54 is not believed to function with Dmc1 during the initial phases of crossover formation in vivo, both Rad54 and Rdh54 contribute to crossover interference (Shinohara et al, 2003). Our findings also suggest the possibility that Hed1 may enable Rad54 to partition away from Rad51 and onto Dmc1 filaments. In this case, Rad54 may begin to compete with Rdh54 for binding interactions with Dmc1, or both Rdh54 and Rad54 may bind Dmc1, and these interactions may help regulate downstream steps in meiotic recombination.
Transition from mitotic to meiotic presynaptic filaments
The transition from a mitotic recombination to meiotic recombination coincides with a change in template bias from the sister chromatid during mitosis to the homolog during meiosis. Homolog bias helps ensure crossover formation, which is central feature of meiotic recombination; however, the mechanism that enforces homolog bias during meiosis remains poorly understood (Neale & Keeney, 2006; Lao & Hunter, 2010; Brown & Bishop, 2014; Lam & Keeney, 2014). This transition also coincides with a change in the recombinase responsible for catalyzing strand invasion (Neale & Keeney, 2006; Brown & Bishop, 2014). Rad51 is the only recombinase that is present during mitotic growth, and during normal mitotic DSB repair, Rad51 interacts with Rad54, and this interaction is essential for completion of repair (Heyer et al, 2010; San Filippo et al, 2008; Fig 7B). Thus, the resulting presynaptic complexes will have a functional identity that is defined by Rad51 together with its associated cofactors. Dmc1 is expressed upon entry into meiosis, and both Rad51 and Dmc1 are required for efficient meiotic recombination (Bishop et al, 1992; Brown & Bishop, 2014). However, Rad51 is required for assembly of Dmc1 foci, but Rad51 strand invasion activity is not required for interhomolog recombination during meiosis (Bishop et al, 1992; Bishop, 1994; Cloud et al, 2012). Instead, Dmc1 is the recombinase required for strand exchange during meiosis, whereas Rad51 activity is actively suppressed by Hed1, which prevents Rad54 from associating with Rad51 (Busygina et al, 2008; Liu et al, 2014). Thus, the functional identity of the meiotic presynaptic complex can be characterized by Dmc1 together with its auxiliary cofactors.
A remaining problem is to address how the transition from mitotic to meiotic presynaptic complexes takes place. Our data suggest that the mechanism underlying this transition is kinetic competition between Rad54 and Hed1 for binding interactions with Rad51 (Fig 7B). In support of this model, we find that Rad54 and Hed1 binding interactions are mutually exclusive, and once established, these binding interactions are effectively irreversible over the time scales that might be relevant to meiotic progression (Fig 7B). So, the first of these two proteins, either Rad54 or Hed1, to engage the presynaptic complex will dictate its functional identity as “mitotic‐like” (i.e., with strand exchange driven by Rad51) or “meiotic‐like” (i.e., with strand exchange driven by Dmc1), and once the functional identity of the presynaptic complex is established, then this identity may be maintained until the complexes complete strand invasion or until the complexes are actively dismantled. Interestingly, Rad51 plays a late role in meiotic prophase by repairing residual DSBs after disassembly of the synaptonemal complex (Argunhan et al, 2017; Prugar et al, 2017). Reactivation of Rad51 coincides with inactivation of Mek1, and as a result, Rad54 phosphorylation and Hed1 phosphorylation are lost, and Hed1 is degraded (Callender et al, 2016; Argunhan et al, 2017; Prugar et al, 2017). These observations suggest that reversion of the meiotic‐like presynaptic complex to a mitotic‐like presynaptic complex may require the active removal and proteolytic degradation of Hed1.
Materials and Methods
Protein purification
Saccharomyces cerevisiae RPA, GFP‐RPA, and mCherry‐RPA were purified as previously described (Gibb et al, 2014a). Rad51 and Dmc1 were purified as previously described (Sung & Stratton, 1996; Busygina et al, 2013). GST‐Rad54 and GST‐GFP‐Rad54 were purified as previously described (Solinger et al, 2001). GST‐Hed1‐6xHis‐mCherry, GST‐Hed1‐6xHis, and GST‐Hed1‐6xHis‐GFP were purified as follows. pGEX plasmids were transformed into Escherichia coli Rosetta (DE3) cells (Novagen). Cells were grown to an OD of 0.6–0.8 at 37°C, and cultures were then shifted to 16°C and induced overnight with 0.1 mM IPTG. After overnight expression, cells were harvested and re‐suspended in 20 ml/l cell lysis buffer (50 mM Tris–Cl [pH 7.5], 700 mM KCl, 1 mM EDTA, 10 mM βME, protease inhibitor cocktail (Roche, Cat. No. 05892988001), 10% glycerol, and 1 mM PMSF). Cells were lysed with lysozyme and sonicated. The lysate was clarified by ultracentrifugation for 45 min at 142,000 g. Clarified extract was incubated in batch with glutathione resin (GE Healthcare, Cat. No. 17‐0756‐01) for 1 h at 4°C. After 1 h, the supernatant was removed and the resin washed with 2 × 10 column volumes (CV) with buffer K1000 [20 mM Tris–Cl (pH 7.5), 1 M KCl, 10 mM βME, 1 mM PMSF, 10% glycerol, 2.5 mM imidazole]. Resin was then washed with buffer K300 [20 mM Tris–Cl (pH 7.5), 0.3 M KCl, 10 mM βME, 1 mM PMSF, 10% glycerol, 2.5 mM imidazole]. Protein was eluted with buffer K300 + 25 mM glutathione. Peak fractions were bound to cOmplete Nickel Resin (Roche, Cat. No. 05893682001) for 1 h at 4°C. Resin was then washed 2 × 5 CV of buffer K1000, followed washing with 2 × 5 CV of buffer K300. Protein was then eluted with buffer K300 plus 100 mM imidazole. Peak fractions were pooled and dialyzed against buffer K 150 [20 mM Tris–Cl (pH 7.5), 150 mM KCl, 10 mM βME, 1 mM PMSF, 10% glycerol]. Proteins were quantified by absorbance at 280 nm, and in the case of GFP and mCherry, protein concentrations were quantified by measuring the absorbance of the chromophores at 488 nM (ε488 nm = 55,000/cm/M) or 587 nm (ε587 nm = 72,000/cm/M), respectively. Samples were flash‐frozen and stored at −80°C.
TIRF microscopy experiments
All experiments were conducted with a custom‐built prism‐type total internal reflection fluorescence (TIRF) microscope (Nikon) equipped with 488‐nm laser (Coherent Sapphire, 200 mW) and a 561‐nm laser (Coherent Sapphire, 200 mW; Ma et al, 2017c). For two‐color experiments, all GFP and mCherry images were collected with two Andor iXON X3 EMCCDs using 100‐ms integration time, and we used 500‐ms alternating shuttering of the excitation lasers to prevent spectral overlap between GFP and mCherry channels.
Flow cell construction
Slides were constructed by deposition of chrome barriers on quartz microscope slides via e‐beam lithography and thermal evaporation, as previously described (Qi & Greene, 2016; Ma et al, 2017c). Lipid bilayers were prepared with 91.5% DOPC (1,2‐dioleoyl‐sn‐glycero‐3‐phosphocholine), 0.5% biotinylated‐PE (1,2‐dioleoyl‐sn‐glycero‐3‐phosphoethanolamine‐N‐(cap biotinyl), and 8% mPEG 2000‐DOPE (1,2‐dioleoyl‐sn‐glycero‐3‐phosphoethanoloamine‐N‐[methoxy(polyethylenegycol)‐2000] (Avanti Polar Lipids, Inc., Cat. No. 850375P, 870273P, and 880130P, respectively). Bilayers were prepared in flow cells through sequential deposition of a lipid master mix in lipid buffer [20 mM Tris–Cl (pH 7.5), 100 mM NaCl]. After blocking the surface with BSA containing buffer, streptavidin was deposited on the flow cell surface. ssDNA was generated by rolling circle replication using phi29 DNA polymerase with a biotinylated primer annealed to M13 circular single‐stranded DNA as a template (Gibb et al, 2014b; Qi et al, 2015; Ma et al, 2017c). The ssDNA substrate was deposited on the streptavidin containing bilayer, and the flow cell attached to the microfluidic system, as described (Gibb et al, 2014b; Qi et al, 2015; Qi & Greene, 2016; Ma et al, 2017c).
Rad51 filament formation
The ssDNA molecules were aligned at a flow rate of 0.5 ml/min in HR buffer plus RPA [30 mM Tris–OAc (pH 7.5), 50 mM KCl, 20 mM MgCl2, 0.2 mg/ml BSA, 1 mM DTT, 0.1 nM RPA]. Once ssDNA molecules were aligned, the flow rate was adjusted to 1.0 ml/min and 0.5 ml of 7 M urea was injected into the flow cell to further extend the ssDNA (Gibb et al, 2014a; Qi & Greene, 2016). HR buffer plus RPA was then flushed through the sample chamber at 1.0 ml/min for an additional 10 min. The sample chamber was then flushed with HR buffer +ATP [30 mM Tris–OAc (pH 7.5), 50 mM KCl, 20 mM MgCl2, 0.2 mg/ml BSA, 1 mM DTT, 2.5 mM ATP] at 1.0 ml/min for 3 min. Rad51 (1 μM) was injected into the flow cell, flow was stopped, and the reactions were incubated at 30°C for 15 min. When GFP‐ or mCherry‐tagged RPA was used, the Rad51 filament assembly was monitored with the appropriate laser at an image acquisition rate of 3 frames/min. After 15 min, free Rad51 was removed with HR buffer plus ATP. Protein binding experiments with Rad54 and Hed1 were conducted in HR buffer plus ATP. For all experiments with Dmc1, 2 mM CaCl2 was included in the buffers, unless otherwise stated.
Data acquisition and analysis
All data were collected with 100‐ms integration time, and the illumination lasers were shuttered between image acquisitions to minimize photo‐bleaching. Images were collected using Nikon software, and images were exported as individual TIFF images. TIFF stacks were imported into ImageJ (Fiji). TIFF stacks were then corrected for stage drift using the registration/translation function within Fiji. For time course experiments, kymographs were generated from image stacks by defining a 1‐pixel‐wide region of interest (ROI) along the axis of the DNA and taking a slice of that position over the length of the time course. These slices were sequentially aligned to generate each kymograph. From these kymographs, time‐dependent changes in integrated signal intensity information were measured for individual ssDNA molecule in the experiment. The intensity values were averaged over the total number of ssDNA molecules analyzed, and the resulting values were plotted. For normalized values, each frame along the kymograph was divided by the maximum signal intensity in each kymograph, and the data were then averaged and plotted. For saturation analysis, a 1‐pixel‐wide and 39‐pixel‐long ROI was defined along the long axis of each ssDNA molecule, and the integrated signal intensity within this ROI was measured. Background signal was subtracted by making the same measurements using 39‐pixel ROI on a region without DNA. The resulting background signal value was subtracted from the signal intensities measured for the ssDNA molecules. The data for the binding curves (Figs 1, 2, and 5) were fit by non‐linear regression using GraphPad Prism 7. For two‐color imaging, the two channels were corrected for stage drift individually, and then merged. Kymographs were generated from the merged image, as described above.
ATP hydrolysis assays
ATP hydrolysis was performed in HR buffer [30 mM Tris–OAc (pH 7.5), 50 mM KCl, 20 mM MgOAc, 1 mM DTT, 0.2 mg/ml BSA] in the presence of 500 μM cold ATP and trace amounts of γ32P‐ATP. All reactions were performed at 30°C and contained 100 ng/μl salmon sperm DNA. Aliquots were removed at specified time points and quenched with 25 mM EDTA and 1% SDS. The quenched reactions were spotted on TLC plates (Millipore, Cat. No. HX71732079) and resolved in 0.5 M LiCl plus 1 M formic acid. Dried TLC plates were exposed to phosphorimaging screen and scanned with a Typhoon platform (GE Healthcare).
D‐loop assays
D‐loop formation experiments were performed in HR buffer using a ssDNA oligo fluorescently labeled with Atto‐647 on the 5′ end (0.1 μM) and homologous to portions of the M13 genome. The RF form of the M13 genome was used as a target (100 ng/μl). Rad51 (3 μM) was first added to the fluorescently labeled oligonucleotide and incubated at 30°C for 15 min. Rad54 (30 nM) and M13 dsDNA were subsequently added. Reactions were allowed to proceed for 5 or 10 min and quenched with equal volume proteinase K buffer [50 mM Tris–Cl (pH 7.5), 100 mM NaCl, 1 mM EDTA, 0.5% SDS]. Reactions were de‐proteinized by the addition of proteinase K. DNA was then resolved on a 0.8% agarose gel in 1× TAE. Gels were then scanned using a Typhoon imager with a 635‐nm laser.
Fluorescence recovery after photo‐bleaching
Yeast cells were grown and processed for fluorescence microscopy as described previously (Eckert‐Boulet et al, 2011). Proteins were tagged at their endogenous loci with yellow fluorescent protein (YFP, clone 10C; Ormo et al, 1996) in a RAD5 ADE2 strain derived from the W303‐1A genetic background (Thomas & Rothstein, 1989; Lisby et al, 2004). Live cell images were acquired using softWoRx (Applied Precision, Inc) software on a DeltaVision Elite microscope (Applied Precision, Inc.) equipped with a 100× objective lens (Olympus U‐PLAN S‐APO, NA 1.4), a cooled Evolve 512 EMCCD camera (Photometrics, Japan), and an Insight solid‐state illumination source (Applied Precision, Inc.). Pictures were processed with Volocity software (PerkinElmer).
DNA repair foci of Rad51 (strain ML1068; MAT a /MATα trp1‐1/TRP1 lys2∆/LYS2 RAD51/YFP‐RAD51), Rad52 (strain ML191; MAT a /MATα trp1‐1/TRP1 lys2∆/LYS2 RAD52‐YFP/RAD52‐YFP), and Rad54 (strain ML1067; MAT a /MATα trp1‐1/TRP1 lys2∆/LYS2 RAD54‐YFP/RAD54‐YFP) were induced by treatment of liquid cultures with 200 μg/ml Zeocin for 2‐h shaking at 25°C. Cells containing two repair foci were subjected to fluorescence recovery after photo‐bleaching (FRAP). Optical sections spanning 2 μm along the z‐axis were acquired at 0.4 μm distance before and at each time point after photo‐bleaching of one of the repair foci using a 488‐nm laser set to 10% intensity and a pulse time of 0.7 s. The intensity of the bleached focus was measured using Volocity software, adjusted for photo‐bleaching due to image acquisition, and the recovery half‐time and mobile protein fraction were determined by curve‐fitting using one‐phase association non‐linear regression using GraphPad Prism software.
Author contributions
JBC designed, executed, and analyzed all of the single‐molecule experiments. KK and YK provided purified proteins. ML conducted all FRAP experiments and data analyses. ECG supervised the project. JBC and ECG wrote the manuscript with input from KK, YK, PS, and ML.
Conflict of interest
The authors declare that they have no conflict of interest.
Supporting information
Expanded View Figures PDF
Review Process File
Source Data for Figure 1
Source Data for Figure 2
Source Data for Figure 3
Source Data for Figure 4
Source Data for Figure 5
Source Data for Figure 6
Acknowledgements
We thank members of the Greene laboratory for comments on the manuscript. We thank Wolf Dietrich‐Heyer for the kind gift of plasmid expressing GST‐Rad54. We also thank Lorraine Symington for the protease‐deficient yeast expression strain. We thank members of the Greene laboratory for comments on the manuscript. This research was funded by NIH grants to E.C.G. (R35GM118026) and P.S. (RO1 ES007061). M.L. was supported by the Danish Council for Independent Research, the Villum Foundation, and the European Research Council (ERCStG 242905). J.B.C. is the Mark Foundation for Cancer Research Fellow for the Damon Runyon Cancer Research Foundation (DRG 2310‐17).
The EMBO Journal (2018) 37: e98728
References
- Agarwal S, van Cappellen WA, Guénolé A, Eppink B, Linsen SEV, Meijering E, Houtsmuller A, Kanaar R, Essers J (2011) ATP‐dependent and independent functions of Rad54 in genome maintenance. J Cell Biol 192: 735–750 [DOI] [PMC free article] [PubMed] [Google Scholar]
- Alexeev AA, Mazin AV, Kowalczykowski SC (2003) Rad54 protein possesses chromatin‐remodeling activity stimulated by the Rad51‐ssDNA nucleoprotein filament. Nat Struct Mol Biol 10: 182–186 [DOI] [PubMed] [Google Scholar]
- Alexiadis V, Kadonaga JT (2002) Strand pairing by Rad54 and Rad51 is enhanced by chromatin. Genes Dev 16: 2767–2771 [DOI] [PMC free article] [PubMed] [Google Scholar]
- Amitani I, Baskin RJ, Kowalczykowski SC (2006) Visualization of Rad54, a chromatin remodeling protein, translocating on single DNA molecules. Mol Cell 23: 143–148 [DOI] [PubMed] [Google Scholar]
- Argunhan B, Leung WK, Afshar N, Terentyev Y, Subramanian VV, Murayama Y, Hochwagen A, Iwasaki H, Tsubouchi T, Tsubouchi H (2017) Fundamental cell cycle kinases collaborate to ensure timely destruction of the synaptonemal complex during meiosis. EMBO J 36: 2488–2509 [DOI] [PMC free article] [PubMed] [Google Scholar]
- Bishop DK, Park D, Xu L, Kleckner N (1992) DMC1: a meiosis‐specific yeast homolog of E. coli recA required for recombination, synaptonemal complex formation, and cell cycle progression. Cell 69: 439–456 [DOI] [PubMed] [Google Scholar]
- Bishop DK (1994) RecA homologs Dmc1 and Rad51 interact to form multiple nuclear complexes prior to meiotic chromosome synapsis. Cell 79: 1081–1092 [DOI] [PubMed] [Google Scholar]
- Bishop DK, Nikolski Y, Oshiro J, Chon J, Shinohara M, Chen X (1999) High copy number suppression of the meiotic arrest caused by a dmc1 mutation: REC114 imposes an early recombination block and RAD54 promotes a DMC1‐independent DSB repair pathway. Genes Cells 4: 425–444 [DOI] [PubMed] [Google Scholar]
- Brown MS, Bishop DK (2014) DNA strand exchange and RecA homologs in meiosis. Cold Spring Harb Perspect Biol 7: a016659 [DOI] [PMC free article] [PubMed] [Google Scholar]
- Bugreev DV, Mazina OM, Mazin AV (2006) Rad54 protein promotes branch migration of Holliday junctions. Nature 442: 590–593 [DOI] [PubMed] [Google Scholar]
- Busygina V, Sehorn MG, Shi IY, Tsubouchi H, Roeder GS, Sung P (2008) Hed1 regulates Rad51‐mediated recombination via a novel mechanism. Genes Dev 22: 786–795 [DOI] [PMC free article] [PubMed] [Google Scholar]
- Busygina V, Saro D, Williams GJ, Leung W‐K, Say AF, Sehorn MG, Sung P, Tsubouchi H (2012) Novel attributes of Hed1 affect dynamics and activity of the Rad51 presynaptic filament during meiotic recombination. J Biol Chem 287: 1566–1575 [DOI] [PMC free article] [PubMed] [Google Scholar]
- Busygina V, Gaines WA, Xu Y, Kwon Y, Williams GJ, Lin SW, Chang HY, Chi P, Wang HW, Sung P (2013) Functional attributes of the Saccharomyces cerevisiae meiotic recombinase Dmc1. DNA Repair 12: 707–712 [DOI] [PMC free article] [PubMed] [Google Scholar]
- Callender TL, Laureau R, Wan L, Chen X, Sandhu R, Laljee S, Zhou S, Suhandynata RT, Prugar E, Gaines WA, Kwon Y‐H, Börner GV, Nicolas A, Neiman AM, Hollingsworth NM (2016) Mek1 down regulates Rad51 activity during yeast meiosis by phosphorylation of Hed1. PLoS Genet 12: e1006226 [DOI] [PMC free article] [PubMed] [Google Scholar]
- Ceballos SJ, Heyer WD (2011) Functions of the Snf2/Swi2 family Rad54 motor protein in homologous recombination. Biochim Biophys Acta 1809: 509–523 [DOI] [PMC free article] [PubMed] [Google Scholar]
- Chen Z, Yang H, Pavletich NP (2008) Mechanism of homologous recombination from the RecA‐ssDNA/dsDNA structures. Nature 453: 489–494 [DOI] [PubMed] [Google Scholar]
- Chen R, Wold MS (2014) Replication protein A: single‐stranded DNA's first responder: dynamic DNA‐interactions allow replication protein A to direct single‐strand DNA intermediates into different pathways for synthesis or repair. BioEssays 36: 1156–1161 [DOI] [PMC free article] [PubMed] [Google Scholar]
- Cloud V, Chan Y‐L, Grubb J, Budke B, Bishop DK (2012) Dmc1 catalyzes interhomolog joint molecule formation in meiosis with Rad51 and Mei5‐Sae3 as accessory factors. Science 337: 1222–1225 [DOI] [PMC free article] [PubMed] [Google Scholar]
- Conway AB, Lynch TW, Zhang Y, Fortin GS, Fung CW, Symington LS, Rice PA (2004) Crystal structure of a Rad51 filament. Nat Struct Mol Biol 11: 791–796 [DOI] [PubMed] [Google Scholar]
- Dresser ME, Ewing DJ, Conrad MN, Dominguez AM, Barstead R, Jiang H, Kodadek T (1997) Dmc1 functions in a Saccharomyces cerevisiae meiotic pathway that is largely independent of the Rad51 pathway. Genetics 147: 533–544 [DOI] [PMC free article] [PubMed] [Google Scholar]
- Eckert‐Boulet N, Rothstein R, Lisby M (2011) Cell biology of homologous recombination in yeast. Methods Mol Biol 745: 523–536 [DOI] [PMC free article] [PubMed] [Google Scholar]
- Essers J, Houtsmuller AB, van Veelen L, Paulusma C, Nigg AL, Pastink A, Vermeulen W, Hoeijmakers JH, Kanaar R (2002) Nuclear dynamics of RAD52 group homologous recombination proteins in response to DNA damage. EMBO J 21: 2030–2037 [DOI] [PMC free article] [PubMed] [Google Scholar]
- Gibb B, Ye LF, Gergoudis SC, Kwon Y‐H, Niu H, Sung P, Greene EC (2014a) Concentration‐dependent exchange of replication protein A on single‐stranded DNA revealed by single‐molecule imaging. PLoS One 9: e87922 [DOI] [PMC free article] [PubMed] [Google Scholar]
- Gibb B, Ye LF, Kwon Y‐H, Niu H, Sung P, Greene EC (2014b) Protein dynamics during presynaptic complex assembly on individual ssDNA molecules. Nat Struct Mol Biol 21: 893–900 [DOI] [PMC free article] [PubMed] [Google Scholar]
- Govin J, Dorsey J, Gaucher J, Rousseaux S, Khochbin S, Berger SL (2010) Systematic screen reveals new functional dynamics of histones H3 and H4 during gametogenesis. Genes Dev 24: 1772–1786 [DOI] [PMC free article] [PubMed] [Google Scholar]
- van der Heijden T, Seidel R, Modesti M, Kanaar R, Wyman C, Dekker C (2007) Real‐time assembly and disassembly of human RAD51 filaments on individual DNA molecules. Nucleic Acids Res 35: 5646–5657 [DOI] [PMC free article] [PubMed] [Google Scholar]
- Heyer WD, Li X, Rolfsmeier M, Zhang XP (2006) Rad54: the Swiss Army knife of homologous recombination? Nucleic Acids Res 34: 4115–4125 [DOI] [PMC free article] [PubMed] [Google Scholar]
- Heyer WD, Ehmsen KT, Liu J (2010) Regulation of homologous recombination in eukaryotes. Annu Rev Genet 44: 113–139 [DOI] [PMC free article] [PubMed] [Google Scholar]
- Jaskelioff M, Van Komen S, Krebs JE, Sung P, Peterson CL (2003) Rad54p is a chromatin remodeling enzyme required for heteroduplex DNA joint formation with chromatin. J Biol Chem 278: 9212–9218 [DOI] [PubMed] [Google Scholar]
- Jiang H, Xie Y, Houston P, Stemke‐Hale K, Mortensen UH, Rothstein R, Kodadek T (1996) Direct association between the Yeast Rad51 and Rad54 recombination proteins. J Biol Chem 271: 33181–33186 [DOI] [PubMed] [Google Scholar]
- Klein HL (1997) Rdh54, a Rad54 homologue in Saccharomyces cerevisiae, is required for mitotic diploid‐specific recombination and repair and for meiosis. Genetics 147: 1533–1543 [DOI] [PMC free article] [PubMed] [Google Scholar]
- Kniewel R, Murakami H, Liu Y, Ito M, Ohta K, Hollingsworth NM, Keeney S (2017) Histone H3 threonine 11 phosphorylation is catalyzed directly by the meiosis‐specific kinase Mek1 and provides a molecular readout of Mek1 activity in vivo . Genetics 207: 1313–1333 [DOI] [PMC free article] [PubMed] [Google Scholar]
- Kowalczykowski SC (2015) An overview of the molecular mechanisms of recombinational DNA repair. Cold Spring Harb Perspect Biol 7: a016410 [DOI] [PMC free article] [PubMed] [Google Scholar]
- Lam I, Keeney S (2014) Mechanism and regulation of meiotic recombination initiation. Cold Spring Harb Perspect Biol 7: a016634 [DOI] [PMC free article] [PubMed] [Google Scholar]
- Lao JP, Hunter N (2010) Trying to avoid your sister. PLoS Biol 8: e1000519 [DOI] [PMC free article] [PubMed] [Google Scholar]
- Lao JP, Cloud V, Huang C‐C, Grubb J, Thacker D, Lee C‐Y, Dresser ME, Hunter N, Bishop DK (2013) Meiotic crossover control by concerted action of Rad51‐Dmc1 in homolog template bias and robust homeostatic regulation. PLoS Genet 9: e1003978 [DOI] [PMC free article] [PubMed] [Google Scholar]
- Lee M‐H, Chang Y‐C, Hong EL, Grubb J, Chang C‐S, Bishop DK, Wang T‐F (2005) Calcium ion promotes yeast Dmc1 activity via formation of long and fine helical filaments with single‐stranded DNA. J Biol Chem 280: 40980–40984 [DOI] [PubMed] [Google Scholar]
- Li X, Stith CM, Burgers PM, Heyer WD (2009) PCNA is required for initiation of recombination‐associated DNA synthesis by DNA polymerase delta. Mol Cell 36: 704–713 [DOI] [PMC free article] [PubMed] [Google Scholar]
- Lisby M, Barlow JH, Burgess RC, Rothstein R (2004) Choreography of the DNA damage response: spatiotemporal relationships among checkpoint and repair proteins. Cell 118: 699–713 [DOI] [PubMed] [Google Scholar]
- Liu Y, Gaines WA, Callender TL, Busygina V, Oke A, Sung P, Fung JC, Hollingsworth NM (2014) Down‐regulation of Rad51 activity during meiosis in yeast prevents competition with Dmc1 for repair of double‐strand breaks. PLoS Genet 10: e1004005 [DOI] [PMC free article] [PubMed] [Google Scholar]
- Ma CJ, Gibb B, Kwon Y, Sung P, Greene EC (2017a) Protein dynamics of human RPA and RAD51 on ssDNA during assembly and disassembly of the RAD51 filament. Nucleic Acids Res 45: 749–761 [DOI] [PMC free article] [PubMed] [Google Scholar]
- Ma CJ, Kwon Y‐H, Sung P, Greene EC (2017b) Human RAD52 interactions with replication protein A and the RAD51 presynaptic complex. J Biol Chem 292: 11702–11713 [DOI] [PMC free article] [PubMed] [Google Scholar]
- Ma CJ, Steinfeld JB, Greene EC (2017c) Single‐stranded DNA curtains for studying homologous recombination. Methods Enzymol 582: 193–219 [DOI] [PMC free article] [PubMed] [Google Scholar]
- Mazin AV, Bornarth CJ, Solinger JA, Heyer WD, Kowalczykowski SC (2000) Rad54 protein is targeted to pairing loci by the Rad51 nucleoprotein filament. Mol Cell 6: 583–592 [DOI] [PubMed] [Google Scholar]
- Mazin AV, Alexeev AA, Kowalczykowski SC (2003) A novel function of Rad54 protein: stabilization of the Rad51 nucleoprotein filament. J Biol Chem 278: 14029–14036 [DOI] [PubMed] [Google Scholar]
- Mazin AV, Mazina OM, Bugreev DV, Rossi MJ (2010) Rad54, the motor of homologous recombination. DNA Repair 9: 286–302 [DOI] [PMC free article] [PubMed] [Google Scholar]
- Mehta A, Haber JE (2014) Sources of DNA double‐strand breaks and models of recombinational DNA repair. Cold Spring Harb Perspect Biol 6: a016428 [DOI] [PMC free article] [PubMed] [Google Scholar]
- Morrical SW (2015) DNA‐pairing and annealing processes in homologous recombination and homology‐directed repair. Cold Spring Harb Perspect Biol 7: a016444 [DOI] [PMC free article] [PubMed] [Google Scholar]
- Neale MJ, Keeney S (2006) Clarifying the mechanics of DNA strand exchange in meiotic recombination. Nature 442: 153–158 [DOI] [PMC free article] [PubMed] [Google Scholar]
- Nimonkar AV, Dombrowski CC, Siino JS, Stasiak AZ, Stasiak A, Kowalczykowski SC (2012) Saccharomyces cerevisiae Dmc1 and Rad51 proteins preferentially function with Tid1 and Rad54 proteins, respectively, to promote DNA strand invasion during genetic recombination. J Biol Chem 287: 28727–28737 [DOI] [PMC free article] [PubMed] [Google Scholar]
- Niu H, Wan L, Busygina V, Kwon Y‐H, Allen JA, Li X, Kunz RC, Kubota K, Wang B, Sung P, Shokat KM, Gygi SP, Hollingsworth NM (2009) Regulation of meiotic recombination via Mek1‐mediated Rad54 phosphorylation. Mol Cell 36: 393–404 [DOI] [PMC free article] [PubMed] [Google Scholar]
- Ormo M, Cubitt AB, Kallio K, Gross LA, Tsien RY, Remington SJ (1996) Crystal structure of the Aequorea victoria green fluorescent protein. Science 273: 1392–1395 [DOI] [PubMed] [Google Scholar]
- Paques F, Haber JE (1999) Multiple pathways of recombination induced by double‐strand breaks in Saccharomyces cerevisiae . Microbiol Mol Biol Rev 63: 349–404 [DOI] [PMC free article] [PubMed] [Google Scholar]
- Petukhova G, Stratton S, Sung P (1998) Catalysis of homologous DNA pairing by yeast Rad51 and Rad54 proteins. Nature 393: 91–94 [DOI] [PubMed] [Google Scholar]
- Petukhova G, Van Komen S, Vergano S, Klein H, Sung P (1999) Yeast Rad54 promotes Rad51‐dependent homologous DNA pairing via ATP hydrolysis‐driven change in DNA double helix conformation. J Biol Chem 274: 29453–29462 [DOI] [PubMed] [Google Scholar]
- Prugar E, Burnett C, Chen X, Hollingsworth NM (2017) Coordination of double strand break repair and meiotic progression in yeast by a Mek1‐Ndt80 negative feedback loop. Genetics 206: 497–512 [DOI] [PMC free article] [PubMed] [Google Scholar]
- Qi Z, Redding S, Lee J‐Y, Gibb B, Kwon Y‐H, Niu H, Gaines WA, Sung P, Greene EC (2015) DNA sequence alignment by microhomology sampling during homologous recombination. Cell 160: 856–869 [DOI] [PMC free article] [PubMed] [Google Scholar]
- Qi Z, Greene EC (2016) Visualizing recombination intermediates with single‐stranded DNA curtains. Methods 105: 62–74 [DOI] [PMC free article] [PubMed] [Google Scholar]
- Raschle M, Van Komen S, Chi P, Ellenberger T, Sung P (2004) Multiple interactions with the Rad51 recombinase govern the homologous recombination function of Rad54. J Biol Chem 279: 51973–51980 [DOI] [PubMed] [Google Scholar]
- Renkawitz J, Lademann CA, Kalocsay M, Jentsch S (2013) Monitoring homology search during DNA double‐strand break repair in vivo . Mol Cell 50: 261–272 [DOI] [PubMed] [Google Scholar]
- Rossi MJ, Mazin AV (2008) Rad51 protein stimulates the branch migration activity of Rad54 protein. J Biol Chem 283: 24698–24706 [DOI] [PMC free article] [PubMed] [Google Scholar]
- San Filippo J, Sung P, Klein HL (2008) Mechanism of eukaryotic homologous recombination. Annu Rev Biochem 77: 229–257 [DOI] [PubMed] [Google Scholar]
- Sanchez H, Kertokalio A, van Rossum‐Fikkert S, Kanaar R, Wyman C (2013) Combined optical and topographic imaging reveals different arrangements of human RAD54 with presynaptic and postsynaptic RAD51–DNA filaments. Proc Natl Acad Sci USA 110: 11385–11390 [DOI] [PMC free article] [PubMed] [Google Scholar]
- Shah PP, Zheng X, Epshtein A, Carey JN, Bishop DK, Klein HL (2010) Swi2/Snf2‐related translocases prevent accumulation of toxic Rad51 complexes during mitotic growth. Mol Cell 39: 862–872 [DOI] [PMC free article] [PubMed] [Google Scholar]
- Sheridan SD, Yu X, Roth R, Heuser JE, Sehorn MG, Sung P, Egelman EH, Bishop DK (2008) A comparative analysis of Dmc1 and Rad51 nucleoprotein filaments. Nucleic Acids Res 36: 4057–4066 [DOI] [PMC free article] [PubMed] [Google Scholar]
- Shinohara M, Shita‐Yamaguchi E, Buerstedde J‐M, Shinagawa H, Ogawa H, Shinohara A (1997) Characterization of the roles of the Saccharomyces cerevisiae RAD54 gene and a homologue of RAD54, RDH54/TID1, in mitosis and meiosis. Genetics 147: 1545–1556 [DOI] [PMC free article] [PubMed] [Google Scholar]
- Shinohara M, Sakai K, Shinohara A, Bishop DK (2003) Crossover interference in Saccharomyces cerevisiae requires a TID1/RDH54‐ and DMC1‐dependent pathway. Genetics 163: 1273–1286 [DOI] [PMC free article] [PubMed] [Google Scholar]
- Solinger JA, Lutz G, Sugiyama T, Kowalczykowski SC, Heyer W‐D (2001) Rad54 protein stimulates heteroduplex DNA formation in the synaptic phase of DNA strand exchange via specific interactions with the presynaptic Rad51 nucleoprotein filament. J Mol Biol 307: 1207–1221 [DOI] [PubMed] [Google Scholar]
- Sugawara N, Wang X, Haber JE (2003) In vivo roles of Rad52, Rad54, and Rad55 proteins in Rad51‐mediated recombination. Mol Cell 12: 209–219 [DOI] [PubMed] [Google Scholar]
- Sung P, Stratton SA (1996) Yeast Rad51 recombinase mediates polar DNA strand exchange in the absence of ATP hydrolysis. J Biol Chem 271: 27983–27986 [DOI] [PubMed] [Google Scholar]
- Symington LS, Heyer WD (2006) Some disassembly required: role of DNA translocases in the disruption of recombination intermediates and dead‐end complexes. Genes Dev 20: 2479–2486 [DOI] [PubMed] [Google Scholar]
- Symington LS, Rothstein R, Lisby M (2014) Mechanisms and regulation of mitotic recombination in Saccharomyces cerevisiae . Genetics 198: 795–835 [DOI] [PMC free article] [PubMed] [Google Scholar]
- Tan TL, Kanaar R, Wyman C (2003) Rad54, a Jack of all trades in homologous recombination. DNA Repair 2: 787–794 [DOI] [PubMed] [Google Scholar]
- Thomas BJ, Rothstein R (1989) Elevated recombination rates in transcriptionally active DNA. Cell 56: 619–630 [DOI] [PubMed] [Google Scholar]
- Tsubouchi H, Roeder GS (2006) Budding yeast Hed1 down‐regulates the mitotic recombination machinery when meiotic recombination is impaired. Genes Dev 20: 1766–1775 [DOI] [PMC free article] [PubMed] [Google Scholar]
- Van Komen S, Petukhova G, Sigurdsson S, Stratton S, Sung P (2000) Superhelicity‐driven homologous DNA pairing by yeast recombination factors Rad51 and Rad54. Mol Cell 6: 563–572 [DOI] [PubMed] [Google Scholar]
- Wesoly J, Agarwal S, Sigurdsson S, Bussen W, Van Komen S, Qin J, van Steeg H, van Benthem J, Wassenaar E, Baarends WM, Ghazvini M, Tafel AA, Heath H, Galjart N, Essers J, Grootegoed JA, Arnheim N, Bezzubova O, Buerstedde JM, Sung P et al (2006) Differential contributions of mammalian Rad54 paralogs to recombination, DNA damage repair, and meiosis. Mol Cell Biol 26: 976–989 [DOI] [PMC free article] [PubMed] [Google Scholar]
- Wold MS (1997) Replication protein A: a heterotrimeric, single‐stranded DNA‐binding protein required for eukaryotic DNA metabolism. Annu Rev Biochem 66: 61–92 [DOI] [PubMed] [Google Scholar]
- Wolner B, van Komen S, Sung P, Peterson CL (2003) Recruitment of the recombinational repair machinery to a DNA double‐strand break in yeast. Mol Cell 12: 221–232 [DOI] [PubMed] [Google Scholar]
- Wright WD, Heyer W‐D (2014) Rad54 functions as a heteroduplex DNA pump modulated by Its DNA substrates and Rad51 during D Loop formation. Mol Cell 53: 420–432 [DOI] [PMC free article] [PubMed] [Google Scholar]
- Xu J, Zhao L, Xu Y, Zhao W, Sung P, Wang HW (2017) Cryo‐EM structures of human RAD51 recombinase filaments during catalysis of DNA‐strand exchange. Nat Struct Mol Biol 24: 40–46 [DOI] [PMC free article] [PubMed] [Google Scholar]
- Zickler D, Kleckner N (2015) Recombination, pairing, and synapsis of homologs during meiosis. Cold Spring Harb Perspect Biol 7: a016626 [DOI] [PMC free article] [PubMed] [Google Scholar]
Associated Data
This section collects any data citations, data availability statements, or supplementary materials included in this article.
Supplementary Materials
Expanded View Figures PDF
Review Process File
Source Data for Figure 1
Source Data for Figure 2
Source Data for Figure 3
Source Data for Figure 4
Source Data for Figure 5
Source Data for Figure 6