Abstract
Neural development is accomplished by differentiation events leading to metabolic reprogramming. Glycosphingolipid metabolism is reprogrammed during neural development with a switch from globo‐ to ganglio‐series glycosphingolipid production. Failure to execute this glycosphingolipid switch leads to neurodevelopmental disorders in humans, indicating that glycosphingolipids are key players in this process. Nevertheless, both the molecular mechanisms that control the glycosphingolipid switch and its function in neurodevelopment are poorly understood. Here, we describe a self‐contained circuit that controls glycosphingolipid reprogramming and neural differentiation. We find that globo‐series glycosphingolipids repress the epigenetic regulator of neuronal gene expression AUTS2. AUTS2 in turn binds and activates the promoter of the first and rate‐limiting ganglioside‐producing enzyme GM3 synthase, thus fostering the synthesis of gangliosides. By this mechanism, the globo–AUTS2 axis controls glycosphingolipid reprogramming and neural gene expression during neural differentiation, which involves this circuit in neurodevelopment and its defects in neuropathology.
Keywords: glycosphingolipids, neural differentiation, AUTS2, epigenetics, bistability
Subject Categories: Metabolism, Neuroscience
Introduction
Glycosphingolipids (GSLs) are glycosylated derivatives of ceramide that are collectively required for embryonic development and have key roles in the modulation of cell response to morphogens (Yamashita et al, 1999; Hakomori, 2008). Glycosphingolipids are synthesised by the stepwise addition of monosaccharides to a specific position on a carbohydrate chain attached to a ceramide backbone. The nature of the added monosaccharide, the linkage point, and the anomeric type of the glycosidic bond all depend on the specific GSL‐synthesising enzyme (GSE) involved (D'Angelo et al, 2013a). Thus, different GSEs can act on the same substrate to produce different and, on first approximation, non‐inter‐convertible GSLs from the same precursor, which results in the fact that vertebrates synthesise GSLs belonging to different metabolic series.
The key “decisional” point towards the production of GSLs belonging to specific series is the glycosylation of lactosylceramide (LacCer; D'Angelo et al, 2013a). LacCer is indeed the common substrate of GM2/GA2 synthase (GM2/GA2S) for the production of GA2 (GalNAc‐β1‐4‐LacCer), of GM3 synthase (GM3S) for the production of GM3 (NeuAc‐α2‐3‐LacCer), of Gb3 synthase (Gb3S) for the production of Gb3 (Gal‐α1‐4‐LacCer), and of Lc3 synthase (LC3S) for the production of Lc3 (GlcNAc‐β1‐3‐LacCer; D'Angelo et al, 2013a). GA2, GM3, Gb3, and Lc3 are then precursors for the synthesis of GSLs belonging to the asialo, ganglio, globo/iso‐globo, and lacto/neo‐lacto‐series, respectively (Fig 1A).
Figure 1. Schematic representation of GSL metabolism and of neural GSL reprogramming.
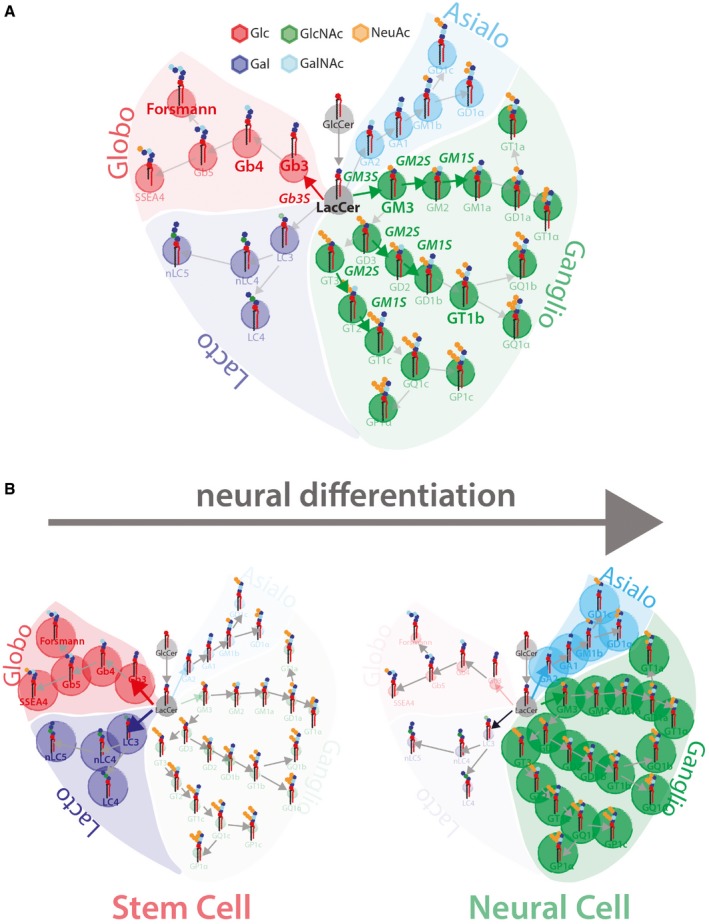
- Schematic representation of GSL metabolism (Glc, glucose; Gal, galactose; GlcNAc, N‐acetylglucosamine; GalNAc, N‐acetylgalactosamine; NeuAc, N‐acetylneuraminic acid). Grey circles indicate GSL precursors GlcCer and LacCer, green circles indicate ganglio‐series GSLs, red circles indicate globo‐series GSLs, cyan circles indicate asialo‐series GSLs, and blue circles indicate lacto‐series GSLs.
- Schematic representation of GSL reprogramming in neural differentiation. Stem cells prevalently produce lacto‐ and globo‐series GSLs (left panel), while neurons prevalently produce ganglio‐ and asialo‐series GSLs (right panel).
In our previous studies, we have reported that the type of LacCer glycosylation depends on the mode of transport of its precursor glucosylceramide (GlcCer) to dedicated GSE machineries (D'Angelo et al, 2007, 2013b), where the coordinated regulation of GSE expression is the other main contributor towards the synthesis of specific GSLs. The physiological meaning of GSL diversity and of the existence of systems devoted to control their metabolism is still largely elusive. Nevertheless, metabolic channelling mechanisms are exploited during development where the GSL synthetic flux is switched from one metabolic direction to another.
The most important example of developmental GSL remodelling is that operating in neural differentiation (Furukawa et al, 2014). Brain development relies on the execution of morphogenetic programmes that begin at early embryonic stages and are protracted throughout the animal life (Stiles & Jernigan, 2010). A central event in this respect is neural differentiation whereby stem cells are committed to neural fate. In neural differentiation, transcriptional, epigenetic, and metabolic programmes are triggered to yield the different neural cell populations (Hamby et al, 2008; Kim et al, 2014; Qiao et al, 2016). Remarkably, during stem cell differentiation to neural cells, the production of GSLs is shifted from globo‐series to ganglio‐series (Fig 1B; Liang et al, 2010, 2011). This transition is caused by a coordinated change in the expression of GSEs responsible for the production of GSLs belonging to the two metabolic series (Liang et al, 2010, 2011).
Thus, the expression of A4GALT (encoding Gb3S) is suppressed while that of ST3GAL5 (encoding GM3S) is induced in neural differentiation (Liang et al, 2010, 2011). Notably, mutations in GM3S resulting in the absence of ganglio‐series GSLs (and metabolic redirection towards globo‐series GSL production) cause a severe disease in humans (i.e. GM3S deficiency syndrome, OMIM: #609056) characterised by epilepsy, brain atrophy and impaired psychomotor development (Simpson et al, 2004; Fragaki et al, 2013; Lee et al, 2016). Moreover, genetic manipulations in animal models have highlighted a fundamental role for GSLs in brain function (Jennemann et al, 2005; Yamashita et al, 2005).
In spite of this evidence, the mechanisms driving GSL reprogramming and its exact role in neurodevelopment are not known. Here, we provide data indicating that the neural GSL reprogramming is internally controlled. We indeed uncover a circuit whereby the globo‐series GSLs negatively modulate the expression of the epigenetic regulator of neural gene expression autism susceptibility candidate 2 (AUTS2). AUTS2, in turn, binds and activates GM3S promoter inducing GM3S expression and thus the synthesis of GM3 and of downstream gangliosides.
Importantly, AUTS2 controls the transcription of a wide set of neural genes by stimulating histone acetylation at their promoters (Gao et al, 2014; Oksenberg et al, 2014) and, as a consequence, it is required for proper neurodevelopment (Kalscheuer et al, 2007; Bedogni et al, 2010; Beunders et al, 2013, 2016; Oksenberg et al, 2013; Gao et al, 2014). Here, we show that, by suppressing AUTS2, globo‐series GSLs reduce histone acetylation at neuronal gene promoters counteracting their expression and therefore neural differentiation. Based on these data, we propose that the GSL metabolic switch drives neuronal gene expression during neural differentiation.
Results
Globo‐series GSLs inhibit GSL reprogramming and neural differentiation
To recapitulate neural differentiation in vitro, murine E14 embryonic stem cells (E14‐mESCs) were induced to differentiate to neural cells, as described in Ref. Fico et al (2008). Neural differentiation was evaluated by changes in the levels of stemness (i.e. Nanog and Oct4) and neural (i.e. Tuj‐1) markers (Fig 2A). As shown in Fig 2B, the mRNA levels of Gb3S are reduced during differentiation. On the contrary, GSEs devoted to ganglio‐series GSL synthesis (including GM3S) increase in this process (Fig 2B). To assess the impact of these transcriptional changes on GSL composition, we used validated anti‐GSL antibodies (i.e. anti‐Gb4 and anti‐Forssman antigen for the globo‐series and anti‐GT1b for the ganglio‐series) in cytofluorimetric assays. We observed that E14‐mESCs expose globo‐series GSLs at their cell surfaces (i.e. Gb4 and Forssman), while after neural differentiation, the globo‐series GSLs are no longer detected and ganglio‐series GSLs are produced (i.e. GT1b; Fig 2C; Liang et al, 2011).
Figure 2. Globo‐series GSLs inhibit neural differentiation and GSL reprogramming.
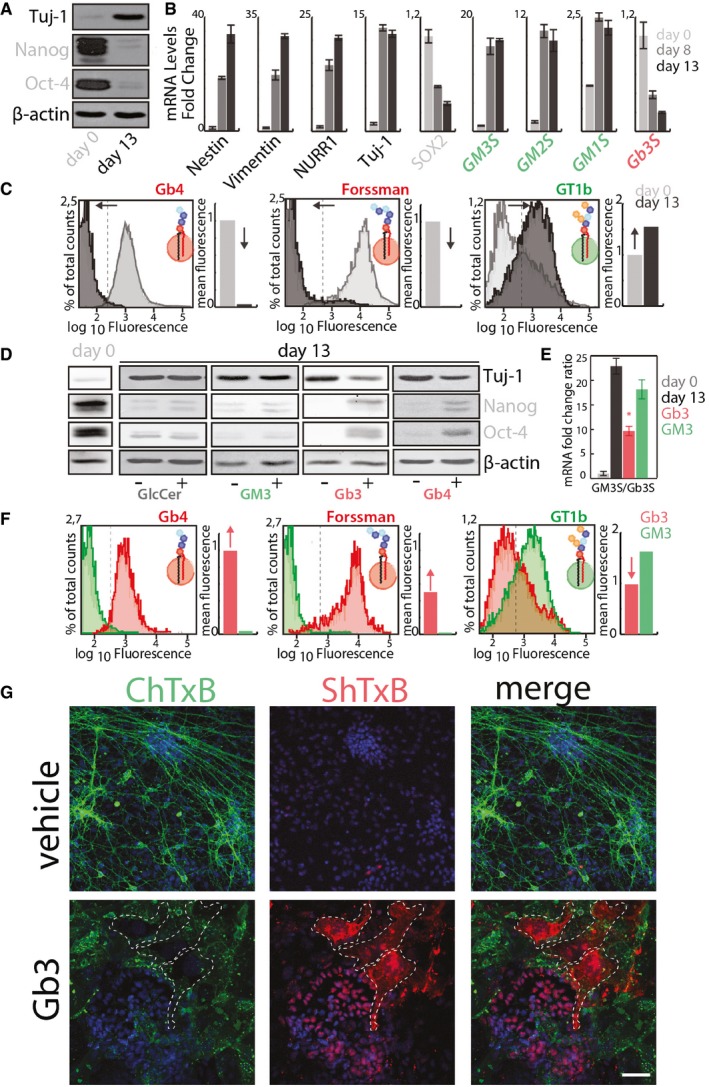
- E14‐mESCs in an undifferentiated state (day 0) or induced to differentiate into neurons for 13 days were processed for Western blotting to evaluate the expression of neural (i.e. Tuj‐1) and stemness (i.e. Nanog, and Oct4) markers.
- The mRNA levels of neuronal markers (black); stemness markers (grey); ganglio‐series synthesising enzymes (green); globo‐series GSL‐synthesising enzymes (red) were evaluated in cells treated as in (A). Data are means ± SD of at least three independent experiments.
- E14‐mESCs treated as in (A) were analysed by cytofluorometry with antibodies directed against globo‐series GSLs (i.e. Gb4 and Forssman) or the ganglioside GT1b. Cytofluorimetric profiles and normalised mean fluorescence are shown for each antibody at day 0 (grey) and at day 13 (black). Arrows indicate the direction of changes observed during neural differentiation.
- E14‐mESCs were induced to differentiate into neurons over 13 days in presence of the indicated GSLs (25 μM) or vehicle (methanol). Subsequently, cells were processed for Western blotting as in (A).
- E14‐mESCs treated as in (D) were processed for RNA extraction. The mRNA levels for Gb3S and GM3S were evaluated by qPCR. GM3S/Gb3S mRNA ratios are shown. Day 0 (grey); day 13 + vehicle (black); day 13 + Gb3 (red); day 13 + GM3 (green). Data are means ± SD of at least three independent experiments. *P ≤ 0.05.
- E14‐mESCs treated as in (E) were analysed by cytofluorometry after 13 days of differentiation with antibodies directed against globo‐series GSLs (i.e. Gb4 and Forssman) or the ganglioside GT1b. Cytofluorimetric profiles and normalised mean fluorescence are shown for each antibody for cells treated with Gb3 (red) or GM3 (green). Red arrows indicate changes induced by Gb3 treatment.
- E14‐mESCs treated with Gb3 or vehicle were stained with ChTxB‐Alexa488 (green), ShTxB‐Cy3 (red), and DAPI (blue). Dashed lines indicate ShTxB‐positive cell perimeters. Scale bar, 50 μm.
To evaluate the role of ganglio‐series GSL production in neural differentiation, E14‐mESCs were treated with different inhibitors of GSL synthesis (Fig EV1A) and induced to differentiate. In agreement with previous reports (Liour & Yu, 2002) in spite of partial inhibition (60%) of GSL synthesis (Fig EV1B) and of reduced ganglio‐series GSL levels (~60% reduction in GT1b levels; Fig EV1C), N‐butyl‐deoxynojirimycin (NB‐DNJ; 25 μM; Platt et al, 1994) treated E14‐mESCs effectively differentiated to neural cells as judged by levels of stemness and neural markers (Fig EV1D). On the contrary, N‐[(1R,2R)‐2‐hydroxy‐1‐(4‐morpholinylmethyl)‐2‐phenylethyl]hexadecanamide (PPMP; 2.5 μM) treatment, which resulted in a more sustained (80%) inhibition of GSL production (Fig EV1B) and substantially reduced ganglio‐series GSLs levels (~88% reduction in GT1b levels; Fig EV1C), hampered neural differentiation (Fig EV1D). Nonetheless, previous studies have reported that PDMP a compound structurally similar to PPMP inhibits neural differentiation independently on its inhibitory activity on GSL synthesis (Liour & Yu, 2002), and we thus evaluated the effect of additional inhibitors of sphingolipid production (Fumonisin B1 [FB1; 25 μM] and myriocin [Myr; 2.5 μM]) on neural differentiation. As shown in Fig EV1E, FB1 and Myr reduced GT1b levels by ~55% and 85%, respectively, without affecting neural differentiation (Fig EV1F), suggesting that GSL production is largely dispensable for this process. On the same lines, silencing of GM3S (siGM3S; Fig EV1H) did not result in any measurable impairment in the repression of stemness markers or induction of neuronal markers (Fig EV1G and I), indicating that ganglio‐series GSL production is in general a result (not a requisite) of neural differentiation in vitro.
Figure EV1. GSL synthesis inhibition does not inhibit neural differentiation.
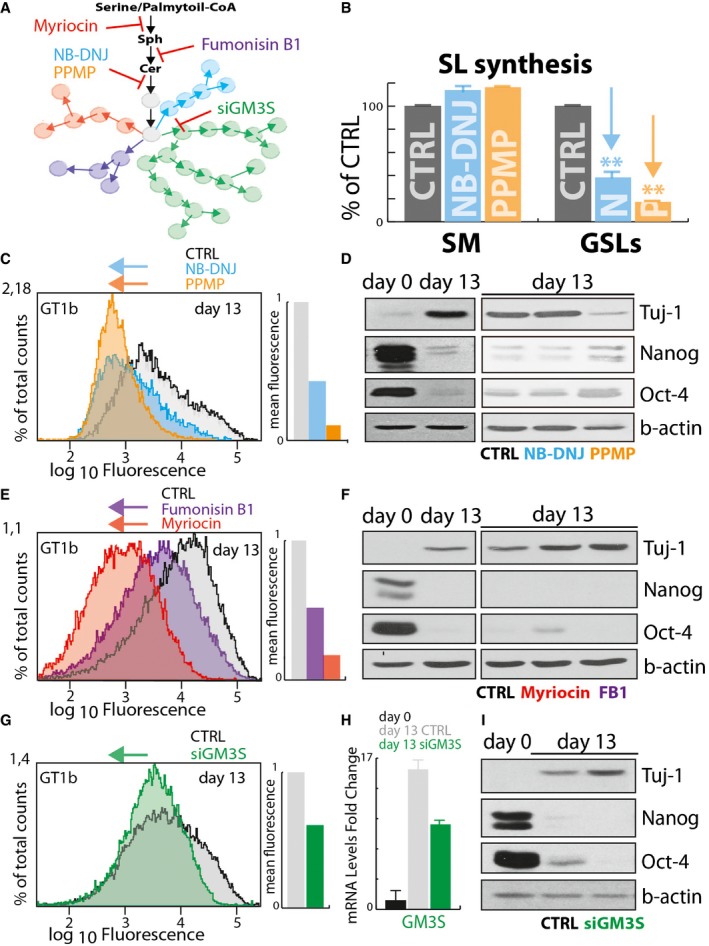
- Schematic representation of Myriocin, Fumonisin B1, NB‐DNJ, PPMP, and GM3S silencing (siGM3S) mediated inhibition of GSL synthesis.
- Effect of NB‐DNJ (25 μM) and PPMP (2.5 μM) treatment on sphingolipid synthesis in E14‐mESCs. E14‐mESC control, treated with NB‐DNJ or PPMP, was pulse‐labelled as for 8 h with [3H]‐sphingosine. Sphingomyelin (SM) and GSL synthesis in control (grey), NB‐DNJ (cyan)‐, and PPMP (orange)‐treated cells are expressed as percentage of control ± SD from three independent experiments. **P ≤ 0.01.
- E14‐mESCs induced to differentiate into neurons over 13 days in the presence of NB‐DNJ (25 μM) or PPMP (2.5 μM) were analysed by cytofluorometry with antibodies directed against the ganglioside GT1b. Cytofluorimetric profiles are shown for cells treated with NB‐DNJ (cyan), or PPMP (orange) or with vehicle (grey). Arrows indicate the direction of changes induced by each treatment.
- E14‐mESCs were kept in an undifferentiated state (day 0) or induced to differentiate into neurons over 13 days in the presence of NB‐DNJ (25 μM), PPMP (2.5 μM), or vehicle (methanol). Subsequently, cells were lysed and lysates were processed for SDS–PAGE and immunoblotting using antibodies against the stemness markers Oct‐4, and Nanog and the neuronal marker Tuj‐1.
- E14‐mESCs induced to differentiate into neurons in the presence of Myriocin (2.5 μM) or Fumonisin B1 (FB1) (25 μM) were analysed as in (C). Cytofluorimetric profiles are shown for cells treated with Myriocin (red), or FB1 (purple) or with vehicle (grey). Arrows indicate the direction of changes induced by treatments.
- E14‐mESCs in an undifferentiated state (day 0) or induced to differentiate into neurons in presence of Myriocin (2.5 μM), Fumonisin B1 (FB1) (25 μM), or vehicle (methanol). Subsequently, cells were lysed and lysates were processed as in (D).
- E14‐mESCs induced to differentiate into neurons and subjected every 3 days to GM3S silencing by transfecting specific siRNA for murine GM3S mRNA (siGM3S) were analysed by cytofluorometry as in (C). Cytofluorimetric profiles are shown for cells treated with non‐targeting siRNA (grey), or with specific siGM3S (green). Arrows indicate the direction of changes induced by treatments.
- E14‐mESCs were induced to differentiate into neurons and transfected every 3 days with siGM3S were subjected to RNA extraction and RT–PCR to evaluate the efficiency of murine GM3S silencing. Data are means ± SD from two independent experiments.
- E14‐mESCs treated as in (G) were lysed, and lysates were processed for SDS–PAGE and immunoblotting as in (D).
The role of the decrease in globo‐series GSLs in neural differentiation was then evaluated. To this end, different exogenous GSLs were administered to E14‐mESCs during differentiation. As shown in Fig 2D, treatment with globo‐series GSLs (i.e. Gb3 and Gb4) specifically inhibited the induction of the neural marker Tuj‐1 and the reduction in the stemness markers. Furthermore, while control E14‐mESCs differentiated into distinct neural and glial cell populations, Gb3‐treated E14‐mESCs failed to effectively differentiate in any of them (Appendix Fig S1), indicating that globo‐series GSLs counteract neural commitment.
Gb3 administration also inhibited GSL metabolic reprogramming as it attenuated both the GM3S up‐regulation and the Gb3S down‐regulation, which resulted in ~60% decrease in the GM3S/Gb3S mRNA ratio (Fig 2E). As a consequence, the levels of the ganglio‐GSL GT1b were strongly decreased in Gb3‐treated cells while that of Gb4 and Forsmann remained high after the induction of neural differentiation (Fig 2F). Along similar lines, by exploiting the capability of B‐subunits of Shiga toxin (ShTxB) and Cholera toxin (ChTxB) to bind to Gb3 and the ganglio‐GSL GM1, respectively (Heyningen, 1974; Jacewicz et al, 1986), we found that the more exogenous Gb3 individual cells took up, the less GM1 was displayed at their cell surfaces (Fig 2G), suggesting that globo‐series GSLs suppress ganglio‐series GSL production in individual cells.
Single‐cell variation in GSL production in non‐neural cells
Similar to what observed in neural differentiation, non‐neural cells are reported to produce ganglio‐ and globo‐GSLs in a mutual exclusive fashion when evaluated at the single‐cell level (Majoul et al, 2002). Thus, ganglio‐ or globo‐series GSL levels in the easy‐to‐manipulate HeLa cells were evaluated using fluorescently labelled ShTxB and ChTxB.
As previously reported for other cell lines (Majoul et al, 2002), individual HeLa cells show mutual exclusion in the expression of either Gb3 or GM1 (Fig 3A). Nonetheless, while a dependence of Gb3 or GM1 production on cell cycle phase was found in other cell lines with GM1 being produced predominantly by cells in G0/G1 phase and Gb3 by cells in G2/M phase (Majoul et al, 2002), when the G2/M phase marker phospho‐histone H3 (p‐H3) was evaluated in ShTxB‐ and ChTxB‐positive HeLa cells, no significant enrichment was found (Fig 3B). Moreover, even though local crowding in cell populations (i.e. local cell density) impacts on lipid composition (Frechin et al, 2015) and GSL production (Snijder et al, 2009), when the distribution of ShTxB‐ and ChTxB‐positive HeLa cells was considered along with cell crowding, local cell density failed to account for mutually exclusive toxin binding (Fig 3C).
Figure 3. GSL production in non‐neural cells at the single‐cell level.
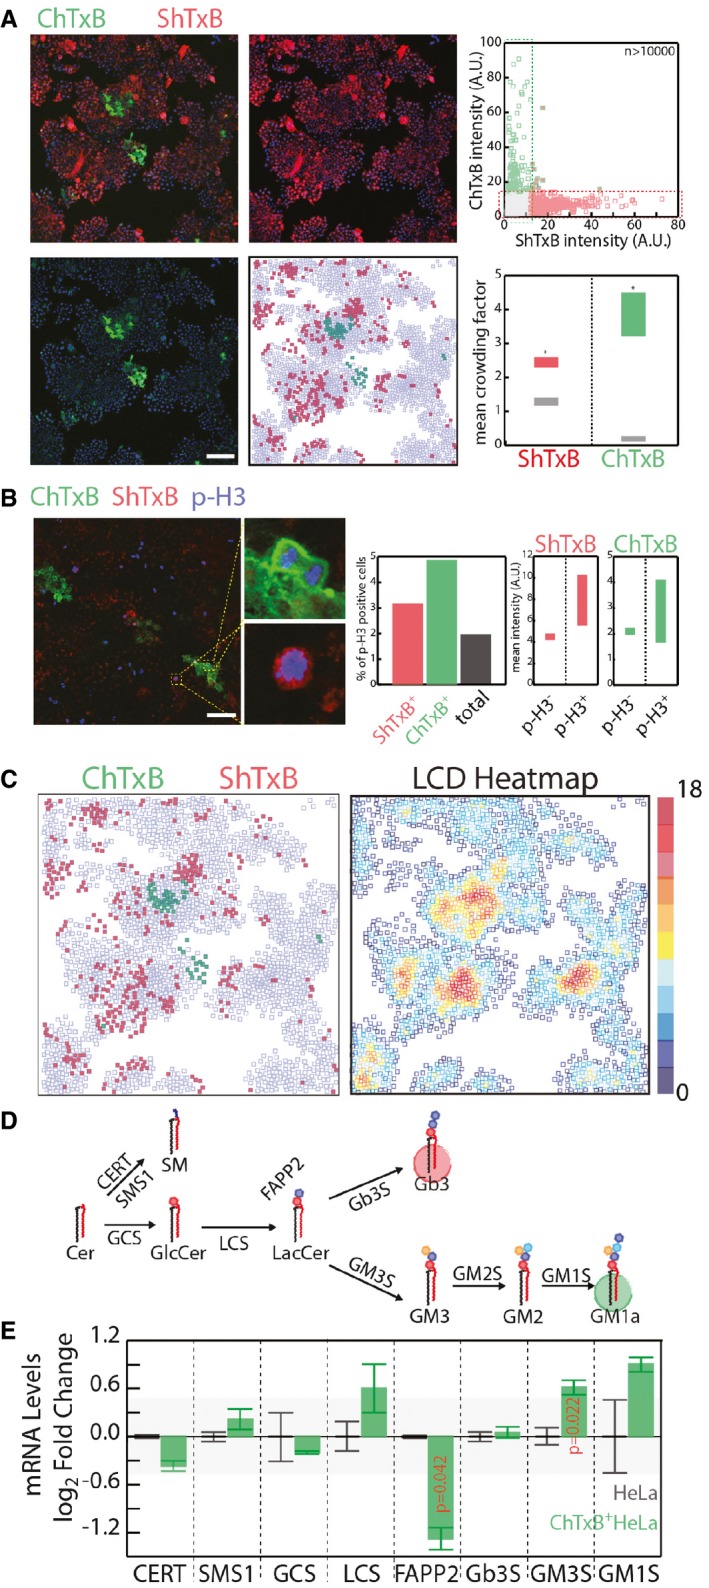
- HeLa cells were fixed and stained with ChTxB‐Alexa488 (green), ShTxB‐Cy3 (red), and DAPI (blue). Acquired confocal images were segmented by CellProfiler software (Shannon et al, 2003), as detailed in the Appendix. Mean ChTxB‐ and ShTxB‐associated fluorescence intensity was calculated for each cell. Cells with ChTxB or ShTxB fluorescence intensity ≥ 15% maximal recorded fluorescence intensity were considered ChTxB‐positive (green squares), ShTxB‐positive (red squares), or double‐positive (green‐edged red squares), with double‐negative cells represented by empty squares (central‐low panel). Scale bar, 100 μm. Upper right: ChTxB versus ShTxB fluorescence mean intensity for 10,767 individual cells as a scatter plot. Bottom right: as a measure of the degree of clustering of ChTxB (or ShTxB)‐positive cells, the colony factor (defined in Appendix Methods) was calculated for 272 ChTxB‐positive and 2,334 ShTxB‐positive cells. The mean crowding factors ± 3 × SEM for ChTxB‐positive cells (green rectangle) and ShTxB‐positive cells (red rectangle) are indicated. The experimentally obtained colony factors were then compared with the randomly expected colony factors, as defined in Appendix Methods (lower right panel, grey rectangles). *P ≤ 0.05.
- Left panels: HeLa cells were fixed and subsequently stained with ChTxB‐Alexa488 (green), ShTxB‐Cy3 (red), anti‐phospho‐Ser10 histone‐H3 (pH3) as a marker of G2/M phase cells (blue) and DAPI (not shown). Insets show examples of pH3+/ChTxB+ and pH3+/ShTxB+ cells, which indicate that both ChTxB positivity and ShTxB positivity are compatible with G2/M phase cells. Acquired confocal images were segmented using the CellProfiler software (Shannon et al, 2003). Middle panel: mean pH3‐, ChTxB‐, and ShTxB‐associated fluorescence intensities were calculated for 4,051 cells. Individual cells showing an associated ChTxB or ShTxB fluorescence intensity ≥20% (pH3) and ≥15% (ShTxB, ChTxB) maximal recorded fluorescence intensity were considered pH3‐, ChTxB‐, and ShTxB‐positive. The percentages of pH3+ cells in the total population (black column) and in the ShTxB+ (red) and ChTxB+ (green) populations are reported. Right panels: the ChTxB and ShTxB associated mean intensities in the pH3+ and pH3− cell subpopulations. Scale bar, 100 μm.
- The image dataset obtained in (A) was used to correlate ChTxB and ShTxB staining with local cell density (LCD; defined as the number of cells within a 50 × 50‐pixel [69.19 × 69.19 μm] square drown around each cell) for each individual cell imaged. ChTxB‐ and ShTxB‐positive cell distribution obtained from a representative image (left) and the LCD heatmap (right) obtained for the same image.
- Schematic representation of the GSL synthetic pathway in HeLa cells. GCS, GlcCer synthase; LCS, LacCer synthase; Gb3S, Gb3 synthase; GM3S, GM3 synthase; SMS1, sphingomyelin synthase 1; CERT, ceramide transfer protein; FAPP2, four phosphate adaptor protein 2.
- Transcriptional profile of GSEs and accessory factors (i.e. CERT, FAPP2) in ChTxB+ HeLa cells (isolated as reported in the Appendix), evaluated by qPCR. mRNA levels are expressed as log2‐fold changes ± SD with respect to unsorted HeLa cells. The background shaded area delimits values ranging from −0.5 to 0.5 log2 fold change. Data are means ± SD from at least three independent experiments.
As ShTXB‐positive and ChTXB‐positive cells have distinct global gene expression profiles (Majoul et al, 2002), the expression GSEs or accessory factors (i.e. the lipid transfer proteins CERT (Hanada et al, 2003) and FAPP2 (D'Angelo et al, 2007, 2013b) involved in GSL synthesis (Fig 3D) was evaluated in ChTxB‐positive HeLa cells. As shown in Fig 3E, ChTxB‐positive cells have reduced expression of FAPP2, which promotes globo‐series GSL synthesis (D'Angelo et al, 2007, 2013b), and increased expression of GM3S compared to unsorted HeLa cells.
Moreover, when the few ShTxB and ChTxB double‐positive cells were isolated (Fig EV2A left panel), they evolved towards ShTxB or ChTxB mutually exclusive positive phenotypes within a few cell generations (Fig EV2A right panel), suggesting that the double‐positive state is unstable. In addition, we noted that neighbouring cells tend to form Gb3‐positive or GM1‐positive cell colonies (Fig 3A). When analysed by correlative video‐light microscopy for lineage tracking, such colonies were found to derive in most cases from a single progenitor cell (Fig EV2B; Movie EV1), indicating that, once established, a specific GSL state (i.e. globo‐ or ganglio‐positive) can be maintained through several cell generations. Altogether, these data indicate that, in a way similar to what happens in neural differentiation, GSL synthesis in non‐neural cells is controlled by a coordinated transcriptional programme leading to bistable metabolic configurations.
Figure EV2. GSL production in non‐neural cells recapitulates the GSL switch at the single‐cell level.
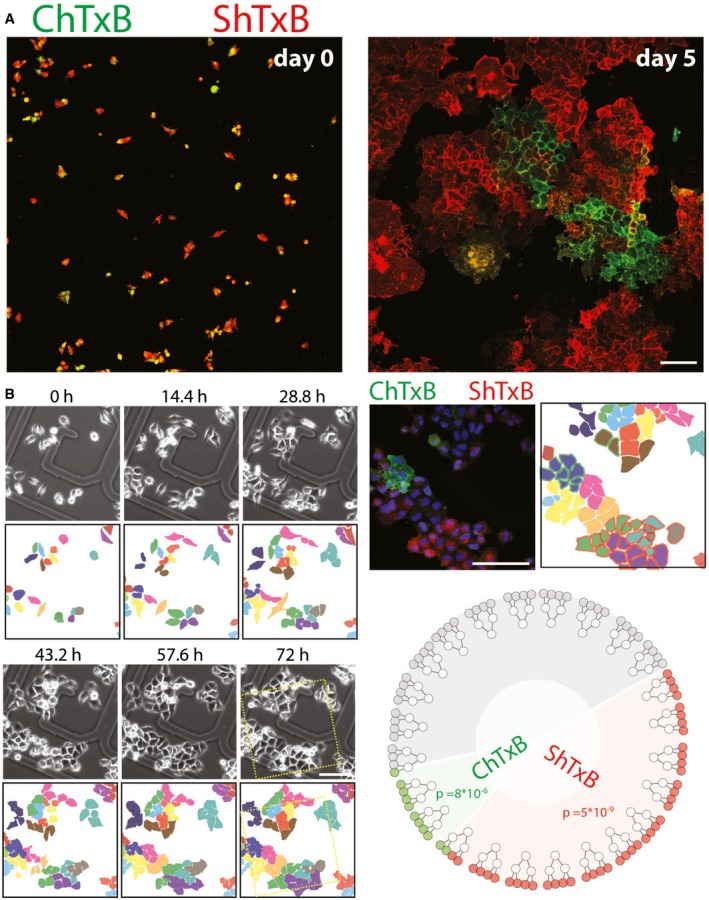
- ChTxB and ShTxB double‐positive cells were isolated by FACS and seeded, and either imaged immediately (left panel) or after 5 days of growth (right panel) as in Fig 3A. Scale bar, 50 μm.
- HeLa cells plated on gridded glass‐bottomed tissue culture dishes and imaged by phase contrast microscopy over 72 h (see also Movie EV1). After fixing, the cells were stained with Alexa488‐ChTxB (green), Cy3‐ShTxB (red), and DAPI (blue). Confocal images were acquired of the same fields imaged by video microscopy. Scale bar, 50 μm. Twenty‐four cells were followed for two cell divisions, to yield 96 daughter cells, where the ShTxB positivity and ChTxB positivity were assessed by confocal microscopy. The dendrogram (bottom right) shows how 10/24 cells gave only ShTxB‐positive offspring, 2/24 gave only ChTxB‐positive offspring, 10/24 gave double‐negative offspring, and only two parental cells gave mixed offspring. The probability of 10/24 parental cells to randomly yield a ShTxB‐only positive offspring and the probability of 2/24 parental cells to randomly yield a ChTxB‐only positive offspring are indicated in the dendrogram and are calculated as detailed in Appendix Methods.
Gb3 represses GM3S expression
To study how this coordination is achieved, the GSL synthetic pathway was perturbed by silencing GSEs and factors involved in this metabolism (Fig 4A and B). We thus systematically silenced HeLa cells for the expression of CERT; the sphingomyelin synthase 1 (SMS1); the glucosylceramide synthase (GCS); the LacCer synthase (LCS); FAPP2; Gb3S and GM3S; and measured sphingolipid levels (Fig 4A). Concomitantly, HeLa cells treated as in Fig 4A were processed for mRNA extraction and qPCR‐based evaluation of the effect of changes in GSL composition on GSE expression (Fig 4B). Strikingly, all the conditions that led to a robust decrease in cellular Gb3 content (Fig 4A) (i.e. GCS‐KD; LCS‐KD; FAPP2‐KD; and Gb3S‐KD) increased GM3S mRNA levels (Fig 4B).
Figure 4. Gb3 represses GM3S Promoter.
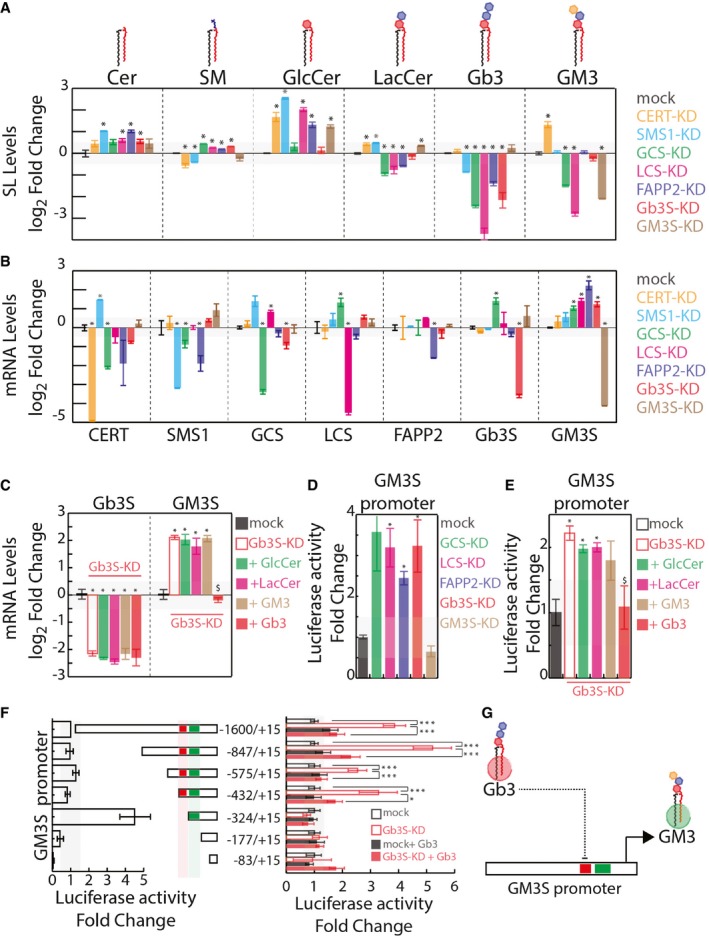
- Effects of silencing GSEs and accessory factors on cellular sphingolipid (SL) composition (measured as detailed in the Appendix and expressed as log2‐fold changes ± SEM to mock‐treated cells from at least three independent experiments). *P ≤ 0.05.
- Effects of silencing GSEs and accessory factors on mRNA levels of other GSEs and accessory factors (measured as detailed in the Appendix and expressed as log2‐fold changes ± SEM to mock‐treated cells from at least three independent experiments). *P ≤ 0.05.
- HeLa cells were either mock‐treated or silenced for Gb3S expression. Gb3S‐KD cells were then either vehicle‐treated or fed with the indicated GSLs (10 μM). GM3S and Gb3S mRNA levels (as log2‐fold changes ± SEM to mock) under the different treatments are reported. *P ≤ 0.05 compared to mock; $ P ≤ 0.05 compared to Gb3S‐KD. Data are from at least three independent experiments.
- HeLa cells transfected with a plasmid containing a genomic region of 1600‐bp upstream of the GM3S TSS cloned upstream of a luciferase reporter were silenced for factors involved in Gb3 synthesis or GM3S as control. Normalised luciferase activity was recorded as detailed in Appendix and is reported as fold changes ± SEM to mock‐treated cell‐associated activity. *P ≤ 0.05 compared to mock. Data are from at least three independent experiments.
- HeLa cells transfected as in (C) were silenced for Gb3S expression and fed with the indicated GSLs (10 μM). Normalised luciferase activity is reported as fold change ± SEM to mock‐treated cell‐associated activity. *P ≤ 0.05 compared to mock; $ P ≤ 0.05 compared to Gb3S‐KD. Data are from at least three independent experiments.
- Left panel: normalised luciferase activity associated with truncated versions of the GM3S promoter was compared to pGL3‐1600/+15 activity. Right panel: the same promoter fragments were transfected into HeLa cells as mock‐treated or Gb3S‐KD, and either vehicle‐treated or fed with 10 μM Gb3. Normalised luciferase activity was compared to that in mock‐treated HeLa cells for each fragment. *P ≤ 0.05, ***P ≤ 0.001. Data are means ± SEM of at least three independent experiments.
- Schematic representation of Gb3‐operated repression on GM3S promoter activity.
Then, Gb3S knocked down (Gb3S‐KD) HeLa cells were treated with exogenous GSLs (i.e. glucosylceramide [GlcCer]; LacCer, Gb3, and GM3), and GM3S mRNA levels were measured. As shown in Fig 4C, the addition of Gb3 to the Gb3S‐KD cells specifically induced down‐regulation of GM3S. Hence, the GM3S promoter was cloned upstream of a luciferase reporter gene and its activity was measured under conditions of low and high cellular levels of Gb3. As shown in Fig 4D, KD conditions lowering Gb3 levels induced an increase in GM3S promoter activity that was specifically counteracted by the addition of exogenous Gb3 to Gb3S‐KD cells (Fig 4E), which suggests a role for the globo‐series GSLs in the repression of GM3S expression through the modulation of its promoter activity.
Truncated versions of the GM3S promoter were then produced and tested in conditions where Gb3 levels were perturbed. As shown in Fig 4F, the GM3S promoter contains a repressive (red box, −432 to −324) and a promoting region (green box, −324 to −177). Of note, the sensitivity of the GM3S promoter to the changes in Gb3 levels depends on the presence of the repressive region. Indeed, GM3S promoter fragments not containing the −432 to −324 region were no longer sensitive to fluctuations in Gb3 levels (Fig 4F, right panel). Thus, Gb3 maintains the GM3S promoter in a repressed state through a mechanism that requires the action of regulatory factors on a discrete region of the GM3S promoter (Fig 4G).
Gb3 controls GM3S expression via AUTS2
To understand which factors are involved in the control of GM3S transcription, we looked for genes other than GM3S where their expression is influenced by Gb3 levels, with the hypothesis that some of these directly control GM3S expression.
Transcriptional changes were analysed by microarrays under conditions where the GSL synthetic pathways are perturbed in HeLa cells as in Fig 4A (Appendix Fig S2). By this procedure, we isolated a group of six genes that were commonly and specifically up‐regulated under conditions leading to decreased Gb3 (Fig 5A). Interestingly, three of these six genes are involved in neurogenesis (i.e. AUTS2, carboxy‐terminal domain small phosphatase 2 [CTDSP2], and neuroligin 4, X‐linked [NLGN4X]; Han et al, 2012; Shi et al, 2013; Gao et al, 2014), and mutations in two of them result in neurological disorders in humans (i.e. AUTS2 and NLGN4X; Jamain et al, 2003; Kalscheuer et al, 2007; Beunders et al, 2013; Fig 5A).
Figure 5. Gb3 Controls GM3S Expression via AUTS2.
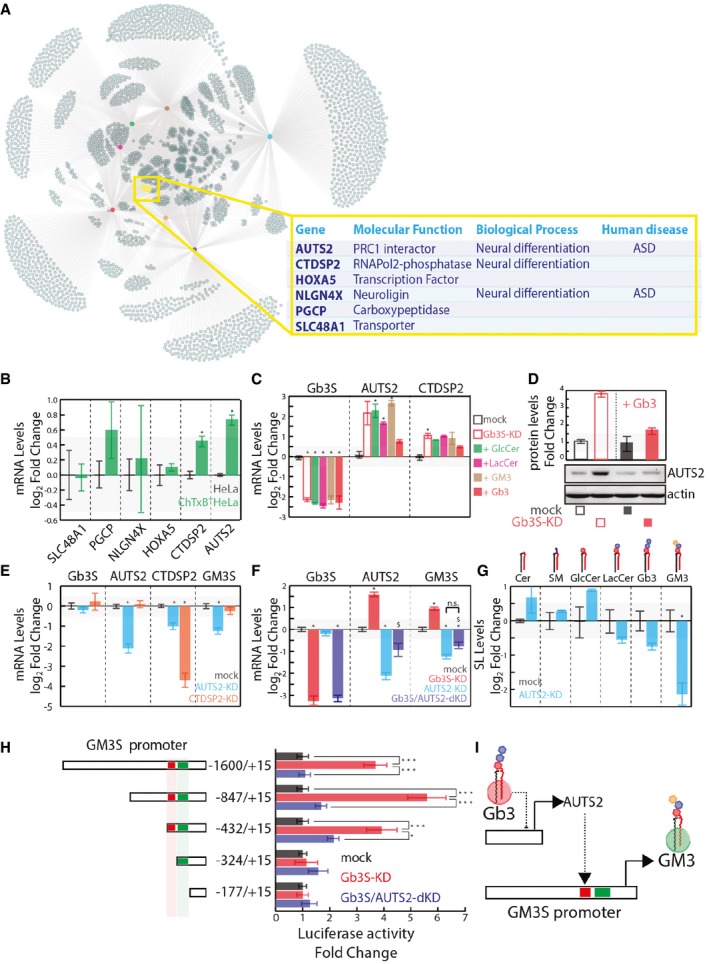
- Up‐regulated genes as defined in Appendix Fig S2 and Dataset EV1 were used to build a network, hubs are conditions colour coded as indicated, nodes are up‐regulated genes, and edges link each condition with the up‐regulated genes. The yellow subset represents genes commonly up‐regulated in GCS‐KD, LCS‐KD, FAPP2‐KD, and Gb3S‐KD and not up‐regulated in GM3S‐KD, CERT‐KD, and SMS1‐KD.
- mRNA expression of the gene set defined in (A) in ChTxB+ HeLa cells (isolated as reported in the Appendix), expressed as log2 mRNA fold changes ± SD to the unsorted parental population from three independent experiments. *P ≤ 0.05.
- Gb3S‐KD HeLa cells were either vehicle‐treated or fed with different GSLs (i.e. GlcCer, LacCer, GM3, Gb3). CTDSP2 and AUTS2 mRNA levels (log2‐fold changes ± SD to mock from at least three independent experiments) are reported. *P ≤ 0.05 compared to mock.
- HeLa cells mock‐treated or Gb3S‐KD were either vehicle‐treated or fed with 10 μM Gb3 (16 h) and lysed, with the protein extracts analysed for AUTS2 protein expression.
- HeLa cells silenced for the expression of AUTS2 or CTDSP2 were processed for mRNA extraction and qPCR. Gb3S, AUTS2, CTDSP2, and GM3S mRNA levels under the different conditions are reported, as log2‐fold changes to mock. Data are means ±SEM of at least three independent experiments. *P ≤ 0.05.
- HeLa cells were silenced for AUTS2 both in control cells and in cells silenced for Gb3S. Gb3S, AUTS2, and GM3S mRNA levels are expressed as log2‐fold changes to mock‐treated cells. Data are means ± SD from at least three independent experiments. *P ≤ 0.05 to mock; $ P ≤ 0.05 to Gb3S‐KD; n.s., non significant.
- Effects of AUTS2 silencing on cellular SL composition (expressed as log2‐fold changes with respect to mock‐treated cells). Data are means ±SEM of at least three independent experiments. *P ≤ 0.05.
- HeLa cells transfected with the indicated truncated forms of GM3S promoter cloned upstream of the luciferase reporter gene were either silenced for Gb3S alone or in combination with AUTS2. Normalised luciferase activity was compared to that obtained in mock‐treated HeLa cells for each fragment. Data are means ±SEM of at least three independent experiments. ***P ≤ 0.001, *P ≤ 0.05.
- Schematic representation of the Gb3‐controlled AUTS2‐dependent GM3S expression.
When the mRNA levels of these six genes were evaluated in ChTxB‐positive cells, those of AUTS2 and CTDSP2 were found significantly increased (Fig 5B). Also, their up‐regulation in Gb3S‐KD was specifically counteracted by administration of Gb3 (Fig 5C and D), and thus, their involvement in the control of GM3S expression was analysed. As shown in Fig 5E, AUTS2‐KD (not CTDSP2‐KD) reduced GM3S expression. Moreover, as shown in Fig 5F, AUTS2 silencing abolishes GM3S up‐regulation induced by Gb3S KD, which indicates that Gb3 controls GM3S expression through AUTS2. Along similar lines, the silencing of AUTS2 leads to reduced GM3 production (Fig 5G) and counteracts the increase in the activity of the GM3S promoter fragments that contained the −432 to −324 repressive region in Gb3S KD (Fig 5H).
To understand whether Gb3 specifically or globo‐series GSLs in general control AUTS2 expression, we first treated HeLa cells with siRNAs directed against GSE acting downstream Gb3S in the globo‐GSL metabolic branch (i.e. Gb4 synthase [Gb4S]; Gb5 synthase [Gb5S]; and Forssman antigen synthase [ForssmanS]) to manipulate globo‐GSLs synthesis and measured the effects on AUTS2 expression. Nonetheless, HeLa cells do not appear to express these GSEs and their metabolic products to detectable levels and siRNAs directed against them fail to induce any measurable GSE silencing and AUTS2 up‐regulation (Fig EV3A). We thus decided to treat Gb3S‐KD cells with exogenous Gb4 to evaluate the effect of complex globo‐series GSLs on AUTS2 expression. As shown in Fig EV3B, Gb4 treatment partially counteracted Gb3S‐KD‐induced AUTS2 up‐regulation.
Figure EV3. Globo‐series GSLs regulate AUTS2 expression.

- Effects of silencing globoside‐synthesising enzymes Gb3S, Gb4 synthase (Gb4S), Gb5 synthase (Gb5S), and Forssman antigen synthase (ForssmanS or ForssmS) on mRNA levels of AUTS2. Silenced cells were subjected to RNA extraction and RT–PCR to evaluate both the efficiency of silencing and AUTS2 mRNA up‐regulation (measured as detailed in the Appendix and expressed as log2‐fold changes to mock‐treated cells). Data are means ± SD from at least three independent experiments. *P ≤ 0.05 compared to mock treated cells.
- Effect of exogenous Gb3 and Gb4 on AUTS2 expression in Gb3S‐KD cells. HeLa cells were either mock‐treated or silenced for Gb3S expression. Gb3S‐KD cells were then either vehicle‐treated or fed with the indicated GSLs (10 μM). Gb3S and AUTS2 mRNA levels (as log2‐fold changes to mock) under the different treatments are reported. Data are means ± SD from at least three independent experiments. *P ≤ 0.05 compared to Gb3S‐KD.
These data imply that on the one hand globo‐series GSLs negatively control AUTS2 expression, and on the the other hand, that AUTS2 positively controls GM3S expression by de‐repressing its promoter activity. As a consequence, AUTS2 regulates the direction of the GSL metabolic flux (Fig 5I).
AUTS2 controls histone acetylation at the GM3S promoter
AUTS2 has been reported to localise to the cell nucleus (Bedogni et al, 2010) as well as to the cytosol (Hori et al, 2014). As shown in Fig 6A, in HeLa cells, AUTS2 decorates discrete nuclear puncta that co‐localise with the polycomb repressive complex 1 (PRC1) component RING1B (Satijn et al, 1997; Fig 6A) and with the PRC‐dependent histone repressive marker H3K27me3 (Kuzmichev et al, 2002; Fig 6B). AUTS2‐positive puncta are juxtaposed to foci positive for the histone activatory marker H3K27Ac (Wang et al, 2008; Fig 6B), while they do not co‐localise with nuclear proteins MeCP2 (Matarazzo et al, 2009), and HP1alpha (Saunders et al, 1993; Fig 6A), and with the histone marker H3K4me3 (Schneider et al, 2004; Fig 6B). When analysed by nanoscopy (Vicidomini et al, 2011), AUTS2 puncta appear in the shape of “rings” (Fig EV4A). Consistently by immuno‐electron‐microscopy, AUTS2 was found to decorate the periphery of discrete heterochromatic granules in the nucleus (Fig EV4B).
Figure 6. AUTS2 localises to polycomb bodies.
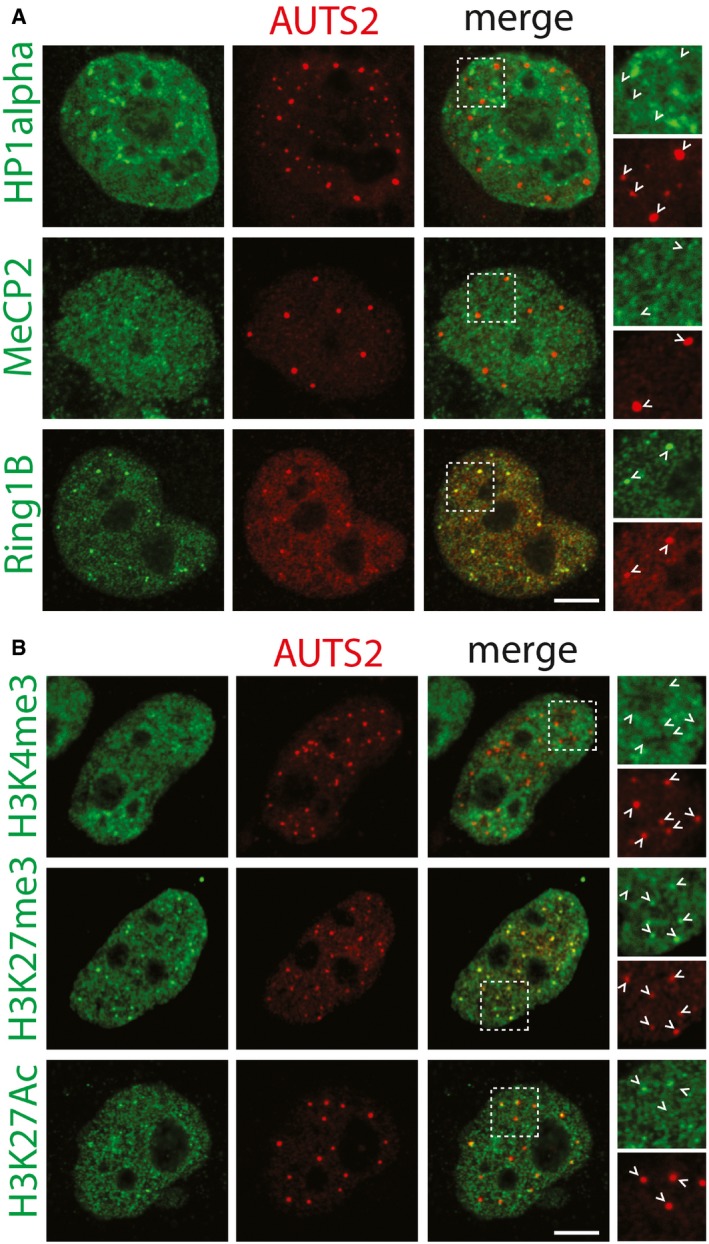
- Antibodies recognising endogenous MeCP2, HP1alpha, and Ring1B (green) were used to evaluate co‐localisation with AUTS2 detected by an anti‐Flag antibody (red). Scale bar, 5 μm. Arrowheads indicate AUTS2 positive puncta.
- Antibodies recognising H3K4me3, H3K27me3, and H3K27Ac (green) were used to evaluate co‐localisation with AUTS2 detected by an anti‐Flag antibody (red). Scale bar, 5 μm. Arrowheads indicate AUTS2 positive puncta.
Figure EV4. AUTS2 surrounds heterochromatic bodies in the nucleus.
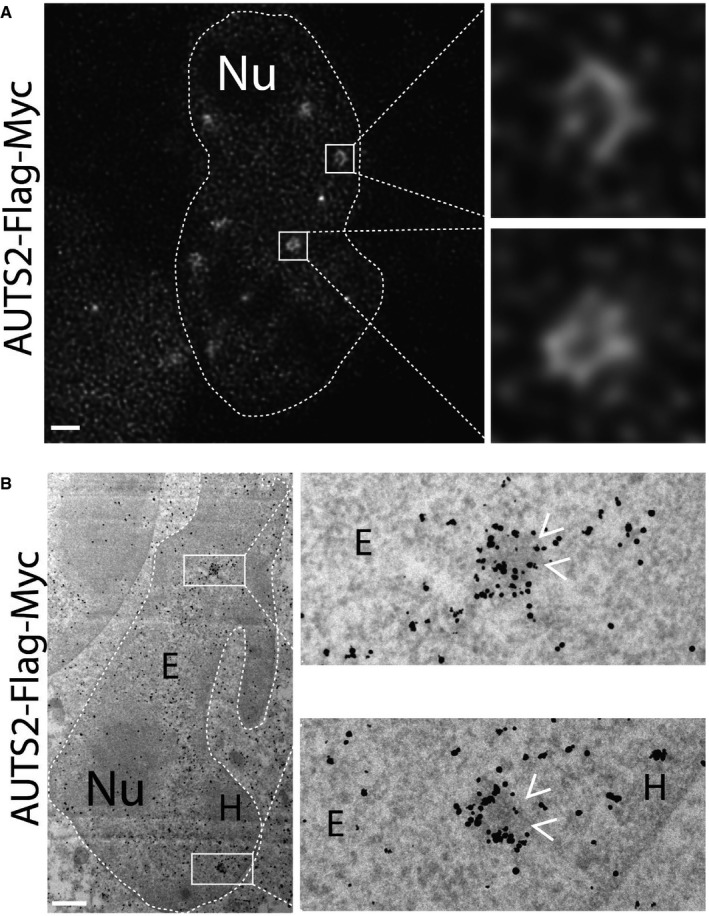
- AUTS2 localisation evaluated by gated‐STED nanoscopy using anti‐Flag antibody.
- HeLa cells expressing human AUTS2‐Flag‐Myc were processed for immuno‐electron microscopy as detailed in the Appendix. Antibody directed against Flag tag was used to detect the expressed protein. Arrowheads indicate the heterochromatic granules decorated by AUTS2.
In line with these localisation data, AUTS2 has been reported to de‐repress gene transcription by interacting with PRC1 components (Gao et al, 2012, 2014) that localise to punctate nuclear structures known as polycomb bodies (Saurin et al, 1998). Once bound to PRC1‐occupied loci, AUTS2 recruits the histone acetyltransferase p300, which promotes local histone acetylation, chromatin relaxation, and as a consequence activation of gene transcription (Gao et al, 2014).
When AUTS2 occupancy on GM3S promoter was investigated in HeLa cells by chromatin immunoprecipitation (ChIP), AUTS2 was found to bind at 1,600‐ to 400‐bp upstream of GM3S transcriptional starting site (TSS; Fig 7A). Moreover, AUTS2‐KD induced substantial decrease in H3K27 (Wang et al, 2008), H3K9/14 (Bernstein et al, 2005), and H4K5/8/12/16 acetylation (H4KAc) at GM3S promoter and specifically at the ‐400 repressive region, while Gb3S‐KD induced increased acetylation of both H3K9/14 and H4K5/8/12/16 (Fig 7B). On the contrary, AUTS2 or Gb3S KDs did not impact on other histone modifications at GM3S promoter (including the PRC1‐dependent H2AK119 ubiquitination (Gao et al, 2014, 2012; Fig 7B).
Figure 7. The Gb3–AUTS2 axis controls histone acetylation at GM3S promoter.
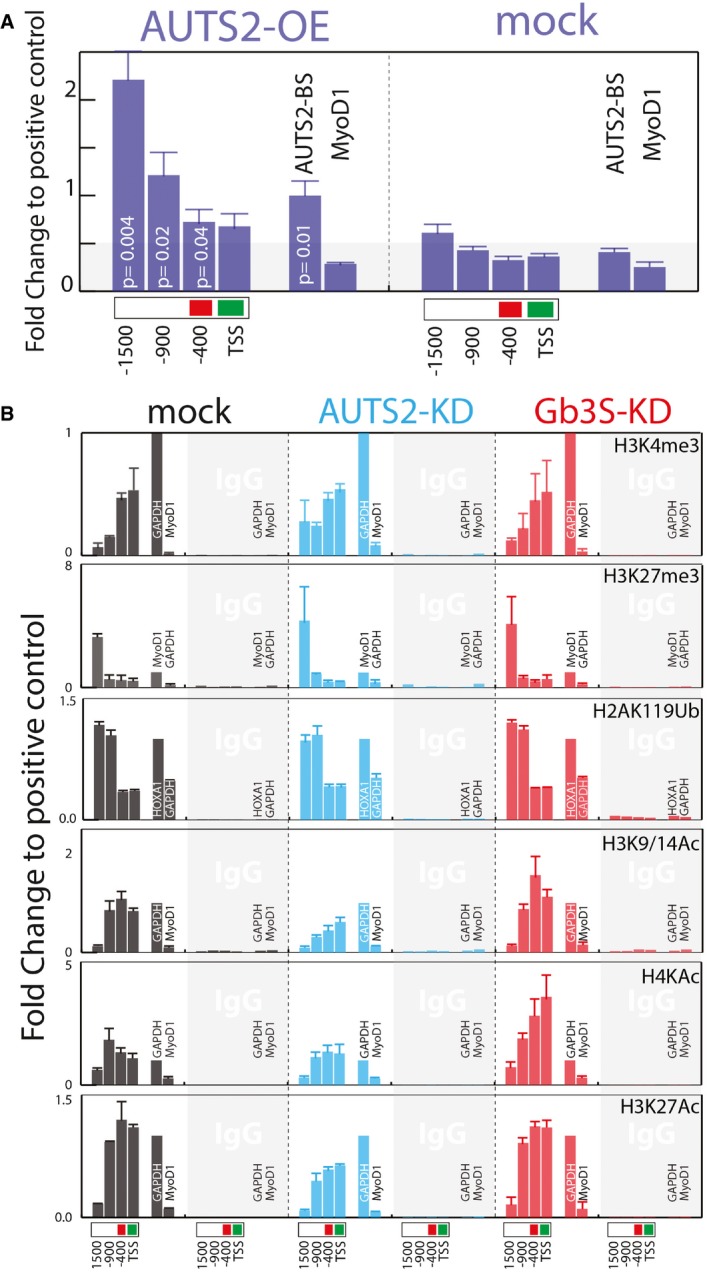
- AUTS2 binding to the GM3S promoter, as assessed by ChIP in HeLa cells expressing AUTS2‐Flag‐Myc. Immunoprecipitation was performed with an anti‐FLAG antibody. Chromatin immunoprecipitates were analysed by qPCR using primers specific for the indicated regions of the GM3S promoter. Primers specific for a previously described (Gao et al, 2014) AUTS2 binding site (AUTS2‐BS; chr10: 31608364–31608595) or MyoD1 promoter were used as positive and negative controls, respectively. Data are means ± SEM of at least three independent experiments.
- Effect of AUTS2 and Gb3S KD on histone modifications at the indicated GM3S promoter regions. ChIP experiments were performed with the indicated antibodies (see Appendix Table S3). Genomic regions at the GAPDH, HOXA1, and MyoD1 promoters (see Appendix Table S5) were used as the positive and negative controls according to the antibodies used. Data are expressed as fold changes to the positive control. Data are means ± SD of at least three independent experiments.
We thus investigated whether histone acetylation affects GM3S expression. To this, the AUTS2‐recruited histone acetyltransferase p300 (Gao et al, 2014) or the histone deacetylases (HDAC1, 2) were silenced and the effects of these treatments on GM3S expression were measured. As shown in Appendix Fig S3A, p300 KD markedly reduced GM3S expression (by ~70%) and rendered the GM3S transcription insensitive to Gb3 depletion. Likewise, HDAC1/2 combined silencing (HDAC1/2‐dKD) induced a strong (~10‐fold) increase in GM3S mRNA levels compared to the mock‐treated cells, and this increase could not be counteracted by AUTS2 KD (Appendix Fig S3B). Moreover, GM3 lipid levels were decreased and increased under p300 KD and HDAC1/2 dKD conditions, respectively, as was the binding of ChTxB to cells (Appendix Fig S3C and D). Along similar lines, the treatment with the HDAC inhibitor suberoylanilide hydroxamic acid (SAHA) (5 μM) induced (i) strong up‐regulation of GM3S (Appendix Fig S4A), which could no longer be regulated by the Gb3–AUTS2 axis, (ii) an increase in GM3 lipid levels (Appendix Fig S4B), and (iii) a transition of HeLa cells to a ChTxB‐positive state (Appendix Fig S4C).
These data demonstrate that Gb3 controls GM3S transcription via AUTS2 and by influencing histone acetylation at GM3S promoter. Nevertheless, AUTS2 has been reported to bind to the human genome at 5,563 distinct locations that intercept with ~4,000 gene promoters, possibly inducing local histone acetylation and transcriptional activation (Gao et al, 2014).
We therefore investigated whether cellular Gb3 levels globally influence histone acetylation at AUTS2‐bound promoters. By ChIP‐seq, we analysed H3K9/K14 acetylation in Gb3S and AUTS2 KDs at 15,040 genomic locations 1,896 of which have been reported to be occupied by AUTS2 (Gao et al, 2014). As shown in Fig EV5A, Gb3S KD and AUTS2 KD did not induce generalised changes in the H3K9/K14 acetylation pattern. Nevertheless, when the Gb3S KD/mock and the AUTS2 KD/mock H3K9/K14Ac ChIP‐seq signal ratios at AUTS2‐bound genomic locations were evaluated, Gb3S depletion was found to induce a specific and significant increase in H3K9/K14 acetylation, while AUTS2‐KD had the opposite effect (Fig EV5B–D).
Figure EV5. The Gb3–AUTS2 axis controls histone acetylation at neural genes promoters.
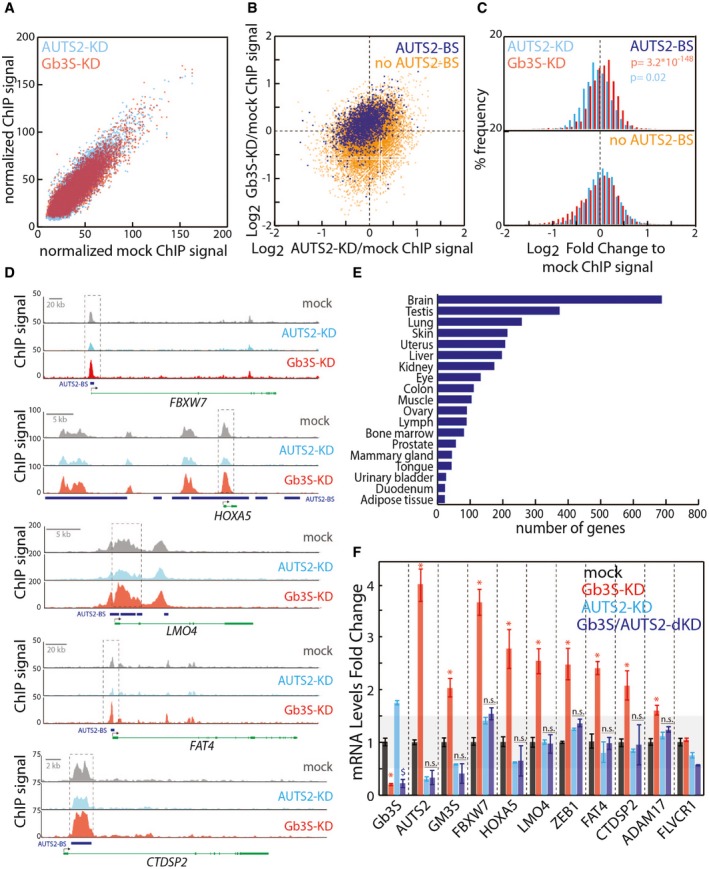
- Scatter plot of normalised ChIP‐seq values associated with 15,040 common H3K9/14Ac peaks in mock‐treated HeLa cells compared to Gb3S‐KD cells (red) or AUTS2‐KD cells (cyan) (see Dataset EV2 for peak positions and values data; this dataset has been registered to GEO database with the following accession number GSE107044).
- Scatter plot of Gb3S‐KD/mock versus AUTS2‐KD/mock normalised log2 ChIP‐seq value ratios for 1,896 common H3K9/14Ac peaks bound by AUTS2 (blue) and 13,144 non‐AUTS2‐bound peaks (orange).
- % frequency distribution of Gb3S‐KD/mock (red) and AUTS2‐KD/mock (cyan) log2 ChIP‐seq value ratios for AUTS2‐bound and non‐AUTS2‐bound H3K9/14Ac peaks.
- Representative H3K9/14Ac ChIP‐seq profiles for AUTS2‐bound promoters. Blue rectangles indicate AUTS2 binding sites; black arrows indicate transcriptional start sites.
- Tissue distribution of genes intercepted by the 1,809 H3K9/14Ac peaks occupied by AUTS2 (source, David Ontology).
- HeLa cells silenced for AUTS2 in control cells and in cells silenced for Gb3S. qPCR was performed to determine knock‐down efficiencies and the mRNA changes in selected genes intercepted by the H3K9/14Ac peaks occupied by AUTS2. mRNA levels are expressed as log2‐fold changes with respect to mock‐treated cells. Data are means ± SEM of at least three independent experiments. *P ≤ 0.05 to mock; $ P ≤ 0.05 to AUTS2‐KD.
Interestingly, many of the modulated AUTS2‐bound peaks were located at the promoters of genes expressed in brain (Fig EV5E) some of which are involved in neural differentiation (Yen et al, 2001; Huang et al, 2009; Hoeck et al, 2010; Han et al, 2012; Cappello et al, 2013; Hutlet et al, 2014; Palazuelos et al, 2014). Importantly, we found these genes to be up‐regulated in Gb3S‐KD cells by a mechanism that requires AUTS2 (Fig EV5F).
Thus, the globo‐series GSLs, by counteracting the expression of AUTS2, decrease histone acetylation at neuronal gene promoters repressing their transcription in HeLa cells. Is this mechanism also active during neural differentiation to control the GSL reprogramming and neurogenesis?
The Globo–AUTS2 axis controls the GSL switch and neural differentiation
Similarly, as in HeLa cells, we found that AUTS2 binds GM3S promoter in adult mouse brain (Fig 8A). Here, the AUTS2 binding site is also occupied by PRC1 (i.e. RING1B) and is decorated by activatory histone acetylations and not by standard PRC‐dependent modifications, compatibly with GM3S being an AUTS2 target in the central nervous system (Fig 8A). Interestingly, AUTS2 mRNA (Fig 8B) and protein levels (Fig 8C) increase during neural differentiation following globo‐series GSL drop, while globo‐series GSL administration specifically and completely prevents this increase (Fig 8C). Moreover, H3K27, H3K9/14, and H4K acetylations at AUTS2 binding site on GM3S promoter increase during neural differentiation (Fig 8D), suggesting that GM3S induction results from AUTS2‐dependent histone modifications at GM3S promoter.
Figure 8. The Globoside–AUTS2 Axis controls Neuronal Differentiation.
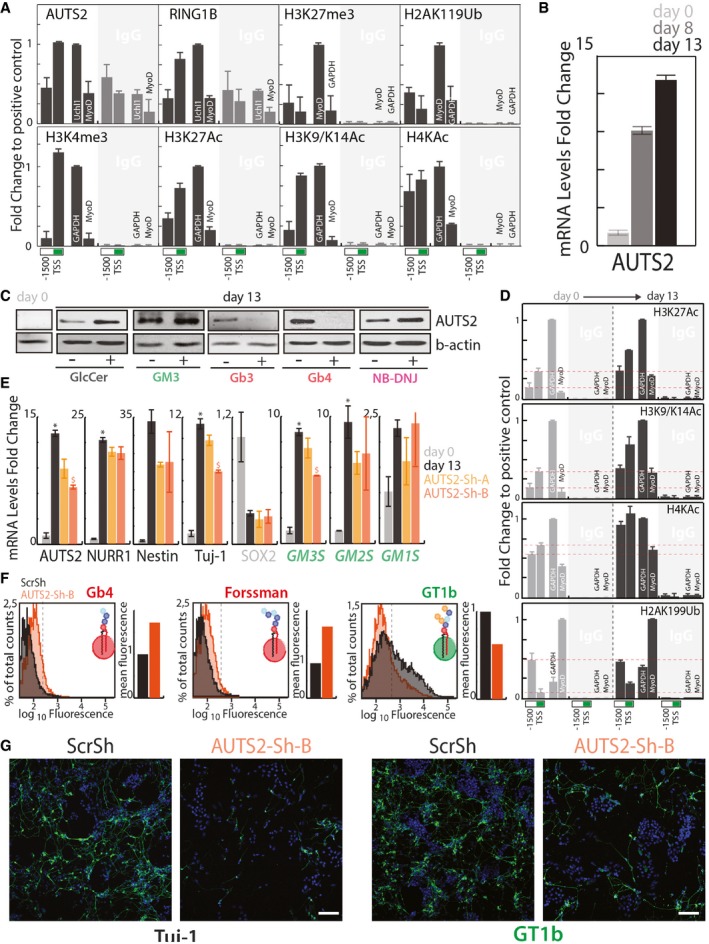
- AUTS2 and RING1B occupancy and histone modifications at the GM3S promoter, as assessed by ChIP in mouse brain. ChIP experiments were performed with the indicated antibodies (see Appendix Table S3). Chromatin immunoprecipitates were analysed by qPCR using primers specific for the indicated regions of the murine GM3S promoter. Primers specific for a previously described (Gao et al, 2014) AUTS2 binding site (Uchl1) or MyoD promoter were used as positive and negative controls, respectively, for AUTS2 and RING1B. Genomic regions at the GAPDH, and MyoD promoters (see Appendix Table S5) were used as the positive and negative controls according to the antibodies used. Data are expressed as fold changes to the positive control. Data are means ±SD of at least three independent experiments.
- E14‐mESCs treated as in Fig 2B were processed for RNA extraction at days 0, 8, and 13. The mRNA levels of AUTS2 were evaluated at different differentiation time points. Data are means ± SD of at least three independent experiments.
- E14‐mESCs were induced to differentiate to neurons in presence of the indicated GSLs (25 μM) NB‐DNJ (25 μM) or vehicle (methanol). Cells were lysed and lysates were processed for Western blotting using antibodies against AUTS2 and b‐actin.
- Histone acetylation at GM3S promoter during neural differentiation of E14‐mESCs. E14‐mESCs treated as in Fig 2B were processed for ChIP at days 0 and 13 cells with the indicated antibodies as in (A). Data are expressed as fold changes to the positive control. Data are means ±SD of two independent experiments. Red dotted lines indicate the relative histone modification levels at GM3S promter in non differentiated E14‐mESCs.
- E14‐mESCs infected with lentiviral vectors for the expression of either scrambled shRNA (ScrSh) or two shRNAs targeting murine AUTS2 (AUTS2‐Sh‐A, AUTS2‐Sh‐B) were induced to differentiate into neurons. mESCs kept in an undifferentiated state are referred to as day 0. qPCR was used to determine the mRNA levels of the indicated genes. Data are means ±SD of at least three independent experiments. *P ≤ 0.05, compared to day 0; $ P ≤ 0.05, compared to ScrSh.
- E14‐mESCs treated as in (D) were analysed by cytofluorometry with antibodies directed against globo‐series GSLs (i.e. Gb4, and Forssman) or the ganglioside GT1b. Cytofluorimetric profiles and normalised mean fluorescence are shown for each antibody for cells treated with ScrSh (black) or AUTS2‐Sh‐B (orange).
- mESCs treated as in (E) were processed for immunofluorescence and stained for Tuj‐1 (left) or GT1b (right). Scale bar, 50 μm.
Consequently, the role of AUTS2 in GM3S induction, GSL switch, and neural differentiation was evaluated. E14‐mESCs were infected with lentiviral vectors for the expression of either a scrambled shRNA (ScrSh) or two shRNAs that target the expression of AUTS2 (AUTS2‐Sh‐A, AUTS2‐Sh‐B) and induced to differentiate into neurons. As shown in Fig 8E, AUTS2‐Sh‐B treatment significantly reduced AUTS2 induction as well as that of the axonal marker Tuj‐1, reported to be an AUTS2 target (Gao et al, 2014). Interestingly, the induction of GM3S was also reduced in AUTS2‐Sh‐B‐treated cells. As a consequence, the production of ganglio‐series GSLs (i.e. GT1b) was reduced in AUTS2 silenced mESCs after neural differentiation (Fig 8F), suggesting that AUTS2 controls the production of ganglio‐series GSLs during neural differentiation.
When analysed by immunofluorescence, AUTS2‐Sh‐B‐treated mESCs yielded less neurons (Tuj‐1‐ or GT1b‐positive cells) after differentiation (Fig 8G). Along similar lines when the mRNA levels of GSEs and neuronal markers were measured in whole brains from wild‐type, AUTS2del8/+, and AUTS2del8/del8 mouse embryos (Hori et al, 2014) (E17.5) (n = 5), a significant decrease in GM3S mRNA levels was observed in AUTS2del8/del8 brains, suggesting that AUTS2 controls GM3S expression also in vivo (Fig EV6).
Figure EV6. AUTS2 controls GM3S expression in mouse brain.
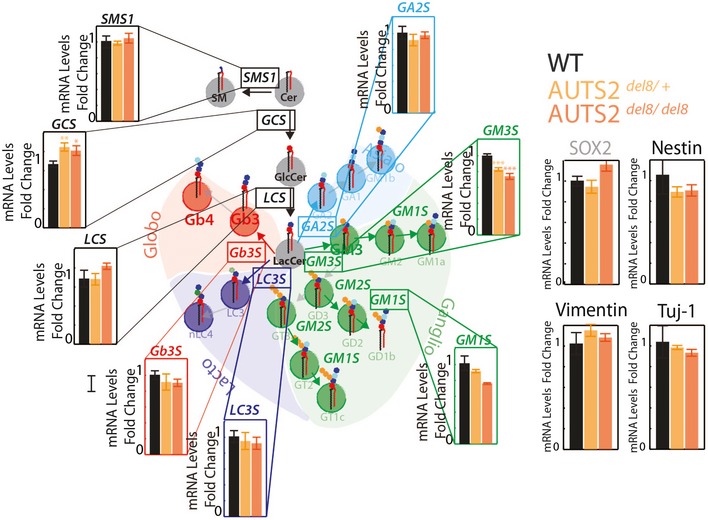
Whole brains from wild‐type (n = 5), AUTS2 heterozygous KO (AUTS2del8/+; n = 5), and AUTS2‐KO (AUTS2del8/bel8; n = 5) mouse embryos (E 17.5) were processed for mRNA extraction. qPCR was used to determine the mRNA levels of the indicated genes. Data are means ± SEM.
Discussion
Hundreds of different glycan chains can be assembled into GSLs in a process that does not depend on pre‐existing templates and is not strictly genetically determined (Merrill, 2011). Nonetheless, in spite of its template‐free nature, the production of GSLs is tightly regulated in time and space during development, to the point where GSLs are used as stage and lineage‐specific differentiation markers (Hakomori, 2008). Whether changes in GSL composition are a result of or a requirement for differentiation processes has been a longstanding question in the fields of glycobiology and developmental biology. In this study, we report evidence indicating that GSL remodelling is a key driver in neural differentiation.
During neural differentiation, stem cells that produce mainly globo‐series GSLs differentiate into neural cells that are rich in ganglio‐series GSLs (Liang et al, 2010, 2011). Defects in GSL remodelling due to loss‐of‐function mutations in the first and rate‐limiting enzyme involved in ganglio‐series GSL production (i.e. GM3S) cause a neurological syndrome (Simpson et al, 2004) where its manifestations include untreatable epilepsy, brain atrophy, severe cognitive impairment, and autism‐like manifestations (Simpson et al, 2004; Fragaki et al, 2013; Boccuto et al, 2014; Lee et al, 2016). Thus, understanding how the GSL remodelling is accomplished and how it influences neural differentiation are fundamental questions for both cell and neurodevelopmental biologists.
Here, we show that the globo‐series GSLs negatively regulate the expression of a master epigenetic modulator of neuronal differentiation, the autism susceptibility gene AUTS2. AUTS2 in turn binds GM3S promoter where it possibly recruits p300 to stimulate local histone acetylation and gene expression, thus driving the GSL switch. Importantly, the globosides–AUTS2 axis controls, through a similar mechanism, the expression of a wide set of neuronal genes thus implicating this circuit in the general process of neurogenesis.
What initiates the GSL reprogramming (i.e. the globo‐series GSL drop) in neural differentiation is not known. Nonetheless, a recent study on human‐induced pluripotent stem cells has shown that expression of Yamashita factors (i.e. Oct3/4, Sox2, Klf4, and c‐Myc) is sufficient to induce Gb3S expression and globo‐series GSL production, implicating a role for stemness factors in the control of Gb3S expression (Ojima et al, 2015). According to this evidence, we hypothesise a mechanism whereby during differentiation of stem cells towards the neural lineages: (i) stem cells are enriched in globo‐series GSLs and the GM3S promoter is kept inactive by the PRC1; (ii) globo‐series GSLs drop following down‐regulation of stemness factors; (iii) this event fosters AUTS2 induction; (iv) AUTS2 promotes the expression of GM3S and ganglio‐series GSL production by recruiting p300 at GM3S promoter, thus inducing local histone acetylation. Along with GM3S, AUTS2 promotes the expression of neuronal genes therefore supporting neural differentiation (Fig 9).
Figure 9. Globo‐series GSLs–AUTS2 axis controls the GSL switch and Neural Differentiation.
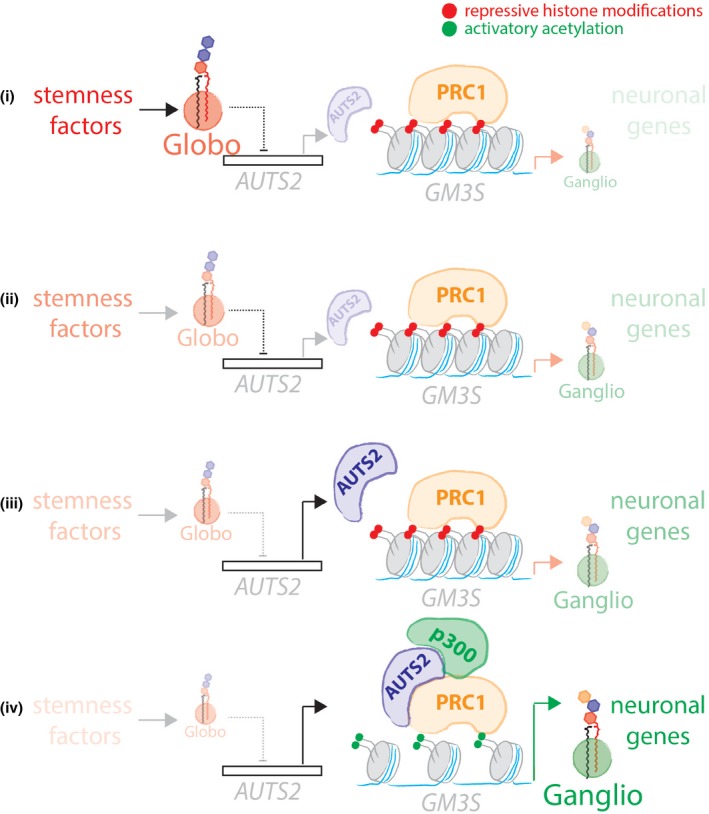
Schematic representation of the globo‐to‐ganglio‐GSL switch in neural differentiation. (i) mESCs produce prevalently gobo‐series GSLs and have promoters of GM3S and neural genes repressed due to the action of PRC1 on local histone modifications (red dots). (ii) During neural differentiation globo‐series GSL production drops. (iii) In the absence of globo‐series GSLs, AUTS2 is induced. (iv) AUTS2 localises at the promoters of GM3S and neural genes where it recruits the histone acetyltransferase p300. p300 induces local histones acetylation (green dots) chromatin relaxation and gene transcription. As a result of these events, GM3S and neural genes are expressed and ESCs differentiate into neurons.
Interestingly, AUTS2, like GM3S, is mutated in a neurological syndrome (MIM: 615834) having as symptoms intellectual disability, autism, microcephaly, cerebral palsy, and seizures (Beunders et al, 2013). Also, the AUTS2 partner p300 is mutated in a syndrome (i.e. Rubenstein–Taby syndrome type 2; MIM: 613684) where its manifestations include microcephaly, mental retardation, and autism (Roelfsema et al, 2005), suggesting that the globo‐AUTS2/p300‐ganglio system is required for proper neurogenesis and that failures in any of the components of this axis lead to neural defects. Furthermore, several reports suggest a role for GSLs in the pathology of common and rare neurological conditions (i.e. Parkinson and Huntington diseases; Schneider et al, 1992; Di Pardo et al, 2016), which invites deeper investigation on the involvement of GSL remodelling defects in acquired neural pathologies.
More in general, our data suggest the existence of a two‐way cooperation between GSLs and epigenetic factors in the establishment and maintenance of cell identity in differentiation events. Since the seminal contributions by Jacob and Monod in the 1960s on teleonomic mechanisms that regulate gene expression switches in microorganisms, the idea of self‐sustained metabolic circuits that influence developmental programmes in higher organisms has been proposed (Monod & Jacob, 1961). Here, we describe a regulatory circuit where its wiring accounts for a self‐sustained metabolic switch involved in neural differentiation. While the mechanisms by which globo‐series GSLs are regulated and control AUTS2 expression remain to be clarified, to our knowledge this is the first report linking cellular GSL composition to a molecularly defined epigenetic programme involved in cell differentiation.
Materials and Methods
Staining with fluorescently conjugated B‐subunit toxins and image analysis
For ShTxB‐Cy3 and ChTxB‐AlexaFluor488 (Invitrogen, USA) staining, the cells were fixed as described in the Appendix, blocked in PBS containing 2% bovine serum albumin (BSA) without detergent, incubated with fluorescent B‐subunit toxins, and then mounted. The images are confocal optical slices obtained using an LSM 700 confocal microscope (Zeiss, Germany). For quantification experiments, 10–15 fields were randomly chosen and imaged with identical microscope settings (i.e. laser power, detector amplification) below pixel saturation. The mean fluorescence intensity for each imaged cell was calculated for each channel after the image segmentation analysis using the Cell Profiler image analysis software (Carpenter et al, 2006).
The colony factor is defined as the number of ChTxB (or ShTxB)‐positive cells found within a 50 × 50 pixels (69.19 × 69.19 μm) square drawn around each ChTxB (or ShTxB)‐positive cell.
Randomly expected colony factors were defined as the numbers of cells found within a 50 × 50 pixels (69.19 × 69.19 μm) square drawn around each ChTxB (or ShTxB)‐positive cell multiplied by the overall ChTxB (or ShTxB) positivity prevalence in the total population.
Microarray analysis
Total RNA was extracted from HeLa cells under the different conditions. The analysis was performed as a outsource by Dr. Norman Gerry's group (Coriell Institute for Medical Research 403 Haddon Avenue, Camden, NJ 08103, USA). The microarray platform used for the hybridisation was Affymetrix U133A 2.0. Genes up‐regulated by at least 50% (false discovery rate ≤ 0.001) under each single knock‐down condition from the microarrays were used to build a GSL‐dependent gene‐regulation map using Cytoscape software (Shannon et al, 2003). In the map, each silencing condition represents a Hub connected to each specifically up‐regulated gene (nodes) by an arch. Genes up‐regulated under more than one condition are represented as multi‐arch nodes (node degree > 1). Genes commonly up‐regulated under silencing conditions that led to decreased Gb3 levels (i.e. GCS‐KD, FAPP2‐KD, LCS‐KD, Gb3S‐KD) and not up‐regulated in other silencing conditions (i.e. CERT‐KD, SMS1‐KD. GM3S‐KD) were considered for further characterisation. Microarray data from this study are available at GEO database with the following accession number GSE107044.
ChIP‐seq
For ChIP‐seq, “Ovation Ultralow Library System v2” kits (NuGEN, San Carlos, CA, USA) were used for the library preparation, according to the manufacturer instructions. The input and immunoprecipitated samples, as well as the final libraries, were quantified by using a fluorometer (Qubit 2.0; Invitrogen, Carlsbad, CA, USA) and quality tested using an Agilent 2100 Bioanalyzer RNA nanoassay (Agilent Technologies, Santa Clara, CA, USA) and real‐time Stratagene Mx3000P (Agilent Technologies, Santa Clara, CA, USA). The libraries were then processed with Illumina cBot for cluster generation on a flowcell, according to the manufacturer instructions, and sequenced on single‐end mode at the multiplexing level requested on HiSeq2500 (Illumina, San Diego, CA, USA). The CASAVA 1.8.2 version of the Illumina pipeline was used to process the raw data for both format conversion and de‐multiplexing.
ChIP‐seq analysis was performed as described in Ref. Gao et al (2014) with certain modifications. Sequenced reads were aligned to the human reference genome (assembly hg19) using Bowtie2. After duplicated reads were removed, ChIP‐seq read density files were generated and uploaded in UCSC Genome Browser for visualisation. Significantly (P < 1 × 10⁻⁵) enriched peaks for each ChIP‐seq dataset were identified with the macs2 software, and significant peaks commonly found under the three ChIP conditions were considered for further analysis. In order to remove any sources of systematic variation, the normalisation of common peaks intensities was performed scaling the values across samples so that each of them had the same median peaks intensity value. The normalised ChIP signals for each peak in the three conditions were compared both for the peaks with a reported AUTS2 binding site (Gao et al, 2014) and for the non‐AUTS2‐bound peaks. The whole analysis pipeline was performed using an in‐house R script. Genomic annotation of peaks was achieved by Homer software. ChIP‐seq data from this study are available at GEO database with the following accession number GSE107044.
Statistical analysis
Two‐tailed Student's t‐tests were applied to the data were not differently specified.
Author contributions
GDA supervised the entire project, with advice from AL, and MDE; GDA and DR wrote the manuscript with comments from all co‐authors; DR, with the help of LS, SC, and SF, designed and conducted the experiments of sphingolipid labelling, qPCR, ChIP, and ChIP‐seq, and luciferase reporter‐based promoter activity. RR conducted immune‐electron microscopy experiments. DR designed the strategy and produced plasmid vectors. DR, with the help of FDR, FS, RDG, GCB, VM, and MDE, designed and conducted neural differentiation experiments. ES, MS, KH, and MH provided the AUTS2 KO mouse brains. LJ provided the Cy3‐ShTxB. IG and MRG performed the ChIP‐seq data analysis.
Conflict of interest
The authors declare that they have no conflict of interest.
Supporting information
Appendix
Expanded View Figures PDF
Dataset EV1
Dataset EV2
Movie EV1
Review Process File
Acknowledgements
We thank F.H. Gage, C. Lanzuolo, D.Corda, D. Boraschi, S. Parashuraman, and A. Colanzi for discussions and C.P. Berrie for editorial assistance. We also thank the IBP‐bioimaging facility and the IBP‐IGB FACS facility for technical support. G.D.’A. acknowledges the financial support of AIRC (MFAG 10585), of the Italian Ministry of Health (GR‐2011‐02352256), and of MIUR (PON_00862). R.R. acknowledges the financial support of FIRC (fellowship N° 15111). I.G. acknowledges financial support of MIUR (PON02_00619). L.J. acknowledges the financial support of Human Frontier Science Program (RGP0029‐2014) and of the European Research Council (advanced grant project 340485). M.R.G. work has been conducted at National Research Institute University HSE and supported by the RSF grant n. 14‐41‐00039. M.D.’E. is supported by Epigenomics Flagship Project EPIGEN MIUR‐CNR and AIRETT Foundation.
The EMBO Journal (2018) 37: e97674
See also: https://doi.org/10.15252/embj.201899221 (April 2018)
References
- Bedogni F, Hodge RD, Nelson BR, Frederick EA, Shiba N, Daza RA, Hevner RF (2010) Autism susceptibility candidate 2 (Auts2) encodes a nuclear protein expressed in developing brain regions implicated in autism neuropathology. Gene Expr Patterns 10: 9–15 [DOI] [PMC free article] [PubMed] [Google Scholar]
- Bernstein BE, Kamal M, Lindblad‐Toh K, Bekiranov S, Bailey DK, Huebert DJ, McMahon S, Karlsson EK, Kulbokas EJ III, Gingeras TR, Schreiber SL, Lander ES (2005) Genomic maps and comparative analysis of histone modifications in human and mouse. Cell 120: 169–181 [DOI] [PubMed] [Google Scholar]
- Beunders G, Voorhoeve E, Golzio C, Pardo LM, Rosenfeld JA, Talkowski ME, Simonic I, Lionel AC, Vergult S, Pyatt RE, van de Kamp J, Nieuwint A, Weiss MM, Rizzu P, Verwer LE, van Spaendonk RM, Shen Y, Wu BL, Yu T, Yu Y et al (2013) Exonic deletions in AUTS2 cause a syndromic form of intellectual disability and suggest a critical role for the C terminus. Am J Hum Genet 92: 210–220 [DOI] [PMC free article] [PubMed] [Google Scholar]
- Beunders G, van de Kamp J, Vasudevan P, Morton J, Smets K, Kleefstra T, de Munnik SA, Schuurs‐Hoeijmakers J, Ceulemans B, Zollino M, Hoffjan S, Wieczorek S, So J, Mercer L, Walker T, Velsher L, study DDD, Parker MJ, Magee AC, Elffers B et al (2016) A detailed clinical analysis of 13 patients with AUTS2 syndrome further delineates the phenotypic spectrum and underscores the behavioural phenotype. J Med Genet 53: 523–532 [DOI] [PubMed] [Google Scholar]
- Boccuto L, Aoki K, Flanagan‐Steet H, Chen CF, Fan X, Bartel F, Petukh M, Pittman A, Saul R, Chaubey A, Alexov E, Tiemeyer M, Steet R, Schwartz CE (2014) A mutation in a ganglioside biosynthetic enzyme, ST3GAL5, results in salt & pepper syndrome, a neurocutaneous disorder with altered glycolipid and glycoprotein glycosylation. Hum Mol Genet 23: 418–433 [DOI] [PMC free article] [PubMed] [Google Scholar]
- Cappello S, Gray MJ, Badouel C, Lange S, Einsiedler M, Srour M, Chitayat D, Hamdan FF, Jenkins ZA, Morgan T, Preitner N, Uster T, Thomas J, Shannon P, Morrison V, Di Donato N, Van Maldergem L, Neuhann T, Newbury‐Ecob R, Swinkells M et al (2013) Mutations in genes encoding the cadherin receptor‐ligand pair DCHS1 and FAT4 disrupt cerebral cortical development. Nat Genet 45: 1300–1308 [DOI] [PubMed] [Google Scholar]
- Carpenter AE, Jones TR, Lamprecht MR, Clarke C, Kang IH, Friman O, Guertin DA, Chang JH, Lindquist RA, Moffat J, Golland P, Sabatini DM (2006) Cell Profiler: image analysis software for identifying and quantifying cell phenotypes. Genome Biol 7: R100 [DOI] [PMC free article] [PubMed] [Google Scholar]
- D'Angelo G, Polishchuk E, Di Tullio G, Santoro M, Di Campli A, Godi A, West G, Bielawski J, Chuang CC, van der Spoel AC, Platt FM, Hannun YA, Polishchuk R, Mattjus P, De Matteis MA (2007) Glycosphingolipid synthesis requires FAPP2 transfer of glucosylceramide. Nature 449: 62–67 [DOI] [PubMed] [Google Scholar]
- D'Angelo G, Capasso S, Sticco L, Russo D (2013a) Glycosphingolipids: synthesis and functions. FEBS J 280: 6338–6353 [DOI] [PubMed] [Google Scholar]
- D'Angelo G, Uemura T, Chuang CC, Polishchuk E, Santoro M, Ohvo‐Rekila H, Sato T, Di Tullio G, Varriale A, D'Auria S, Daniele T, Capuani F, Johannes L, Mattjus P, Monti M, Pucci P, Williams RL, Burke JE, Platt FM, Harada A et al (2013b) Vesicular and non‐vesicular transport feed distinct glycosylation pathways in the Golgi. Nature 501: 116–120 [DOI] [PubMed] [Google Scholar]
- Di Pardo A, Amico E, Maglione V (2016) Impaired levels of gangliosides in the corpus callosum of huntington disease animal models. Front Neurosci 10: 457 [DOI] [PMC free article] [PubMed] [Google Scholar]
- Fico A, Manganelli G, Simeone M, Guido S, Minchiotti G, Filosa S (2008) High‐throughput screening‐compatible single‐step protocol to differentiate embryonic stem cells in neurons. Stem Cells Dev 17: 573–584 [DOI] [PubMed] [Google Scholar]
- Fragaki K, Ait‐El‐Mkadem S, Chaussenot A, Gire C, Mengual R, Bonesso L, Beneteau M, Ricci JE, Desquiret‐Dumas V, Procaccio V, Rotig A, Paquis‐Flucklinger V (2013) Refractory epilepsy and mitochondrial dysfunction due to GM3 synthase deficiency. Eur J Hum Genet 21: 528–534 [DOI] [PMC free article] [PubMed] [Google Scholar]
- Frechin M, Stoeger T, Daetwyler S, Gehin C, Battich N, Damm EM, Stergiou L, Riezman H, Pelkmans L (2015) Cell‐intrinsic adaptation of lipid composition to local crowding drives social behaviour. Nature 523: 88–91 [DOI] [PubMed] [Google Scholar]
- Furukawa K, Ohmi Y, Ohkawa Y, Tajima O, Furukawa K (2014) Glycosphingolipids in the regulation of the nervous system. Adv Neurobiol 9: 307–320 [DOI] [PubMed] [Google Scholar]
- Gao Z, Zhang J, Bonasio R, Strino F, Sawai A, Parisi F, Kluger Y, Reinberg D (2012) PCGF homologs, CBX proteins, and RYBP define functionally distinct PRC1 family complexes. Mol Cell 45: 344–356 [DOI] [PMC free article] [PubMed] [Google Scholar]
- Gao Z, Lee P, Stafford JM, von Schimmelmann M, Schaefer A, Reinberg D (2014) An AUTS2‐Polycomb complex activates gene expression in the CNS. Nature 516: 349–354 [DOI] [PMC free article] [PubMed] [Google Scholar]
- Hakomori SI (2008) Structure and function of glycosphingolipids and sphingolipids: recollections and future trends. Biochem Biophys Acta 1780: 325–346 [DOI] [PMC free article] [PubMed] [Google Scholar]
- Hamby ME, Coskun V, Sun YE (2008) Transcriptional regulation of neuronal differentiation: the epigenetic layer of complexity. Biochem Biophys Acta 1779: 432–437 [DOI] [PMC free article] [PubMed] [Google Scholar]
- Han J, Denli AM, Gage FH (2012) The enemy within: intronic miR‐26b represses its host gene, ctdsp2, to regulate neurogenesis. Genes Dev 26: 6–10 [DOI] [PMC free article] [PubMed] [Google Scholar]
- Hanada K, Kumagai K, Yasuda S, Miura Y, Kawano M, Fukasawa M, Nishijima M (2003) Molecular machinery for non‐vesicular trafficking of ceramide. Nature 426: 803–809 [DOI] [PubMed] [Google Scholar]
- Heyningen SV (1974) Cholera toxin: interaction of subunits with ganglioside GM1. Science 183: 656–657 [DOI] [PubMed] [Google Scholar]
- Hoeck JD, Jandke A, Blake SM, Nye E, Spencer‐Dene B, Brandner S, Behrens A (2010) Fbw7 controls neural stem cell differentiation and progenitor apoptosis via Notch and c‐Jun. Nat Neurosci 13: 1365–1372 [DOI] [PubMed] [Google Scholar]
- Hori K, Nagai T, Shan W, Sakamoto A, Taya S, Hashimoto R, Hayashi T, Abe M, Yamazaki M, Nakao K, Nishioka T, Sakimura K, Yamada K, Kaibuchi K, Hoshino M (2014) Cytoskeletal regulation by AUTS2 in neuronal migration and neuritogenesis. Cell Rep 9: 2166–2179 [DOI] [PubMed] [Google Scholar]
- Huang Z, Kawase‐Koga Y, Zhang S, Visvader J, Toth M, Walsh CA, Sun T (2009) Transcription factor Lmo4 defines the shape of functional areas in developing cortices and regulates sensorimotor control. Dev Biol 327: 132–142 [DOI] [PMC free article] [PubMed] [Google Scholar]
- Hutlet B, Theys N, Coste C, Ahn MT, Doshishti‐Agolli K, Lizen B, Gofflot F (2014) Systematic expression analysis of Hox genes at adulthood reveals novel patterns in the central nervous system. Brain Struct Funct 221: 1223–1243 [DOI] [PubMed] [Google Scholar]
- Jacewicz M, Clausen H, Nudelman E, Donohue‐Rolfe A, Keusch GT (1986) Pathogenesis of shigella diarrhea. XI. Isolation of a shigella toxin‐binding glycolipid from rabbit jejunum and HeLa cells and its identification as globotriaosylceramide. J Exp Med 163: 1391–1404 [DOI] [PMC free article] [PubMed] [Google Scholar]
- Jamain S, Quach H, Betancur C, Rastam M, Colineaux C, Gillberg IC, Soderstrom H, Giros B, Leboyer M, Gillberg C, Bourgeron T, Paris Autism Research International Sibpair S (2003) Mutations of the X‐linked genes encoding neuroligins NLGN3 and NLGN4 are associated with autism. Nat Genet 34: 27–29 [DOI] [PMC free article] [PubMed] [Google Scholar]
- Jennemann R, Sandhoff R, Wang S, Kiss E, Gretz N, Zuliani C, Martin‐Villalba A, Jager R, Schorle H, Kenzelmann M, Bonrouhi M, Wiegandt H, Grone HJ (2005) Cell‐specific deletion of glucosylceramide synthase in brain leads to severe neural defects after birth. Proc Natl Acad Sci USA 102: 12459–12464 [DOI] [PMC free article] [PubMed] [Google Scholar]
- Kalscheuer VM, FitzPatrick D, Tommerup N, Bugge M, Niebuhr E, Neumann LM, Tzschach A, Shoichet SA, Menzel C, Erdogan F, Arkesteijn G, Ropers HH, Ullmann R (2007) Mutations in autism susceptibility candidate 2 (AUTS2) in patients with mental retardation. Hum Genet 121: 501–509 [DOI] [PubMed] [Google Scholar]
- Kim DY, Rhee I, Paik J (2014) Metabolic circuits in neural stem cells. Cell Mol Life Sci 71: 4221–4241 [DOI] [PMC free article] [PubMed] [Google Scholar]
- Kuzmichev A, Nishioka K, Erdjument‐Bromage H, Tempst P, Reinberg D (2002) Histone methyltransferase activity associated with a human multiprotein complex containing the Enhancer of Zeste protein. Genes Dev 16: 2893–2905 [DOI] [PMC free article] [PubMed] [Google Scholar]
- Lee JS, Yoo Y, Lim BC, Kim KJ, Song J, Choi M, Chae JH (2016) GM3 synthase deficiency due to ST3GAL5 variants in two Korean female siblings: masquerading as rett syndrome‐like phenotype. Am J Med Genet A 170: 2200–2205 [DOI] [PubMed] [Google Scholar]
- Liang YJ, Kuo HH, Lin CH, Chen YY, Yang BC, Cheng YY, Yu AL, Khoo KH, Yu J (2010) Switching of the core structures of glycosphingolipids from globo‐ and lacto‐ to ganglio‐series upon human embryonic stem cell differentiation. Proc Natl Acad Sci USA 107: 22564–22569 [DOI] [PMC free article] [PubMed] [Google Scholar]
- Liang YJ, Yang BC, Chen JM, Lin YH, Huang CL, Cheng YY, Hsu CY, Khoo KH, Shen CN, Yu J (2011) Changes in glycosphingolipid composition during differentiation of human embryonic stem cells to ectodermal or endodermal lineages. Stem Cells 29: 1995–2004 [DOI] [PubMed] [Google Scholar]
- Liour SS, Yu RK (2002) Differential effects of three inhibitors of glycosphingolipid biosynthesis on neuronal differentiation of embryonal carcinoma stem cells. Neurochem Res 27: 1507–1512 [DOI] [PubMed] [Google Scholar]
- Majoul I, Schmidt T, Pomasanova M, Boutkevich E, Kozlov Y, Soling HD (2002) Differential expression of receptors for Shiga and Cholera toxin is regulated by the cell cycle. J Cell Sci 115: 817–826 [DOI] [PubMed] [Google Scholar]
- Matarazzo MR, De Bonis ML, Vacca M, Della Ragione F, D'Esposito M (2009) Lessons from two human chromatin diseases, ICF syndrome and Rett syndrome. Int J Biochem Cell Biol 41: 117–126 [DOI] [PubMed] [Google Scholar]
- Merrill AH Jr (2011) Sphingolipid and glycosphingolipid metabolic pathways in the era of sphingolipidomics. Chem Rev 111: 6387–6422 [DOI] [PMC free article] [PubMed] [Google Scholar]
- Monod J, Jacob F (1961) Teleonomic mechanisms in cellular metabolism, growth, and differentiation. Cold Spring Harb Symp Quant Biol 26: 389–401 [DOI] [PubMed] [Google Scholar]
- Ojima T, Shibata E, Saito S, Toyoda M, Nakajima H, Yamazaki‐Inoue M, Miyagawa Y, Kiyokawa N, Fujimoto J, Sato T, Umezawa A (2015) Glycolipid dynamics in generation and differentiation of induced pluripotent stem cells. Sci Rep 5: 14988 [DOI] [PMC free article] [PubMed] [Google Scholar]
- Oksenberg N, Stevison L, Wall JD, Ahituv N (2013) Function and regulation of AUTS2, a gene implicated in autism and human evolution. PLoS Genet 9: e1003221 [DOI] [PMC free article] [PubMed] [Google Scholar]
- Oksenberg N, Haliburton GD, Eckalbar WL, Oren I, Nishizaki S, Murphy K, Pollard KS, Birnbaum RY, Ahituv N (2014) Genome‐wide distribution of Auts2 binding localizes with active neurodevelopmental genes. Transl Psychiatry 4: e431 [DOI] [PMC free article] [PubMed] [Google Scholar]
- Palazuelos J, Crawford HC, Klingener M, Sun B, Karelis J, Raines EW, Aguirre A (2014) TACE/ADAM17 is essential for oligodendrocyte development and CNS myelination. J Neurosci 34: 11884–11896 [DOI] [PMC free article] [PubMed] [Google Scholar]
- Platt FM, Neises GR, Dwek RA, Butters TD (1994) N‐butyldeoxynojirimycin is a novel inhibitor of glycolipid biosynthesis. J Biol Chem 269: 8362–8365 [PubMed] [Google Scholar]
- Qiao Y, Yang X, Jing N (2016) Epigenetic regulation of early neural fate commitment. Cell Mol Life Sci 73: 1399–1411 [DOI] [PMC free article] [PubMed] [Google Scholar]
- Roelfsema JH, White SJ, Ariyurek Y, Bartholdi D, Niedrist D, Papadia F, Bacino CA, den Dunnen JT, van Ommen GJ, Breuning MH, Hennekam RC, Peters DJ (2005) Genetic heterogeneity in Rubinstein‐Taybi syndrome: mutations in both the CBP and EP300 genes cause disease. Am J Hum Genet 76: 572–580 [DOI] [PMC free article] [PubMed] [Google Scholar]
- Satijn DP, Gunster MJ, van der Vlag J, Hamer KM, Schul W, Alkema MJ, Saurin AJ, Freemont PS, van Driel R, Otte AP (1997) RING1 is associated with the polycomb group protein complex and acts as a transcriptional repressor. Mol Cell Biol 17: 4105–4113 [DOI] [PMC free article] [PubMed] [Google Scholar]
- Saunders WS, Chue C, Goebl M, Craig C, Clark RF, Powers JA, Eissenberg JC, Elgin SC, Rothfield NF, Earnshaw WC (1993) Molecular cloning of a human homologue of Drosophila heterochromatin protein HP1 using anti‐centromere autoantibodies with anti‐chromo specificity. J Cell Sci 104(Pt. 2): 573–582 [DOI] [PubMed] [Google Scholar]
- Saurin AJ, Shiels C, Williamson J, Satijn DP, Otte AP, Sheer D, Freemont PS (1998) The human polycomb group complex associates with pericentromeric heterochromatin to form a novel nuclear domain. J Cell Biol 142: 887–898 [DOI] [PMC free article] [PubMed] [Google Scholar]
- Schneider JS, Pope A, Simpson K, Taggart J, Smith MG, DiStefano L (1992) Recovery from experimental parkinsonism in primates with GM1 ganglioside treatment. Science 256: 843–846 [DOI] [PubMed] [Google Scholar]
- Schneider R, Bannister AJ, Myers FA, Thorne AW, Crane‐Robinson C, Kouzarides T (2004) Histone H3 lysine 4 methylation patterns in higher eukaryotic genes. Nat Cell Biol 6: 73–77 [DOI] [PubMed] [Google Scholar]
- Shannon P, Markiel A, Ozier O, Baliga NS, Wang JT, Ramage D, Amin N, Schwikowski B, Ideker T (2003) Cytoscape: a software environment for integrated models of biomolecular interaction networks. Genome Res 13: 2498–2504 [DOI] [PMC free article] [PubMed] [Google Scholar]
- Shi L, Chang X, Zhang P, Coba MP, Lu W, Wang K (2013) The functional genetic link of NLGN4X knockdown and neurodevelopment in neural stem cells. Hum Mol Genet 22: 3749–3760 [DOI] [PMC free article] [PubMed] [Google Scholar]
- Simpson MA, Cross H, Proukakis C, Priestman DA, Neville DC, Reinkensmeier G, Wang H, Wiznitzer M, Gurtz K, Verganelaki A, Pryde A, Patton MA, Dwek RA, Butters TD, Platt FM, Crosby AH (2004) Infantile‐onset symptomatic epilepsy syndrome caused by a homozygous loss‐of‐function mutation of GM3 synthase. Nat Genet 36: 1225–1229 [DOI] [PubMed] [Google Scholar]
- Snijder B, Sacher R, Ramo P, Damm EM, Liberali P, Pelkmans L (2009) Population context determines cell‐to‐cell variability in endocytosis and virus infection. Nature 461: 520–523 [DOI] [PubMed] [Google Scholar]
- Stiles J, Jernigan TL (2010) The basics of brain development. Neuropsychol Rev 20: 327–348 [DOI] [PMC free article] [PubMed] [Google Scholar]
- Vicidomini G, Moneron G, Han KY, Westphal V, Ta H, Reuss M, Engelhardt J, Eggeling C, Hell SW (2011) Sharper low‐power STED nanoscopy by time gating. Nat Methods 8: 571–573 [DOI] [PubMed] [Google Scholar]
- Wang Z, Zang C, Rosenfeld JA, Schones DE, Barski A, Cuddapah S, Cui K, Roh TY, Peng W, Zhang MQ, Zhao K (2008) Combinatorial patterns of histone acetylations and methylations in the human genome. Nat Genet 40: 897–903 [DOI] [PMC free article] [PubMed] [Google Scholar]
- Yamashita T, Wada R, Sasaki T, Deng C, Bierfreund U, Sandhoff K, Proia RL (1999) A vital role for glycosphingolipid synthesis during development and differentiation. Proc Natl Acad Sci USA 96: 9142–9147 [DOI] [PMC free article] [PubMed] [Google Scholar]
- Yamashita T, Wu YP, Sandhoff R, Werth N, Mizukami H, Ellis JM, Dupree JL, Geyer R, Sandhoff K, Proia RL (2005) Interruption of ganglioside synthesis produces central nervous system degeneration and altered axon‐glial interactions. Proc Natl Acad Sci USA 102: 2725–2730 [DOI] [PMC free article] [PubMed] [Google Scholar]
- Yen G, Croci A, Dowling A, Zhang S, Zoeller RT, Darling DS (2001) Developmental and functional evidence of a role for Zfhep in neural cell development. Brain Res Mol Brain Res 96: 59–67 [DOI] [PubMed] [Google Scholar]
Associated Data
This section collects any data citations, data availability statements, or supplementary materials included in this article.
Supplementary Materials
Appendix
Expanded View Figures PDF
Dataset EV1
Dataset EV2
Movie EV1
Review Process File


