

Abstract
Purpose
To test the hypothesis that biomarkers of fluorine 18 (18F) fluorodeoxyglucose (FDG) positron emission tomography (PET) can be used for the early detection of therapeutic response to irreversible electroporation (IRE) of liver tumor in a rodent liver tumor model.
Materials and Methods
The institutional animal care and use committee approved this study. Rats were inoculated with McA-RH7777 liver tumor cells in the left median and left lateral lobes. Tumors were allowed to grow for 7 days to reach a size typically at least 5 mm in longest diameter, as verified with magnetic resonance (MR) imaging. IRE electrodes were inserted, and eight 100-μsec, 2000-V pulses were applied to ablate the tumor tissue in the left median lobe. Tumor in the left lateral lobe served as a control in each animal. PET/computed tomography (CT) and MR imaging measurements were performed at baseline and 3 days after IRE for each animal. Additional MR imaging measurements were obtained 14 days after IRE. After 14-day follow-up MR imaging, rats were euthanized and tumors harvested for hematoxylin-eosin, CD34, and caspase-3 staining. Change in the maximum standardized uptake value (ΔSUVmax) was calculated 3 days after IRE. The maximum lesion diameter change (ΔDmax) was measured 14 days after IRE by using axial T2-weighted imaging. ΔSUVmax and ΔDmax were compared. The apoptosis index was calculated by using caspase-3–stained slices of apoptotic tumor cells. Pearson correlation coefficients were calculated to assess the relationship between ΔSUVmax at 3 days and ΔDmax (or apoptosis index) at 14 days after IRE treatment.
Results
ΔSUVmax, ΔDmax, and apoptosis index significantly differed between treated and untreated tumors (P < .001 for all). In treated tumors, there was a strong correlation between ΔSUVmax 3 days after IRE and ΔDmax 14 days after IRE (R = 0.66, P = .01) and between ΔSUVmax 3 days after IRE and apoptosis index 14 days after IRE (R = 0.57, P = .04).
Conclusion
18F-FDG PET imaging biomarkers can be used for the early detection of therapeutic response to IRE treatment of liver tumors in a rodent model.
© RSNA, 2017
Introduction
Irreversible electroporation (IRE) ablation involves targeted delivery of electrical pulses to induce tissue death by means of cell membrane permeabilization (1). Most recent studies have shown that IRE induces alterations to the cell membrane in both tumor and normal tissues (nanopores were observed on images from transmission electron microscopy) (2,3). IRE can ablate large volumes of tissue without inducing thermal effects; this ability offers advantages over existing thermal ablation methods (4–6). Importantly, IRE does not suffer from the “heat-sink” effect that is a common problem for thermal ablation methods that damage adjacent parenchymal tissues and blood vessels (4). Additional advantages include tumor-specific immunologic reaction (7) and minimal effect on tissue collagen networks (8). These benefits make IRE an attractive approach for the treatment of patients with hepatocellular carcinoma and metastatic liver tumors.
In vivo imaging methods are used to locate targeted lesions, monitor tissue IRE ablation, and evaluate treatment effectiveness (3,9,10). Ultrasonographic (US) and computed tomographic (CT) imaging methods were initially advocated for visualization of IRE ablation volumes (11,12). However, conventional gray-scale US shows widely conflicting results, with a sensitivity ranging from 20% to 84% (13–16) for the detection of liver tumors. CT has an inherently low soft-tissue contrast that prevents clear tumor identification without contrast enhancement and thus is not feasible for real-time monitoring. Moreover, the substantial amount of ionizing radiation delivered to both the patient and the operator in an interventional setting (requiring repeated measurements) further diminishes enthusiasm for CT approaches as an option for guidance and monitoring during liver-directed procedures. Magnetic resonance (MR) imaging is generally considered a more accurate imaging technique for detecting liver tumors because of its superior soft-tissue contrast, particularly for smaller lesions. However, all of these clinical imaging techniques can depict only the morphologic changes occurring after IRE or show alterations in areas of perfusion if a contrast medium is supplied (3,17). Therefore, the therapeutic responses are currently identified only by changes in tumor size, which generally occur only weeks or months after therapy initiation (18).
At present, no imaging tool is commonly used to assess early metabolic response to IRE therapy. Establishing an imaging assay that can depict metabolic alterations after IRE therapy could provide a potential early biomarker for effective clinical application. Fluorine 18 (18F) fluorodeoxyglucose (FDG) PET is widely known as a tool for detecting and characterizing viable tumors; FDG avidity in human liver tumors varies and was shown to have a prognostic value (19). However, to our knowledge, only one study proposed using 18F-FDG PET to assess the effectiveness of tumor ablation acutely (20), whereas 18F-FDG PET is commonly used in the evaluation of IRE only for the late assessment of the absence of residual viable tumor (21,22).
The purpose of our study was to test the hypothesis that 18F-FDG PET imaging biomarkers can be used for early detection of therapeutic response to IRE treatment of liver tumor in a rodent liver tumor model.
Materials and Methods
All studies were approved by our institutional animal care and use committee and performed in accordance with National Institutes of Health guidelines.
Tumor Cell Culture and Animal Model
McA-RH7777 rat hepatoma cell line (CRL-1601; American Type Culture Collection, Manassas, Va) was cultured in Dulbecco’s modified Eagle’s medium (American Type Culture Collection) containing 10% fetal bovine serum, 100 U/mL penicillin, and 100 U/mL streptomycin at 37°C with 5% CO2. Trypan blue staining was performed before each tumor implantation procedure to verify more than 90% cell viability. Sixteen male Sprague-Dawley rats weighing 300–350 g (Charles River Laboratories, Wilmington, Mass) were anesthetized with isoflurane at an induction dose of isoflurane-oxygen medical mixture (5% isoflurane; oxygen, 3 L/min). A mini-laparotomy was performed with the rat under anesthesia, and the liver was exposed on a sterile compress. We visually injected 2 × 10⁶ McA-RH7777 cells in 0.2 mL phosphate-buffered saline into the left median and left lateral lobes. The abdominal incisions were then closed. Tumors were allowed to grow for 7 days to reach a size typically at least 5 mm in longest diameter, as verified with MR imaging.
Tumor IRE Procedure
A BTX Electroporator (ECM830; Harvard Apparatus, Holliston, Mass) function generator and a parallel two-needle electrode array were used for all rat IRE procedures. The electrode array was constructed by using two MR imaging–compatible platinum-15% iridium needles (length, 35 mm; diameter, 1.5 mm); these were inserted through a plastic block to maintain 1-cm spacing between the two parallel needles. We used an IRE ablation protocol that included the application of eight 2000-V square wave pulses for a total of eight pulses of 100 μsec in length with 100-msec spacing between pulses, on the basis of our previous studies (17, 23,24) Before both imaging and IRE procedures, rats were anesthetized with isoflurane.
After baseline imaging, each rat was fixed in a supine position within a restraint (rats strapped to form-fitting back board). Next, a mini-laparotomy was performed to expose and visually locate the tumor within the left median hepatic lobe. Before electrode placement, the tumor-bearing liver lobe was palpated between thumb and forefinger to approximate the configuration of the tumor mass. In each animal, the bipolar IRE electrode array was positioned so that the two-needle insertion positions essentially straddled the center of the tumor mass and were aligned along the longest tumor diameter. To optimize treatment efficacy, the tumor should be located midway between the two parallel electrodes (Fig 1). Finally, the electrodes were connected to the electroporation function generator, and an IRE pulse train was applied (requiring <1 second for application of the complete IRE pulse train) (performed by Z.Z. and X.W., both with 2 years of experience). After the IRE procedure, the abdominal incisions were closed with a two-layer technique followed by topical application of antibiotic ointment and injection of Metacam (Boehringer Ingelheim, Ingelheim am Rhein, Germany; 1–2 mg/kg subcutaneously). The tumor in the left lateral lobe served as a control in each animal. During these follow-up intervals, each animal was observed daily to determine the presence of any postoperative complications (incision infection or abscess formation).
Figure 1:

Representative photograph shows IRE electrode placement within targeted liver tumor.
In Vivo Imaging Protocols
PET/CT studies were performed with a small-animal imaging system (nanoScan8; Mediso, Budapest, Hungary). The rats were fasted for 12 hours before 18F-FDG PET/CT. Each rat was injected through a tail vein catheter with radioactive glucose (18F-FDG, 0.2–0.3 mL). 18F-FDG dose activity administered to the rats was chosen to be 1000 μCi/kg. The animals were placed on a warmed platform for 45 minutes immediately after 18F-FDG injection. The rats were then anesthetized and fixed to a rat-specific holder to undergo PET/CT. Localizer images were obtained by using an integrated x-ray CT camera. A 20-minute static PET scan of the liver was acquired, with a whole-body CT scan acquired immediately after to provide an attenuation map for PET image reconstruction. PET/CT parameters are listed in the Table. Images were reconstructed with a voxel size of 0.4 × 0.4 × 0.4 mm. These PET/CT measurements were performed at baseline and at 3 days after IRE for each animal to assess treatment outcome. MR imaging and PET/CT at baseline and 3 days after IRE were carried out on the same day; MR imaging was used mainly as an anatomic reference for PET at this time point. The PET/CT acquisition was not repeated at later time points in order to reduce the stress related to anesthesia and 18F-FDG injection and thus to reduce the risk for animal death during scanning.
Protocols for in Vivo MR Imaging and PET/CT
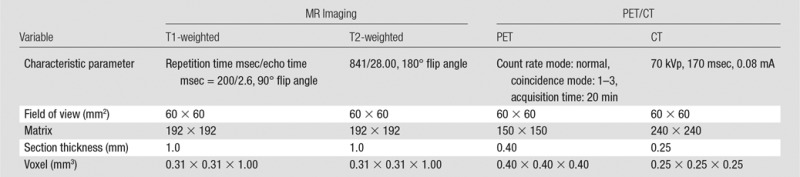
MR imaging was performed with a 7.0-T 30-cm bore unit (ClinScan; Bruker BioSpin, Ettlingen, Germany) with a 75-mm rat quadrature volume coil (Bruker BioSpin, Billerica, Mass) at baseline and at 3 days and 14 days after IRE. Heart rate and respiration rate were monitored with an MR imaging–compatible small-animal gating system (SA Instruments, Stony Brook, NY). Rats were anesthetized with isoflurane at an induction dose of isoflurane-oxygen medical mixture (5% isoflurane; oxygen, 3 L/min). T1- and T2-weighted images were obtained along both coronal and transverse orientations with a multisection acquisition; this provided complete coverage of the entire liver volume. MR imaging sequences and parameters are listed in the Table.
Histologic Evaluation
After the 14-day follow-up MR examination, rats was euthanized with intravenous injection of Euthasol (Virbac, Carros, France) at a dose of 150 mg/kg and bilateral thoracotomy. Two to three sections across the lesion were sampled and fixed in 10% formaldehyde solution; these tissue sections were then embedded in paraffin for hematoxylin-eosin (H-E) staining. Additional tissue sections from each group were selected for immunohistochemistry evaluation. CD34 staining was used as a malignant tumor neovascularization marker to highlight regions of sinusoidal capillarization; caspase-3 staining was used as a marker of active apoptosis. Resulting histologic slides were reviewed by a pathologist from the Northwestern University Pathology Core with more than 10 years of experience in gastrointestinal oncology.
Image Analysis
With use of both the T2-weighted MR images and the CT images as anatomic reference to detect and identify tumor boundaries, regions of interest were drawn to selectively identify the tumor masses. Standardized uptake value (SUV) maps were generated on a voxel-by-voxel basis, and the maximum standardized uptake value (SUVmax) was recorded for each tumor region of interest. These values were used to determine tumors with the highest tracer concentration. Tracer uptake by various tumors was quantified with SUVmax by using the following equation: SUVmax = maximum tissue activity concentration (in microcuries per milliliter)/injected dose (in microcuries) × body weight (in grams). Change in SUVmax (ΔSUVmax) was also calculated by using the following equation: ΔSUVmax = tumor SUVmax at 3 days after IRE − tumor SUVmax at baseline. The PET region of interest analysis was performed by X.W. and Z.S., both with more than 10 years of experience.
Axial T2-weighted turbo spin-echo images obtained for each animal were reviewed to measure the maximum lesion diameter (Dmax). These measurements were obtained for both baseline and 14-day follow-up interval images, and change in Dmax (ΔDmax) was calculated by using the following equation: ΔDmax = Dmax at 14 days after IRE − Dmax at baseline. Dmax was measured by Z.S. and X.W.
Tumor slides stained with H-E, CD34, and caspase-3 (four slices per tumor) were scanned at a magnification of ×20 and digitized by using the TissueFAXS system (TissueGnostics, Los Angeles, Calif). Images of H-E– and caspase-3–stained slides were analyzed with HistoQuest Cell Analysis software (TissueGnostics) by T.L. and C.S., both with more than 2 years of experience. The percentage of the tumor viable area (viable percentage = viable area/tumor area × 100%) was measured by using H-E–stained slices, and tumor cell apoptosis was measured according to the total number of caspase-3–positive cells in each specimen. For each specimen, we calculated an apoptosis index by using caspase-3–stained slices for tumor cell apoptosis and the following equation: apoptosis index = apoptotic cells/total of counted cells × 100%.
Statistical Analysis
Statistical calculations were performed with software (SAS, version 9.13; SAS Institute, Cary, NC). Data are presented as means ± standard deviations. The paired t test was used to compare in vivo ΔSUVmax and ΔDmax measurements in untreated tumors and IRE-treated tumors 3 days after IRE treatment. In vitro percentage of viable tumor and apoptosis index measurements were also compared between the IRE-treated group and the untreated group. Pearson correlation coefficients were calculated to assess the relationship between ΔSUVmax measured 3 days after treatment and corresponding ΔDmax and apoptosis index measured 14 days after IRE treatment in both treated and untreated tumors. With ΔSUVmax used as the dependent outcome and ΔDmax and treatment groups used as the independent variables, a multiple regression model was fit to observe the interaction between treatment group and ΔDmax. P < .05 was considered to indicate a statistically significant difference. The statistical analyses were performed by K.L., who is a biostatistician with 5 years of experience.
Results
Sixteen of 20 rats implanted with McA-RH7777 cells developed hepatoma (the 80% tumor induction rate is similar to our previously reported McA-RH7777 induction rates) (25). One rat was euthanized because of suture failure and wound dehiscence after the IRE procedure, and another rat was excluded because it became too ill to feed, urinate, and defecate. No postoperative complications were observed in the other rats. Fourteen rats were included in the study; 14 tumors were treated with IRE and 14 tumors were not treated.
All tumors were successfully visualized with MR imaging and PET/CT. Representative T1-weighted MR images, T2-weighted MR images, and PET/CT scans acquired at baseline and 3 days after IRE are shown in Figure 2. The tumor mass was identified on T1- and T2-weighted images; tumor tissues had a lower signal intensity on T1-weighted images (Fig 2, A) than on T2-weighted images (Fig 2, B) at baseline. This tumor demonstrated significant initial FDG activity (SUVmax = 3.75), as shown on the baseline fused FDG PET/CT image (Fig 2, C). Three days after IRE, the IRE-treated tumor and liver tissues surrounding the treated tumor demonstrated heterogeneous signal intensities on T1-weighted (Fig 2, D) and T2-weighted (Fig 2, E) images; after IRE treatment, FDG PET/CT demonstrated little residual metabolic activity (SUVmax = 1.22; ΔSUVmax = −2.53) (Fig 2, F).
Figure 2:

Representative axial, A, D, T1-weighted MR images, B, E, T2-weighted MR images, and, C, F, PET/CT scans obtained at baseline (top row) and 3 days after IRE treatment (bottom row) for 1.0-cm McA-RH7777 tumor (arrow). Tumor signal intensity was lower on T1-weighted images than on T2-weighted images at both baseline and 3 days after IRE. Tumors had substantial initial FDG activity on baseline fused FDG PET/CT images. FDG PET/CT scan obtained after IRE shows limited metabolic activity. In this specific case, SUVmax was 3.75 at baseline and 1.22 at 3 days after treatment.
Three days after IRE, the mean ΔSUVmax obtained from regions of interest was −1.91 ± 0.59 (n = 14) for IRE-treated tumors and 0.43 ± 0.38 for untreated tumors (n = 14); the differences between treated and untreated tumors were significant (P < .001) (Fig 3, A). The therapeutic efficacy of IRE treatment was evidenced as inhibition of tumor growth, with ΔDmax significantly greater for untreated tumors 14 days after IRE (P < .001) (Fig 3, B). There was a strong correlation between ΔSUVmax 3 days after IRE and ΔDmax 14 days after IRE in the treated tumors (R = 0.66, P = .01) (Fig 3, C), but there was no correlation in the control (untreated) tumors (R = 0.19, P = .54) (Fig 3, D).
Figure 3:

ΔSUVmax 3 days after IRE, ΔDmax 14 days after IRE, and correlation between ΔSUVmax and ΔDmax. A, Box-and-whisker plot shows significant differences in ΔSUVmax between treated and untreated tumors (P < .001). B, Box-and-whisker plot shows significant differences in ΔDmax between treated and untreated tumors (P < .001). C, Graph shows strong correlation between ΔSUVmax 3 days after IRE and ΔDmax 14 days after IRE in treated tumors (R = 0.66, P = .01). D, Graph shows no correlation between ΔSUVmax 3 days after IRE and ΔDmax 14 days after IRE in control (untreated) tumors (R = 0.19, P = .54).
Representative H-E–stained slices from treated tumor and control untreated tumor 14 days after IRE from the same rat are shown in Figure 4, A and B. Figure 4, A, shows treated tumor with 31% viable tumor tissue, and Figure 4, B, shows untreated tumor with 91% viable tumor tissue. Overall, H-E staining showed extensive tumor necrosis 14 days after IRE for treated tumors (viable tumor, 29.93% ± 7.51) compared with control untreated tumor (viable tumor, 78.86% ± 10.28) (P < .001) (Fig 4, C).
Figure 4:

A, B, Representative photomicrographs (H-E stain) of, A, treated and, B, untreated tumor 14 days after IRE from same rat. Scale bar = 10 mm. C, Bar chart shows significant difference in viable tumor between treated and untreated tumors 14 days after IRE (P < .001).
Representative CD34-stained slices for treated tumor and untreated tumor 14 days after IRE from the same rat are shown in Figure 5, A and B. CD34 slides showed remnant endothelial cells with inflammatory cell infiltration over a necrotic background for IRE-treated tumor (Fig 5, A); diffuse sinusoidal CD34 reactivity was observed for untreated control tumor (Fig 5, B). Representative caspase-3–stained slides in treated tumor and untreated tumor after IRE from the same rat are shown in Figure 5, C and D. Apoptosis index measurements significantly differed between IRE-treated tumors and control untreated tumors (mean, 25.12 ± 7.1 vs 5 ± 2.7, respectively; P < .001) (Fig 5, E). Moreover, there was a strong correlation between ΔSUVmax 3 days after IRE and apoptosis index 14 days after IRE in the treated tumors (Fig 5, F) (R = 0.57, P = .04), but not in untreated tumors (R = −0.409, P = .146). The multiple regression model showed that treatment group had a significant interaction with ΔDmax (P < .001).
Figure 5:

Tumor CD34 staining, caspase-3 staining, and quantitative measurement of apoptotic tumor cells. A, B, Photomicrographs (CD34 stain) of, A, treated and, B, untreated tumor 14 days after IRE from same rat. Scale bar = 100 µm. C, D, Photomicrographs (caspase-3 stain) of, C, treated and, D, untreated tumor 14 days after IRE from same rat. Scale bar = 100 µm. E, Bar chart shows significant difference in apoptosis index (AI ) measurements between treated and untreated tumors (P < .001). F, Graph shows strong correlation between ΔSUVmax 3 days after IRE and apoptosis index 14 days after IRE in treated tumors (R = 0.57, P = .04).
Discussion
IRE is a potentially highly effective tumor ablation technique. Imaging-based approaches for early postprocedural monitoring may be crucial for optimizing IRE treatment. Our study showed that tumor ΔSUVmax 3 days after IRE were well correlated with longitudinal therapeutic responses (ΔDmax and apoptosis index measurements of tumor growth inhibition 14 days after IRE therapy). We showed that 18F-FDG SUV measurements of early metabolic response to IRE-treated tumors can serve as an early imaging biomarkers for predicting therapeutic outcomes in a rodent hepatoma model; this finding has not previously been well established in the literature.
Patients with unresectable liver tumor or liver metastasis commonly undergo thermal ablation procedures involving cooling or heating of targeted tumor tissues with probes placed percutaneously (26). Although thermal ablation has gained widespread acceptance, these methods have also demonstrated several critical drawbacks that can limit efficacy in the clinical setting (4–6). IRE involves targeted delivery of electrical pulses to induce cell death through permanent cell membrane permeabilization (2,3). One of the most relevant parameters that affects therapeutic efficacy is the amount of viable tumor tissue left after the procedure.
In our study, a total of eight pulses of 100-μsec, 2000 V/cm square wave pulses were applied with 100-msec spacing. These specific IRE timing parameters were chosen to achieve IRE ablation of tumor tissue while avoiding the heating effect, on the basis of our previous studies (17,23,24).
Early postprocedure multimodal imaging for monitoring response may be crucial for optimizing IRE treatment by enabling clinicians to assess the amount of viable tumor tissue soon after the intervention. Great strides have been made in the use of multimodality imaging for evaluating patients with cancer (26). Performing both PET and MR imaging allows combining the quantitative metabolic information provided by PET with the unique features of MR imaging, including the excellent soft-tissue contrast and spatial resolution. In our study, MR images were acquired to characterize the tumor—in particular, its location and dimension—in order to plan the treatment in terms of the arrangement of electrodes and the parameters of the electric pulses. MR imaging data were also used to measure the dimension of tumor before and after IRE therapy. However, MR imaging can also provide additional qualitative and quantitative information about tissue function, microstructure, and perfusion (eg, through use of diffusion-weighted imaging and dynamic contrast material–enhanced imaging) (26). Nevertheless, PET sensitivity to metabolic changes is superior to that of MR imaging. The combination of PET and MR imaging has potential competitive advantages over PET/CT or MR imaging alone (25).
Only a few groups have evaluated IRE-treated tumors with 18F-FDG PET, and most of them acquired PET data at least 3 months after treatment in order to exclude the presence of residual viable tumor tissue (21,22). Investigators from a previous study proposed the use of PET to provide both guidance and early evaluation of the outcome of tumor ablation (20); however, that study was performed in a heterogeneous group of patients with different types of tumors treated with a range of ablation techniques, mainly radiofrequency and microwave ablation. An advantage of our study was the ability to validate our results with histologic evaluation.
One limitation of our study was the lack of serial PET monitoring after IRE treatment. Unfortunately, we could not obtain histologic and PET data at the same time point after treatment, so we have no direct information about the biologic basis of the SUV change in treated tumors; this might be due to inflammation or other factors instead of the presence of viable tumor tissue. However, this does not affect the prognostic value of our results. Ultimately, it will be crucial to determine whether a complete ablation covers the tumor volume and whether further ablation is necessary. Another limitation was that because MR imaging approaches described in this study probably depict anatomic information rather than direct effects on cell membrane integrity, additional functional MR imaging methods sensitive to membrane permeability ultimately may be warranted. Such methods could potentially be used to probe endogenous contrast mechanisms or use exogenous tracers to examine IRE ablation–related alterations in cellular uptake, activation state, or both. Finally, although histologic measurements were highly correlated with PET metabolic measurements of the IRE-treated tumors, a variable level of discrepancy between these measurements was clearly evident. However, these discrepancies were not entirely unexpected given the difficulties associated with correlating in vivo imaging results to histologic measurements at follow-up intervals after therapy. Future preclinical correlation studies in the setting of IRE therapy may benefit from the use of surgically implanted permanent fiducial markers to avoid such complications.
In conclusion, IRE induces metabolic changes that can be measured readily on 18FDG PET images. This study enabled us to confirm the feasibility of using 18FDG PET images to monitor responses to IRE treatment. 18F-FDG PET imaging biomarkers can be used for early detection of therapeutic response to IRE treatment in a rodent liver tumor model.
Practical application: Early changes in SUVs highlighted by PET may be important to inform practitioners about tumor metabolic changes induced within IRE ablation zones, related to the therapeutic response. This may permit timely adjustments to patient therapeutic regimen as needed to improve clinical outcomes.
Advances in Knowledge
■ In a rat model of liver tumor, metabolic uptake change (change in the maximum standardized uptake value [ΔSUVmax]) did not significantly differ between treated and untreated tumors (mean, −1.91 ± 0.59 and 0.43 ± 0.38, respectively; P < .001) 3 days after irreversible electroporation (IRE).
■ There was a strong correlation between ΔSUVmax 3 days after IRE and diameter change 14 days after IRE for the treated tumors (R = 0.66, P = .01), which suggests that the standardized uptake value can be an early biomarker of IRE outcome.
Implication for Patient Care
■ Fluorine 18 fluorodeoxyglucose PET metabolic biomarkers can be used for the early detection of therapeutic response to IRE treatment of liver tumors, which may permit timely adjustments to a patient’s therapeutic regimen as needed to improve clinical outcomes.
Received April 19, 2017; revision requested June 14; revision received July 31; accepted September 1; final version accepted September 25.
Supported by the National Cancer Institute (grants R01CA209886, R01CA196967).
X.W. and Z.S. contributed equally to this work.
Disclosures of Conflicts of Interest: X.W. disclosed no relevant relationships. Z.S. disclosed no relevant relationships. T.L. Activities related to the present article: disclosed no relevant relationships. Activities not related to the present article: is employed by Northwestern University. Other relationships: disclosed no relevant relationships. M.F. disclosed no relevant relationships. D.P. disclosed no relevant relationships. J.S. disclosed no relevant relationships. C.S. disclosed no relevant relationships. B.W. disclosed no relevant relationships. N.S. disclosed no relevant relationships. S.G. disclosed no relevant relationships. Q.M. disclosed no relevant relationships. A.C.G. disclosed no relevant relationships. K.L. disclosed no relevant relationships. J.W. disclosed no relevant relationships. R.J.L. disclosed no relevant relationships. R.S. Activities related to the present article: disclosed no relevant relationships. Activities not related to the present article: is a paid consultant for BTG. Other relationships: disclosed no relevant relationships. V.Y. disclosed no relevant relationships. A.C.L. disclosed no relevant relationships. Z.Z. disclosed no relevant relationships.
Abbreviations:
- Dmax
- maximum lesion diameter
- ΔDmax
- change in Dmax
- FDG
- fluorodeoxyglucose
- H-E
- hematoxylin-eosin
- IRE
- irreversible electroporation
- SUV
- standardized uptake value
- SUVmax
- maximum SUV
- ΔSUVmax
- change in SUVmax
References
- 1.Davalos RV, Mir IL, Rubinsky B. Tissue ablation with irreversible electroporation. Ann Biomed Eng 2005;33(2):223–231. [DOI] [PubMed] [Google Scholar]
- 2.Zhang Z, Li W, Procissi D, Tyler P, Omary RA, Larson AC. Rapid dramatic alterations to the tumor microstructure in pancreatic cancer following irreversible electroporation ablation. Nanomedicine (Lond) 2014;9(8):1181–1192. [DOI] [PMC free article] [PubMed] [Google Scholar]
- 3.Zhang Y, White SB, Nicolai JR, et al. Multimodality imaging to assess immediate response to irreversible electroporation in a rat liver tumor model. Radiology 2014;271(3):721–729. [DOI] [PMC free article] [PubMed] [Google Scholar]
- 4.Onik G, Mikus P, Rubinsky B. Irreversible electroporation: implications for prostate ablation. Technol Cancer Res Treat 2007;6(4):295–300. [DOI] [PubMed] [Google Scholar]
- 5.Al-Sakere B, André F, Bernat C, et al. Tumor ablation with irreversible electroporation. PLoS One 2007;2(11):e1135. [DOI] [PMC free article] [PubMed] [Google Scholar]
- 6.Edd JF, Horowitz L, Davalos RV, Mir LM, Rubinsky B. In vivo results of a new focal tissue ablation technique: irreversible electroporation. IEEE Trans Biomed Eng 2006;53(7):1409–1415. [DOI] [PubMed] [Google Scholar]
- 7.Al-Sakere B, Bernat C, Andre F, et al. A study of the immunological response to tumor ablation with irreversible electroporation. Technol Cancer Res Treat 2007;6(4):301–306. [DOI] [PubMed] [Google Scholar]
- 8.Maor E, Ivorra A, Leor J, Rubinsky B. The effect of irreversible electroporation on blood vessels. Technol Cancer Res Treat 2007;6(4):307–312. [DOI] [PubMed] [Google Scholar]
- 9.Vroomen LGPH, Scheffer HJ, Melenhorst MCAM, et al. MR and CT imaging characteristics and ablation zone volumetry of locally advanced pancreatic cancer treated with irreversible electroporation. Eur Radiol 2017;27(6):2521–2531. [DOI] [PMC free article] [PubMed] [Google Scholar]
- 10.Lin MX, Kuang M, Xu M, et al. Ultrasound and contrast-enhanced ultrasound for evaluation of irreversible electroporation ablation: in vivo proof of concept in normal porcine liver. Ultrasound Med Biol 2016;42(11):2639–2649. [DOI] [PubMed] [Google Scholar]
- 11.Rubinsky B, Onik G, Mikus P. Irreversible electroporation: a new ablation modality—clinical implications. Technol Cancer Res Treat 2007;6(1):37–48. [DOI] [PubMed] [Google Scholar]
- 12.Appelbaum L, Ben-David E, Sosna J, Nissenbaum Y, Goldberg SN. US findings after irreversible electroporation ablation: radiologic-pathologic correlation. Radiology 2012;262(1):117–125. [DOI] [PubMed] [Google Scholar]
- 13.Bennett GL, Krinsky GA, Abitbol RJ, Kim SY, Theise ND, Teperman LW. Sonographic detection of hepatocellular carcinoma and dysplastic nodules in cirrhosis: correlation of pretransplantation sonography and liver explant pathology in 200 patients. AJR Am J Roentgenol 2002;179(1):75–80. [DOI] [PubMed] [Google Scholar]
- 14.Rode A, Bancel B, Douek P, et al. Small nodule detection in cirrhotic livers: evaluation with US, spiral CT, and MRI and correlation with pathologic examination of explanted liver. J Comput Assist Tomogr 2001;25(3):327–336. [DOI] [PubMed] [Google Scholar]
- 15.Bartolozzi C, Lencioni R, Caramella D, Palla A, Bassi AM, Di Candio G. Small hepatocellular carcinoma: detection with US, CT, MR imaging, DSA, and Lipiodol-CT. Acta Radiol 1996;37(1):69–74. [DOI] [PubMed] [Google Scholar]
- 16.Ueda K, Kitagawa K, Kadoya M, Matsui O, Takashima T, Yamahana T. Detection of hypervascular hepatocellular carcinoma by using spiral volumetric CT: comparison of US and MR imaging. Abdom Imaging 1995;20(6):547–553. [DOI] [PubMed] [Google Scholar]
- 17.Guo Y, Zhang Y, Nijm GM, et al. Irreversible electroporation in the liver: contrast-enhanced inversion-recovery MR imaging approaches to differentiate reversibly electroporated penumbra from irreversibly electroporated ablation zones. Radiology 2011;258(2):461–468. [DOI] [PMC free article] [PubMed] [Google Scholar]
- 18.Latouche EL, Sano MB, Lorenzo MF, Davalos RV, Martin RC, 2nd. Irreversible electroporation for the ablation of pancreatic malignancies: a patient-specific methodology. J Surg Oncol 2017;115(6):711–717. [DOI] [PubMed] [Google Scholar]
- 19.Pant V, Sen IB, Soin AS. Role of 18F-FDG PET CT as an independent prognostic indicator in patients with hepatocellular carcinoma. Nucl Med Commun 2013;34(8):749–757. [DOI] [PubMed] [Google Scholar]
- 20.Ryan ER, Sofocleous CT, Schöder H, et al. Split-dose technique for FDG PET/CT-guided percutaneous ablation: a method to facilitate lesion targeting and to provide immediate assessment of treatment effectiveness. Radiology 2013;268(1):288–295. [DOI] [PMC free article] [PubMed] [Google Scholar]
- 21.Scheffer HJ, Vroomen LG, Nielsen K, et al. Colorectal liver metastatic disease: efficacy of irreversible electroporation—a single-arm phase II clinical trial (COLDFIRE-2 trial). BMC Cancer 2015;15(1):772. [DOI] [PMC free article] [PubMed] [Google Scholar]
- 22.Trueba-Arguiñarena FJ, de Prado-Otero DS, Poves-Alvarez R. Pancreatic adenocarcinoma treated with irreversible electroporation case report: first experience and outcome. Medicine (Baltimore) 2015;94(26):e946. [DOI] [PMC free article] [PubMed] [Google Scholar]
- 23.Guo Y, Zhang Y, Klein R, et al. Irreversible electroporation therapy in the liver: longitudinal efficacy studies in a rat model of hepatocellular carcinoma. Cancer Res 2010;70(4):1555–1563. [DOI] [PMC free article] [PubMed] [Google Scholar]
- 24.Zhang Y, Guo Y, Ragin AB, et al. MR imaging to assess immediate response to irreversible electroporation for targeted ablation of liver tissues: preclinical feasibility studies in a rodent model. Radiology 2010;256(2):424–432. [DOI] [PMC free article] [PubMed] [Google Scholar]
- 25.Li K, Gordon AC, Zheng L, et al. Clinically applicable magnetic-labeling of natural killer cells for MRI of transcatheter delivery to liver tumors: preclinical validation for clinical translation. Nanomedicine (Lond) 2015;10(11):1761–1774. [DOI] [PMC free article] [PubMed] [Google Scholar]
- 26.Lencioni R, de Baere T, Martin RC, Nutting CW, Narayanan G. Image-guided ablation of malignant liver tumors: recommendations for clinical validation of novel thermal and non-thermal technologies—a Western perspective. Liver Cancer 2015;4(4):208–214. [DOI] [PMC free article] [PubMed] [Google Scholar]