

Abstract
Multimedia-enhanced radiology report (MERR) development is defined and described from an informatics perspective, in which the MERR is seen as a superior information-communicating entity. Recent technical advances, such as the hyperlinking of report text directly to annotated images, improve MERR information content and accessibility compared with text-only reports. The MERR is analyzed by its components, which include hypertext, tables, graphs, embedded images, and their interconnections. The authors highlight the advantages of each component for improving the radiologist’s communication of report content information and the user’s ability to extract information. Requirements for MERR implementation (eg, integration of picture archiving and communication systems, radiology information systems, and electronic medical record systems) and the authors’ initial experiences and challenges in MERR implementation at the National Institutes of Health are reviewed. The transition to MERRs has provided advantages over use of traditional text-only radiology reports because of the capacity to include hyperlinked report text that directs clinicians to image annotations, images, tables, and graphs. A framework is provided for thinking about the MERR from the user’s perspective. Additional applications of emerging technologies (eg, artificial intelligence and machine learning) are described in the crafting of what the authors believe is the radiology report of the future.
©RSNA, 2018
SA-CME LEARNING OBJECTIVES
After completing this journal-based SA-CME activity, participants will be able to:
■ Describe the improved content of MERRs versus text-only reports, including ease of extraction of quantifiable information by use of hyperlinks to annotated images, tables, and graphs.
■ Discuss barriers to MERR implementation and the experiences of other specialties in interconnecting otherwise-incompatible systems such as PACS, radiology information systems, EMR systems, and cancer databases.
■ Identify initiatives in system and vendor compatibility and their contributions to the development of a more informative multidisciplinary system for patient care.
Introduction
The radiology report is the final representation of the radiology encounter by which radiologists communicate their interpretations and findings to clinicians and patients. In the report, the radiologist seeks to answer the queries that led the clinician to order imaging examinations in the first place as an integral part of patient care. This document has traditionally been narrative and text-only and has not significantly changed in format since Wilhelm Roentgen discovered the x-ray over 100 years ago (1), until now.
The purpose of the radiology report is to inform the reader (ie, the clinician, radiologist, researcher, or patient) of the information contained in the images regarding the state of the patient in the context of a medical disease model. This information can and should be communicated through various media, including text, images, tables, and graphs.
In an effort to improve the content and utility of radiology reports, several years ago we embarked on a collaboration with the vendor of our picture archiving and communication system (PACS) (Vue PACS version 12.1; Carestream Health, Rochester, NY) to codevelop capabilities to facilitate generation of quantitative tumor measurement data by the radiologist in a multimedia-enhanced radiology report (MERR). In this article, we interchange the term multimedia reports with MERRs that include but are not limited to the following components: hyperlinked text, tables, graphs, images, and, potentially, videos.
It has been described that there is an urgent need to change and modernize the radiology report. Toward a practical and modern solution to this and other needs, multiple attempts to improve radiology reports have been described (2,3), but the proposed systems have not been widely implemented. MERRs have been slow to evolve (2). This is likely due to information technology challenges, including the need for inter- and intracompatibility among the various components and vendors of PACS, radiology information systems, and electronic medical record (EMR) systems.
The MERR was born from a recognition of the limitations of traditional text-only reports and the capacity of technology to interconnect words with image annotations, which eliminates the need to hunt for measurements because they are available with a single click. Tables and graphs can be generated that present information in a form that expedites the annotation’s extraction. The MERR also facilitates findings interpretation and has uses and applications in daily patient care.
We describe the MERR in terms of its components and connections. Examining the radiology report from an informatics perspective provides a useful vantage point from which to analyze radiology report improvement with the use of available technologies. We analyze the capacity of the MERR components to improve the report’s information content and the user’s ability to extract information. We describe the success of a particular application of the MERR in our institution in terms of its capacity to meet clinicians’ information needs.
The MERR
Definition
The term multimedia comes from the concept of a medium as a tool to store and deliver information; the word multimedia represents communications that incorporate multiple forms of information content and processing. The MERR is a set of information containing components and interconnections (eg, hyperlinks to image annotations) that establish a close relationship between the main components: structured text and selected images that represent the most critical findings.
Description of Components and Features: Informatics Perspective
The MERR is a set of information containing components and interconnections. In concert, these features determine the dimensions of the report’s informativeness—the content information and its ease of extraction by the user. The components include but are not limited to text, tables, graphs, and images (Fig 1a). The interconnections include hypertext and hyperlinks, and they combine various formats (eg, annotated images, embedded images in the text, and components juxtaposed on the same page or on adjacent pages) into a composite report entity.
Figure 1a.

(a) MERR for a 77-year-old woman with muscle-invasive bladder cancer with lung metastases. Hyperlinks point to select computed tomographic (CT) images and their annotations (dashed blue arrows show which hyperlink goes to which image). The graphs and measurement tables on the right can be signed off as a separate tumor report, which is available in our PACS (Vue PACS version 12.1) under a separate tab. The top left graph shows the sum of target lesion changes in diameter over time. The top right graph shows changes in diameter for three individual target lesions. RECIST = Response Evaluation Criteria in Solid Tumors. (b) Venn diagram compares the components of a traditional text-only report (dark blue oval) with those of a MERR (light blue oval). The core radiology report components (eg, identification, comparison examination dates, findings, and impression) are contained in both reports. The MERR uses hyperlinks to establish optimal connections among the various forms of media used: tables organize data for calculation, graphing, and exportation; graphs depict disease burden; and embedded images can often speak for themselves.
In a traditional radiology report, the description and interpretation of imaging findings are done with text. The MERR improves on this process in two ways: (a) it includes additional media and formats (eg, images, tables, graphs), and (b) it provides connections that enable searches tailored to the data needs and sequences of the user’s thought processes. Figure 1b provides an overview of the components of a typical radiology report relative to the additional components of a MERR.
Figure 1b.

(a) MERR for a 77-year-old woman with muscle-invasive bladder cancer with lung metastases. Hyperlinks point to select computed tomographic (CT) images and their annotations (dashed blue arrows show which hyperlink goes to which image). The graphs and measurement tables on the right can be signed off as a separate tumor report, which is available in our PACS (Vue PACS version 12.1) under a separate tab. The top left graph shows the sum of target lesion changes in diameter over time. The top right graph shows changes in diameter for three individual target lesions. RECIST = Response Evaluation Criteria in Solid Tumors. (b) Venn diagram compares the components of a traditional text-only report (dark blue oval) with those of a MERR (light blue oval). The core radiology report components (eg, identification, comparison examination dates, findings, and impression) are contained in both reports. The MERR uses hyperlinks to establish optimal connections among the various forms of media used: tables organize data for calculation, graphing, and exportation; graphs depict disease burden; and embedded images can often speak for themselves.
Given that the fundamental purpose of the radiology report is to communicate information, analysis of the informativeness (ie, the capacity to inform) of the components of the MERR and their integration is an intuitively logical and natural approach to assessing and understanding the advantages of the MERR.
A key quality of the optimal report is its informativeness from the user’s perspective, which has two dimensions: (a) the adequacy of the data provided in the report’s content to answer the questions and inform the tasks for which the imaging examination was ordered, and (b) the time and effort required by the user to extract and use the information. The second factor is important because the learning effort necessary to extract and use the required data directly influences the report’s utility and readability.
Text
The report is a series of statements that communicate information to referring physicians; it records information for future use and serves as a legal record to document an episode of care. The report consists of statements comprising components such as anatomic location (system and organ review) and is commonly divided into sections on findings, diagnostic impression, and the radiologist’s recommendation. The information can be presented as free text or in a structured format (4). A consistently organized report that is standardized across a department can improve both dimensions of informativeness—information content and ease of extraction—by presenting the user with a consistent content and format and by providing the radiologist with a template (similar to a checklist) that prompts identification and interpretation of the findings to minimize the chance of missed observations. Toward improving radiology report text content, Kahn et al (5) have suggested that new templates be created for structured reporting to maximize the value added by the radiologist to patient care. Multimedia reports can (but are not required to) include structured reports organized according to RadLex® templates (6) to improve consistency and search (human and machine) report content predictability.
Tables
Tables provide a presentation format for text and numeric data that facilitates their extraction and use. Tables concentrate this information in one part of the report (resulting in a high information-to–ink space ratio) and organize it in a readily analyzable format, which optimizes searches.
The table format enables short search paths and facilitates easy comparative analysis of differences because of the juxtaposition of data. The table is an apt and efficient format for recording data about multiple items categorized in a few dimensions. Useful tables available to date display multiple lesion measurements from serial imaging examinations and record the locations and nature of abnormalities. Structured lists of measurements and other quantifiable data are easily exportable, allowing for efficient data management with fewer errors (described in the section on “Data Management for Oncology”).
Graphs
As with tables, graphs collect numeric data into one area of the report, enabling shorter searches and easier use. By encoding numbers as spatial locations, graphs express the information contained in numeric data as visible spatial patterns. As seen in our application to tumor imaging (see the section on “MERRs in Oncology”), graphs of serial measurements of tumor size provide the MERR user with a visual appreciation of a tumor’s growth pattern over time and with a trajectory of important features (eg, growing or shrinking components, the timing and magnitude of peaks).
Graphs and tables are automatically incorporated into tumor reports (for example) once lesions in similar anatomic locations are labeled as targets and are related as follow-up sets in an interactive “bookmark” list. The bookmark list is a tool in our PACS that organizes all annotations, values, and measurement metadata in a structured format, with configurable columns such as description field (eg, “new lesion”), target lesion, and lesion type (eg, “lung”). In addition to preparing tumor measurement data for exportation, radiologists can open the bookmark list to see lesion labels such as “target,” “nontarget,” and “unspecified.” The interactive bookmark list is also integrated with the images, in that one can click on lesion data in a table and be taken directly to that annotation on the study (the study is opened in the PACS if it is not already displayed). This allows the PACS to generate target lesion graph plots and tables that contain measurement metadata.
The capability of relating lesion measurements over time for calculations and graphing is most enhanced by longitudinal image registration. For example, when a radiologist makes a measurement in our PACS, a message pops up (when applicable) that the measurement is similar in location to one from a prior examination, automatically relating each lesion over time. When lesions are volumetrically segmented in similar anatomic regions, this can be done automatically by using a tool called the lesion tracking tool, as described previously (7). Use of this follow-up feature has been shown to save time, with more consistency, when the segmentations are successful (8).
Images
The value of images in increasing the informativeness of the report derives from the images being the source of the findings on which the interpretation is based, their efficiency in communicating spatial-anatomic information, and the limitations of text descriptions and measurements in capturing that information. The use of images embedded in reports increases the reader’s understanding of the nature and strength of the evidence and enhances the credibility of the interpretation. It allows for more efficient extraction of image information and facilitates reinterpretation of the findings in light of new information or new clinical questions.
Report-Image Interconnections
The key interconnection between the various components of multimedia reports is the hyperlinked text description connected to the image annotation—the interactive nature between what the radiologist is referring to in the report and the actual finding on the specific image section. As discussed later in this article, we believe that these report-image interconnections will be instrumental in enhancing machine learning tools that relate radiologists’ text descriptions to associated imaging findings.
Hyperlinks.—Multimedia reporting has been discussed for many years (9). However, to the authors’ knowledge, its implementation in clinical practice has only recently been described (10,11). Hyperlinking of statements in the report to imaging findings facilitates reading of the report and image interpretation by the user by (a) reducing the time and effort needed to visualize the findings on which the interpretation is based, (b) enabling immediate evaluation of an imaging finding and clarification of the meaning of its description in the report (mitigating the limitations and ambiguities of verbal report language [“a picture is worth a thousand words”]), and (c) allowing further assessment of features beyond what is communicated in the text (ie, reinterpretation of the findings in light of new information or new clinical questions).
Use of hypermedia allows for immediate branching to (and display of) useful information during the course of reading the report, resulting in a much more efficient use of space and an easier search pattern for key images and imaging findings. This ease of use encourages deeper analysis of the primary image data, as well as validation of the radiologist’s measurements and lesion selection, such as index or target lesions.
Hyperlinks direct clinicians to the measurements or other annotations that radiologists deem crucial, therefore establishing connections between the text report and the images. These connections are expanded when the radiologist, while dictating a native report, says “hyperlink” while an annotation is active. By doing this, the location (ie, the series and section numbers) of the annotation is automatically included in the report as a uniform record locator (URL) address. We have found this capability to be the main advantage of using multimedia reports at our clinical center. MERR hyperlinks are available for CT, magnetic resonance (MR) imaging, and positron emission tomography (PET) examinations and within tomosynthesis examinations.
In 2013, radiologists and PACS administrators at the National Institutes of Health (NIH) Clinical Center prepared for a major PACS upgrade that included multimedia reporting—most notably, the ability to import measurement annotations as hyperlinked text in the report. Before implementation, we provided presentations for our radiologists and oncologists, which were followed by an online survey of their reporting preferences (eg, hyperlinks, tables of measurements, and graphs of treatment response plans) (10).
We compared radiologists’ dictation times before we implemented the hyperlink capability to their dictation times after the upgrade (which included hyperlinked measurements and key images of measured lesions in reports). There was no significant (P = .53) difference in dictation times for radiologists, but there was a nearly threefold increase in oncologists’ efficiency in extracting measurements (12). There have also been additional time savings for radiologists at follow-up imaging, where prior examinations have hyperlinked bookmarks and are much easier to find and remeasure. However, because we are convinced that the overall process is more efficient, we have not assessed this time savings. Hyperlinked lesion measurements within the report appear as follows: “(3 cm × 2.1 cm) (series 4, image 35).” Dictating the words “insert priors” in the compulsory comparison field automatically imports up to two same-modality prior-report hyperlinks and takes the radiologist or referring clinician to these prior reports in a click. The prior examination is automatically loaded and color coded in a mini-archive and is registered with current for additional time savings.
Measurements that are automatically imported into the report when the radiologist dictates “hyperlink” include their appropriate units (eg, Hounsfield units, linear measurements, angles, regions of interest, volumetric size, and volumetric density). Arrows or ovals indicating an abnormality such as a filling defect can direct the clinician to an arrow pointing to the filling defect on the image. Examples include arrows to tiny collections of free air, the outline of an abscess, or a small pneumothorax. Figures 1a and 2 illustrate the advantages of hyperlinks.
Figure 2.

Multimedia chest tomosynthesis report for a 53-year-old woman with mesothelioma. Hyperlinks direct the referring clinician to the image section with the specific finding. In this example from our PACS, the dashed blue arrow leads from a hyperlink to the corresponding image, which shows a loculated air-fluid level (yellow arrow).
Key Images Embedded in Reports.—The embedding of images in the report is another means of connecting the components of the MERR. Their placement enables an immediate visual shift from one component to another (Fig 3). For example, including image pairs that show baseline metastatic disease and progressive disease can add value for the clinician and the patient (Fig 4). Now that multiplanar reformatting and three-dimensional rendering are widespread in many PACS “on the fly,” the time is now for advanced processing technology to be routinely distributed to clinicians and patients through multimedia reporting.
Figure 3.

Sample multimedia radiology report from our PACS includes hyperlinks and a three-dimensional chest CT image that shows a volumetrically segmented large mediastinal mass (thymoma) (green).
Figure 4.

Three-dimensional CT image pair in a 72-year-old man with bladder cancer shows all metastatic lesions and their progression over time. As part of a research trial, lesions greater than 1 cm were volumetrically segmented as discrete objects (green) in our PACS to demonstrate distribution and metastatic disease progression at a glance. On the baseline image (left), the metastatic lesions include the left iliac nodal chain with one pathologic left retroperitoneal node, and one left lung nodule. The follow-up image (right) shows more extensive disease in these areas, in addition to mediastinal adenopathy and diffuse metastatic lesions in the lungs. The patient or clinician can immediately appreciate marked disease progression at a glance, rather than reading a narrative report and/or waiting for images to be available and then hunting through thousands of sections to get essentially the same information that is shown on this image pair.
Other Available Multimedia Solutions in Radiology
There are a variety of other types of available multimedia reporting solutions in radiology, including an open-source program called ePAD (electronic Physician Annotation Device) (13) that graphs annotations that are designed to be compatible with the Annotation and Image Markup (AIM) standard. Because MERRs encourage the use of measurement annotations and associated metadata, compatibility across vendors and institutions becomes more important; the AIM standardized format is an initiative that sets the stage for this compliance (see the section on “Compatibility”).
The Multi-Modality Tumor Tracking (MMTT) application on the IntelliSpace Portal platform (Koninklijke Philips, Amsterdam, the Netherlands) is used after PACS image exportation (used as input) and semiautomatically generates tumor burden assessment criteria calculations (Fig 5). Baseline and follow-up examinations are sent to the IntelliSpace Portal server. Baseline and follow-up examinations, along with quantitative results, are loaded into the MMTT, where they are semiautomatically registered. Target measurements are organized in tables, and RECIST (or other criteria) calculations are performed and graphed.
Figure 5.

Sample multimedia radiologic oncology report from the IntelliSpace Portal shows the system’s tumor-tracking capabilities. (Courtesy of Koninklijke Philips.)
Some applications are third-party solutions and include multimedia reports that are separate from the radiology report. For example, Mint Lesion software (Mint Medical, Hamilton, NJ) allows RECIST and many other criteria to be assessed while generating graphs and tables (Fig 6a).
Figure 6a.

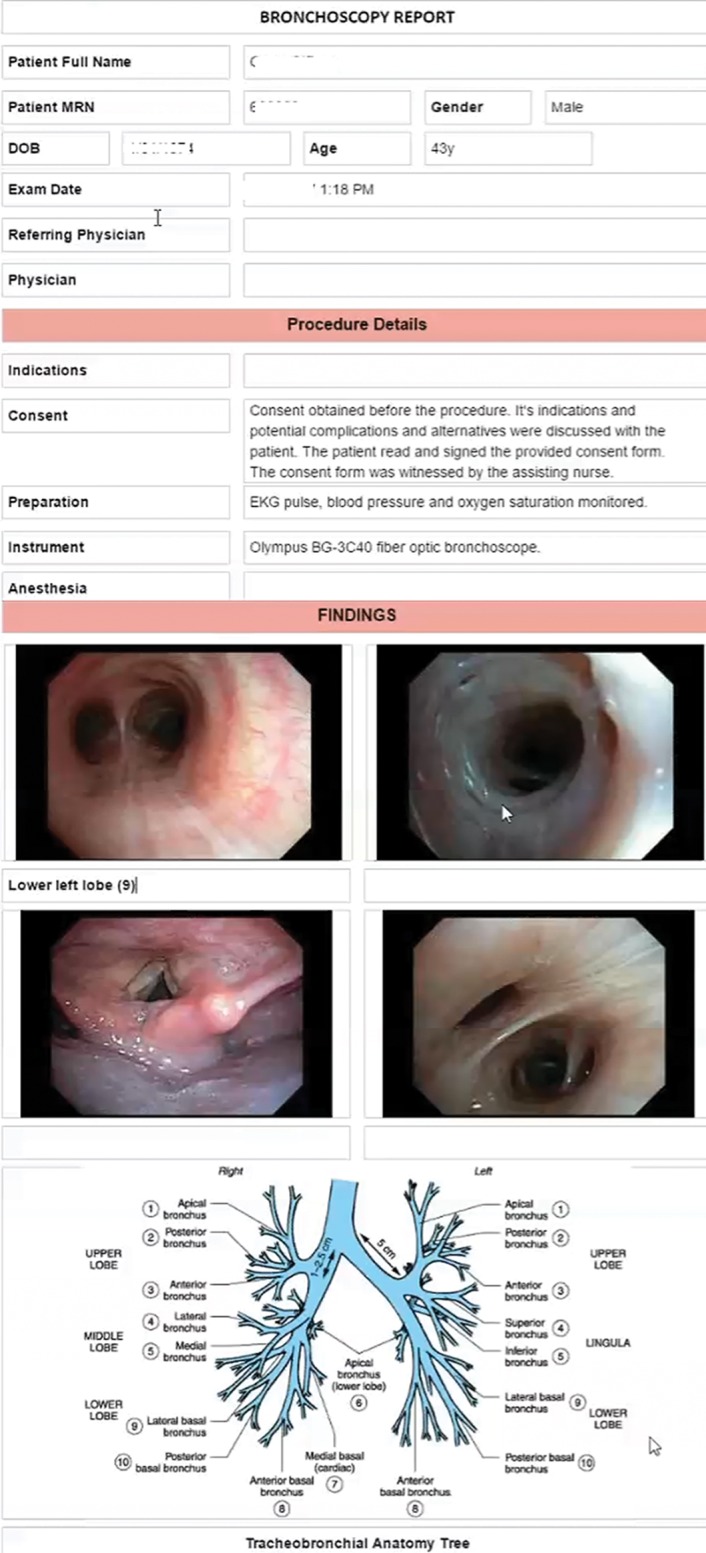
(a) Multimedia report from the Mint Lesion system shows the components of a lung cancer staging and screening report. (Courtesy of Mint Medical.) (b) Multimedia bronchoscopy report from the Orpheus Clinical Media Platform includes procedural images and an anatomic drawing. (Courtesy of Orpheus Medical.)
The Orpheus Clinical Media Platform (Orpheus Medical, New York, NY) is compatible with multiple PACS and EMR systems and allows linking of videos obtained in any format to reports (Fig 6b). Videos can be stored in the Orpheus platform or in another platform (user dependent). Orpheus can also provide a report platform where customizable templates can be used; the structured report can include images, diagrams (for better anatomic explanations), and links. The report is then converted into a PDF and can be stored in the Orpheus platform and/or in the EMR system.
Figure 6b.
(a) Multimedia report from the Mint Lesion system shows the components of a lung cancer staging and screening report. (Courtesy of Mint Medical.) (b) Multimedia bronchoscopy report from the Orpheus Clinical Media Platform includes procedural images and an anatomic drawing. (Courtesy of Orpheus Medical.)
OneDX software (OneDX, Westport, Conn) is another solution that allows images to be included in the report; after PDF report generation, the report is shareable among different vendors.
The Genetics Information Systems Suite (SCC Soft Computer, Clearwater, Fla) includes reporting capabilities such as autopopulated canned messages that are based on result entry, free-text edits, spell-checking, placement of images and graphs in reports, and user-definable reporting templates.
Agfa HealthCare (Mortsel, Belgium) offers a web-based platform that allows key images, tables, and measurements to be added to reports from different specialties, such as radiology (Fig 7) and cardiology. Radiologists can opt to use digital dictation and off-line or online speech recognition, and a mobile lightweight (thin) client lets them create, edit, and approve reports remotely on their mobile device. Results can be distributed by fax, print, e-mail, or the Web or to the EMR system.
Figure 7.

Multimedia report from the Agfa HealthCare platform includes a needle-localization mammogram (bottom right) and a correlative breast MR image (bottom left). (Courtesy of Agfa HealthCare.)
The Cerner Clinical Imaging system (Cerner, Kansas City, Mo) provides the ability to store, manage, and access all types of multimedia within the EMR system. Figure 8 shows a cardiac catheterization report that includes images of involved arteries and an anatomic diagram to clearly demonstrate areas of narrowing or stenosis. Before this type of reporting was used, it was difficult to convey the extent of disease with text alone.
Figure 8.

Multimedia cardiac catheterization report from the Cerner Clinical Imaging platform includes a diagram and images of the involved anatomy. (Courtesy of Cerner.)
Application of the MERR in Radiologic Oncology and Other Imaging Scenarios
MERRs in Oncology
Several years ago, we surveyed oncologists and radiologists at the NIH Clinical Center and determined that multimedia reports with improved quantification techniques would be more informative for oncologists than traditional reports (10). Travis et al (14) have reported that oncologists prefer communication of lesion measurements in a separate report section, rather than the current practice of embedding measurements in radiology reports. Another survey that evaluated MERRs found that other specialties also found MERRs to be potentially useful (15).
Several methods have been developed to categorize therapeutic response in cancer trials on the basis of serial follow-up CT examinations; most commonly, the RECIST guidelines are used to categorize therapeutic response in terms of the direction and magnitude of changes over time. The RECIST guidelines are summarized in Table 1.
Table 1:
RECIST 1.1 Categories for Target Lesions

Note.—Oncologists use these standard criteria to assess therapeutic response in cancer trials. Radiologists should avoid using the classification “stable disease” in the report impression unless calculations are done on verified target lesions and are compared with the baseline examination or the best response.
Our major application has been in cancer imaging because MERRs enable presentation of measurement data in a more efficient format for assessment of therapeutic response. For example, measurement tables produced from our bookmark list also include RECIST target lesion calculations, which produce graphs of changes in target lesion size over time. When the baseline dates, target lesion selections, and measurements have been validated, calculations can allow same-day RECIST category determination. Our patients often know their therapeutic response status before they travel home.
Hyperlinking the description of each target lesion in the report to the measurement annotation helps the oncologist find the lesion and verify the precision of the size measurements. It also allows assessment of other features of the lesion (eg, necrosis or hemorrhage) that relate to the aptness of its selection as a target lesion and to the interpretation of the tumor’s response (16).
Graphs of changes in lesion size over time can help the radiologist produce a more informative report by taking into account findings from the baseline examination rather than from only the last prior examination. Figure 9 provides an example of how the radiology report impression “stable metastatic disease,” which was arrived at by comparing the current findings to those from the last prior examination (rather than from the baseline examination), without RECIST calculations, could contradict the oncologist’s response determination, as described elsewhere (17).
Figure 9.

Graphs displayed in our PACS show how the radiology report impression “stable metastatic disease” could contradict the oncologist’s response determination (see Table 1) if findings at the second follow-up are compared with findings from the first follow-up only (dashed blue circle), instead of with baseline findings or the best response. In this case, the RECIST calculation reflects a lesion size decrease of more than 30% (32.5%; dashed red oval), which is categorized as “partial response.” A radiologist report impression that inappropriately concludes “stable disease” results in a perceived discrepancy by the oncologist and the patient because “stable disease” is a different category than “partial response” as calculated here (how therapeutic response is determined by oncologists and the guidelines).
For example, a radiologist could compare the current findings to those from the last prior examination and find a millimeter-smaller short axis of one lesion, thus making the conclusion of “stable disease” in the report impression. However, the small change since the baseline results in a response calculation of a 31% decrease in size, which represents “partial response.” This conveys a discrepancy not only to the oncologist, but also to the patient viewing the record in the patient portal (18,19).
Our previous text-only reports did not always include the tumor size information needed by oncologists to apply response criteria and were deemed inadequate, according to our survey results. Therefore, the necessary measurements were commonly done by the oncologists or with the radiologists in tumor measurement sessions after reporting, which compounded inefficiency.
This seems to be the case at other cancer centers as well. Jaffe et al (20) surveyed oncologists from 55 National Cancer Institute–funded cancer centers and concluded that radiologists could improve their tumor reporting to optimize treatment efficacy. However, when the same authors surveyed radiologists, they found that incorporating quantitative measurements and RECIST calculations into radiology reports can be time consuming and tedious and is often limited when compared with oncologists’ assessments of tumor burden (21). In our experience, the use of multimedia reports has encouraged radiologists to more consistently quantify their findings, which addresses some of these gaps and improves report content, especially in oncology (11).
Before we implemented multimedia reporting (eg, hyperlinked text to image annotations), we provided several presentations to radiologists to prepare for the “go-live” updates, and our body radiologists agreed to measure all lesions previously measured to further improve the consistency of measurements in cancer trials.
Data Management for Oncology.—Bookmark lists allow a radiology assistant to establish a baseline date when a patient is enrolled in a cancer trial. In addition, validated target lesion selections and measurements now allow same-day RECIST category determinations within the PACS for the first time at our cancer center. Oncologists benefit from having measurement annotations available in bookmark lists, where the baseline date is available from that point on. Graphs and RECIST calculations are presented as a complementary tumor report (an extension of the radiology report) that appears to the right of the hyperlinked text report and images (Fig 1a).
Bookmark lists are exportable into RECIST forms and databases, which eliminates handwritten measurements, through interfaces such as the Exportable Notation and Bookmark List Engine (ENABLE) (22), which further improves efficiency. The ENABLE interface is available as open source on GitHub (23) and extracts RECIST data, performs calculations, and can also build data models for import into cancer databases such as Labmatrix (BioFortis, Columbia, Md) (used at our cancer center) and for data compilation that helps generate waterfall and other data-visualization plots (24) for cohort best-response analysis in a cancer trial.
MERRs in Other Clinical Scenarios
Hyperlinks and graphs can be beneficial for other conditions where it is important to visualize pathologic progress parameters over time. For example, graphs can be helpful for quantitatively depicting infectious disease characteristics such as infiltrate burden and cavity or fluid collection sizes over time (Fig 10). We often use links, tables, and graphs when following genetic diseases such as cytotoxic T-lymphocyte antigen–4 (CTLA-4) deficiency disease (25) to show at a glance reduction of lymphadenopathy after treatment. Figure 11 shows a dual-energy x-ray absorptiometry (DXA) structured multimedia report (with measurements that are automatically imported into the report) that is becoming more commonly used at the NIH Clinical Center.
Figure 10.

Multimedia report for a 53-year-old woman with chronic aspergillosis. A, Radiology report from the current examination (fifth follow-up) includes hyperlinks to images obtained at baseline and at the current examination. B, Axial CT image shows a target lesion measured at baseline for lesion tracking. C, Axial CT image shows the same target lesion measured at the current examination. D, Two cavitary lesions were followed as targets (only one is shown in B and C), with graph plotting and lesion size changes calculated within our PACS in a supplemental report. The top left graph depicts the total tumor burden (including the additional lesion not shown in the images), and the top right graph shows the two target lesions followed. The blue line in the right graph corresponds to the lesion shown in B and C, and the red line corresponds to the additional lesion not shown.
Figure 11.

Example of a dual-energy x-ray absorptiometry (DXA) structured multimedia report for a 27-year-old male patient at the NIH Clinical Center. Measurements are automatically imported into the DXA report.
Use of Multimedia Reports in Nonradiologic Specialties
Many medical specialties, although less “imaging centric” than radiology, are benefiting by including images in their reports. Roth et al (26) have described the challenges of “enterprise imaging” to combine providers’ report types across different specialties, with all images part of the EMR system. Enterprise imaging is an important set of imaging initiatives, strategies, and workflows implemented across a health care enterprise to optimally capture, index, manage, store, distribute, view, exchange, and analyze all clinical images and multimedia content to enhance the EMR. From the necessity to obtain more informative reports and with technological advances, more challenges are emerging in the development of a comprehensive yet complementary medical network where all patient examinations and images would be available in enterprise image viewers.
Figures 12–16 provide examples of multimedia reports used in specialties such as ophthalmology (Fig 12), where Boland (27) describes a goal for ophthalmology data management to be completely digital, following Digital Imaging and Communications in Medicine (DICOM) standards with integrated multimedia data. An example of multimedia ophthalmology reporting with use of pictorial storyboards from the Novorad system (Novorad, American Fork, Utah) is shown in Figure 13 (28). Figure 14 shows a sample gastroenterology report available as a PDF in our EMR system that includes representative endoscopic images.
Figure 12.

Sample multimedia report from a typical ophthalmologic image management system. (Reprinted, with permission, from reference 27.)
Figure 16a.

Two examples of multimedia reports used in pathology. (a) Image-enhanced pathology telereport provides an enhanced clinical context rather than isolated imaging studies. (Reprinted, with permission, from reference 30.) (b) Multimedia report from the Sectra Digital Pathology system includes histopathologic and imaging findings and supports radiology and pathology image sharing. (Courtesy of Sectra.)
Figure 13.

Multimedia ophthalmology report with pictorial storyboard for a 58-year-old woman. The top row includes images from the fundus examination (left); a gadolinium-enhanced orbital MR image with normal findings (middle); and data describing a visual field testing defect (right). The bottom row includes an optical coherence tomographic (OCT) image (left) with normal retinal layers, an OCT image fused with an indocyanine green angiogram (middle), and a retinal topography with retinal nerve fiber layer (RNFL) change analysis report that shows thinning over time (red areas). A baseline photograph of the patient’s eyes, which was used for assessment of physical appearance, was included in the report but is not shown. (Reprinted, with permission, from reference 28.)
Figure 14.

Multimedia report of a gastrointestinal study at the NIH. The images correspond to critical findings that are available in the EMR system, which is available one click away from the PACS.
Cardiovascular multimedia reports used in health centers with the Medstreaming VIS system (Medstreaming, Redmond, Wash) (29) allow multimedia report creation and integration within the EMR system, PACS, and structured reporting infrastructure (Fig 15).
Figure 15.

Multimedia vascular report from the Medstreaming VIS system incorporates text, diagrams, tables, and images. (Courtesy of Medstreaming.)
Crowley et al (30) have reported clinicians’ desire to include pathology images in a multimedia EMR system (Fig 16a), as well as the technical and organizational challenges of this incorporation. New pathology software is available, such as Sectra Digital Pathology (Sectra, Linköping, Sweden) (31), that uses PACS information technology for pathology; supports image sharing between pathology and radiology (Fig 16b); and allows full case overview, including review of pathology images from different cameras and other systems and patient information from the EMR system.
Figure 16b.

Two examples of multimedia reports used in pathology. (a) Image-enhanced pathology telereport provides an enhanced clinical context rather than isolated imaging studies. (Reprinted, with permission, from reference 30.) (b) Multimedia report from the Sectra Digital Pathology system includes histopathologic and imaging findings and supports radiology and pathology image sharing. (Courtesy of Sectra.)
Although radiology has traditionally been a leading specialty from a technological perspective, the radiology community must broaden its horizons to be on the same level with other medical specialties that are producing multimedia reports and implementing them in their daily workflows.
Issues and Challenges in MERR Implementation
The technical components necessary to implement the MERR described here include the following capabilities provided by our PACS. Our radiology reports are stored as DICOM structured reports in our PACS. When radiologists dictate the word “hyperlink,” the last annotation instance is imported into the report as a link. These links are stored in the PACS as part of the DICOM structured report. The resultant bookmark lists of measurements, metadata, and other annotations are stored in the PACS database. MERR development at the NIH was done in cooperation with our PACS vendor; however, the MERR is part of the available released version and was not a custom development done specifically for the NIH.
From a hardware perspective, our PACS generally runs on a single server, with a backup server and additional research servers. Although our radiology information system functions more as a worklist manager, the integration is smart enough to understand which examination is opened for reporting.
Although our dictation system is native to the PACS, other configurations can include third-party dictation systems, with import of the hyperlinks performed by a variety of methods, depending on the hardware and infrastructure configurations.
While implementing and applying the MERR, we looked at report creation, objectives, and uses and examined how advances in informatics, word processing, and image processing could improve the various components and help avoid the limitations imposed by traditional text report formats and report generation systems.
Because standards are not yet established for incorporating multimedia reports and annotations, vendor link implementation to images and examinations may differ. In our PACS, hyperlinks are generated by simply dictating the word “hyperlink” to automatically import annotation measurement metadata, such as series and section numbers, the name of the person who performed the measurement, and other metadata, as previously described (11). This has been a time savings in our department, supported by universal adoption in studies requiring consistent measurements.
There are several options for storing reports. Depending on the EMR system architecture, one option is to generate a hyperlink-containing PDF document (eg, rich text/encapsulated) that is pushed to the EMR system. Our PACS vendor provides a thin-client option called Vue Motion version 12.0 (Carestream Health) that is available by clicking on a link in our EMR system that takes clinicians directly to the patient’s examination images, where the report links function similarly to those in a standard PACS. These clicks are currently tracked to help objectively verify report value by click-through-rate analysis.
There is a hypertext markup language (HTML) “zero-integration” option that allows external facilities to send studies by way of standard DICOM reports and to fill patient details by using a zero-footprint HTML5 interface. Referring physicians may also receive an e-mail alerting them that results are ready for review, again depending on the system’s security requirements.
Before we implemented use of the MERR, several cancer-trial oncologists were already consulting regularly with our dedicated tumor-assessment radiologist to agree on baseline target lesions. This process was enhanced by the MERR in that all measurements can now be managed in our PACS and exported more accurately (10,22). These workflows can be adopted without MERRs and may be more efficient, especially when radiologists remain consistent with measurements on follow-up examinations. The MERR is simply an adjunct tool to the process, allowing direct import of measurements and metadata (eg, series and image numbers, lesion categorization, name of the staff member who performed the measurement, and lesion location). Capabilities already exist at many facilities or can be upgraded between modalities and PACS of different vendors. One example of interoperability success is the Nuance dictation system (Nuance Communications, Burlington, Mass) paired with the Fujifilm PACS (Fujifilm Medical Systems U.S.A., Stamford, Conn) (Fig 17).
Figure 17.

Obstetric ultrasonography (US) multimedia report provides an example of a dictation system from Nuance Communications that is combined with a PACS from Fujifilm Medical Systems U.S.A. The structured report with quantification is manageable from a data-exporting and data-mining perspective, and the inclusion of key images adds value. (Courtesy of Nuance Communications.)
Efficiency
If the implementation of new features into reports were to significantly increase the time and effort that radiologists and clinicians must invest when creating or interpreting reports, this change would typically not be accepted or implemented by radiology departments. Therefore, in radiology report evolution, we must consider adding value (eg, MERRs) with improved efficiency for radiologists, while facilitating content extraction for referring clinicians.
When we began including hyperlinks in our reports in February 2015, we assessed radiologists’ interpretation times and found that it did not take radiologists longer to apply hyperlinks (12); in fact, we believe that interactive reporting is faster in that we use hyperlinks routinely now. Visiting residents and fellows quickly adapt to our reporting system, implementing advanced capabilities such as hyperlinks and basic segmentation tools within a few hours and starting same-day case dictation in most instances. After the first few months of hyperlink implementation at our institution, our body radiologists were using hyperlinks in most CT reports. As of May 2017, 94% of our body CT reports include hyperlinks (Fig 18), while about 9% of our neuroradiology reports include hyperlinks. Our MR imaging reports have fewer bookmarks overall, with about 70% of body MR imaging reports having hyperlinks and 1% of neuroradiology MR imaging reports containing hyperlinks. Most annotations are also hyperlinks (about 90%); those that are not links often include Hounsfield unit values (eg, for renal cysts) or additional measurements not worthy of linking to the text. Although there are fewer hyperlinks in our MR imaging reports, hyperlinks can be especially helpful in research examinations, which may have over 20 imaging sequences and thousands of images, in that they direct the user to the specific sequence and image without the need to open multiple series to find the measurement. We are also able to add hyperlinks to US images, which saves time now that cine images can add up to thousands of images.
Figure 18.

Graph depicts the rising percentage of body CT reports that contain hyperlinks at the NIH Clinical Center after multimedia reports were implemented in February 2015. We are confident that our continuous routine adoption of hyperlinks reflects their effectiveness and informativeness.
About 40% of our PET/CT reports have bookmarks (annotations made with or without hyperlinks). However, a smaller percentage of those (about half) are hyperlinked in reports. We believe that this relates to the traditional use of making standardized uptake value measurements (some for relative quantifications); however, many of those are not of suitable clinical value to justify creating hyperlinks from those annotations.
There may be variability in the multimedia report adoption cultures among radiology specialties and modalities that is worthy of future analysis beyond the scope of this article. The differences we have noted are not surprising because body CT has the most demand for consistent measurements in cancer trials; hence, body CT reports contain the most bookmarks and hyperlinks.
Challenges
There may be unintended consequences when implementing MERRs, such as incompatibility of hyperlinks outside of reports in the PACS (eg, in the EMR system) that may not manifest at isolated testing. We are exploring the option to send reports as an encapsulated PDF, where the links should direct the user to images by opening the thin client from the EMR system.
Some cancer centers offset the tedious measurement process performed by radiologists by using tumor assessment cores. These cores include technologists (supervised by radiologists) who assist with tumor measurements for RECIST and volumetric segmentations, three-dimensional rendering, and other image processing. We have a separate order that we call “image processing” for such services to sustain our core (32). However, there are initial resource costs when implementing such as system, and the relative uptake values for separate tumor reports may be disproportionate.
Tables 2 and 3 describe the advantages and disadvantages of various types of equipment and workflows when considering use of tumor assessment services as an example of exploiting multimedia reporting capabilities.
Table 2:
Use of a Clinical PACS versus a Third-party Dedicated Quantitative Mini-PACS as the Data Source for Cancer Trial Measurement Metadata

Note.—At the NIH, we manage all measurements in our PACS since our survey results showed that 93% of our oncologists prefer to manage lesion measurements as the single source of truth, where data remain raw on the PACS form rather than being handwritten or duplicated in an additional system.
Table 3:
Comparison of Various Tumor Assessment Workflows Incorporating Multimedia Reports that Include Bookmark Lists and Relation over Time

Note.—When developing new workflows, one should consider staffing and technology resources.
We also ask our radiology assistants to help the radiologists locate and measure established target lesions and relate them over time (33). This is often done before the radiologists interpret the findings, which saves time for radiologists because they do not have to measure or decipher which lesions are targets. The radiologist can simply jump to each bookmark and dictate “hyperlink” to automatically have the radiology assistant's measurement, image, and section number imported into the report; minimal visual cross-checking saves further time.
Compatibility
Although multimedia reporting and annotation management currently is vendor specific, there are efforts to standardize these evolving capabilities. For example, initiatives such as AIM (34) and DICOM for Qualitative Imaging (DICOM4QI) (35) are helping guide vendors and users in making annotations available and preventing duplicated efforts. For example, at the NIH Clinical Center, we often need to remeasure lesions from outside incompatible image data sent with the referred patient because the prior measurement annotations are rarely available. Most often, measurement data are only available on handwritten RECIST forms that have been mailed, faxed, or uploaded as images in the PACS.
In the last year, we have been fortunate to receive an increasing number of outside examination reports containing annotations that are embedded as DICOM objects or that can otherwise be manipulated and hidden, as well as other multimedia reports (Fig 19) that include annotations and hyperlinks (however, the links are not yet compatible). We are working with outside institutions and vendors to improve interhospital compatibilities.
Figure 19.

Example of a multimedia report in our PACS from a referral center. From left to right, the screenshot shows an examination list with thumbnail images (left), a color multiplanar volume-rendered coronal reformation (top left middle), a DICOM structured injector report from the referral center (bottom left middle), an axial CT image with our measurement of a growing mediastinal node (top right middle), an outside annotated CT image (bottom right middle), and an outside radiology report from the University of Virginia Health System (right) that includes hyperlinks. We are working on the compatibility of outside annotations and links as standards evolve. (Radiology report [Vue PACS version 12.1] courtesy of the University of Virginia Health System, Charlottesville, Va.)
Beyond intervendor compatibility, efforts are underway to achieve compatibility among different specialty systems with the EMR system. The Healthcare Information and Management Systems Society (HIMSS) and the Society for Imaging Informatics in Medicine (SIIM) (36) have described collaborative efforts to meet the needs of clinical users to review many content types within an enterprise electronic health record. A single multipurpose application, called the enterprise image viewer, is an effort to answer this emerging need to connect the EMR system to each specialty’s niche systems.
We are fortunate to have a close working relationship with our PACS vendor, including a research agreement to help design and implement advanced systems such as coregistration, automated segmentation over time with relation, and multimedia reporting. However, the implementation of complex systems may require additional and advanced information technology resources that we take for granted at our institution.
Discussion
We have described our experience with MERR implementation. The hyperlinking of measurements and report statements to imaging findings facilitates report reading and image interpretation by (a) reducing the effort needed by the user to visualize the findings, and (b) enabling immediate and easy evaluation of imaging findings, clarification of the meaning of the descriptions in the report, and assessment of features beyond those communicated in report text. These capabilities can mitigate the typical limitations and ambiguities of verbal report language, thus exemplifying the fact that “a picture is worth a thousand words” and facilitating reinterpretation of findings in light of guided information.
For example, directed graphs provide a visual depiction of the sequence of disease processes and manifestations and provide a concise representation of the diagnostic inferences in the report captured in a single view. Graphs of tumor size over time provide a depiction of the growth trajectory of each target tumor. Important features of an individual tumor’s growth trajectory become immediately apparent (eg, periods of growth, shrinkage, and stability; nadir; peaks), along with similarities or differences in patterns among target lesions. For example, a plot of the mean sum of tumor diameters (RECIST index) provides a visual depiction of overall tumor response, which is the fundamental information needed for the oncologist’s objective quantitative assessment of tumor response over time.
The Report of the Future: Multimedia, Natural Language Processing, Machine Learning/Deep Learning
Radiology and other specialties that benefit from imaging have the obligation to advance and evolve by creating reports that contain as many visual tools as possible to address clinicians’ and patients’ concerns. Multiple enterprise imaging strategies, software, and workflows are being developed, and this process will continue to move in what we believe is the right direction. The report of the future must include complementary images, videos, and graphs and be available for clinicians and patients at the point of care, becoming more available in enterprise imaging (37,38) to facilitate more efficient decision making and to decrease unnecessary examinations.
It is intuitive, with a minimal learning effort, for clinicians and patients to extract multimedia report information, which can be accessed anytime and anywhere. These benefits have been described by Chen and Shih (39). The integration of report text and images enhances extraction of image data (“the images are data”) (40), which is a prerequisite for radiomics, where researchers can semantically search for report finding context, which is now related through hyperlinked context with image content. For example, a reference to a finding of peripheral paraseptal tiny lung cysts (which are commonly found in recently described genetically defined diseases) can be systematically searched based on report context and image content with linked image annotations (41). At the NIH,we have been exploring harmonizing the link structure and searching with genetic data because all patients enrolled in NIH studies at our clinical center are genetically tested. We have previously described the power of hyperlinked text from reports to image annotations, findings, and radiomic lookup tables (41). For example, radiologists, visiting residents, and fellows encountering rare genetically defined diseases at the NIH can open a table hosted on an intranet wiki (collaborative website) that connects a gene mutation to a finding that is hyperlinked deep within an examination. One example that we have previously described is lung and adenopathy findings at CT in patients with CTLA-4 mutations (25). Before these new diseases are published, we benefit from interactive lookup tables to guide us in the expected findings.
In addition to combining the advances of natural language processing and hyperlinks, there are opportunities to harmonize hyperlinks and bookmark data with machine learning. As more of our cross-sectional imaging findings are linked to associated context, machine learning should be enhanced with semantic contextual searching combined with content searching of annotated images. Our Imaging Biomarkers and Computer-aided Diagnosis Laboratory has described report and interleaved text/imaging deep mining in our PACS (42). Now that hyperlinked radiology report text is connected to the image annotations, this labeling can fill a major gap in machine learning—the labeling required for supervised deep learning.
In addition, teams at the National Cancer Institute have been applying volumetric tumor assessment criteria, including one that we developed years ago (43) that analyzes tumor heterogeneity by volumetric density (in addition to tumor size in cubic centimeters). In addition to easier management of data in bookmark tables versus handwritten data, annotated data on tumor heterogeneity are now linked directly to the report text.
In addition to quality improvement and quality assurance applications (eg, turn-around times and closed-loop communication of critical findings), we believe that hyperlinked images will enhance established decision support. For example, we are developing natural language processing in the workflow so that when key context combinations are dictated (eg, “mosaic attenuation”), associated conditions or findings will prompt the radiologist to comment on other pertinent negative findings (eg, normal-sized pulmonary arteries).
We continue to work closely with our PACS vendor on further advances in computer-aided diagnosis (6). In addition to automated follow-up segmentations provided by image space (x, y) and z axis (table position) refined registration, we are looking into total body segmentation, beginning to refine to small-bowel segmentation emanating from mesenteric vessels (44). Combined with natural language processing capabilities that will become available within a year, we hope to provide real-time detection of context relation to content, so that when a radiologist measures a lesion on the left adrenal gland but incorrectly dictates “right,” the computer-assisted diagnosis natural language processor will warn the radiologist of the potential error. This would be in addition to more basic applications, such as alerting the radiologist to discrepant terms in the report body and impression (eg, “left adrenal nodule” mentioned in the findings and “right adrenal nodule” mentioned in the impression).
Lastly, in addition to analyzing click-through rates from our EMR system to our images and reports, we are able to objectively verify report value by analyzing hyperlink click-through rates by institute (eg, the National Cancer Center, the NIH Clinical Center), ordering provider medical specialty, and radiologist subspecialty (45). Comparing these rates across prescribing primary investigators will not only verify their reading of our reports; more importantly, it will describe what they are clicking on and how often and will provide data across specialties, institutions, and clinics.
Conclusion
The advantages of the MERR described here highlight the general power of each component to improve report informativeness and are applicable to other radiologic-diagnostic venues and to many other medical specialties.
Multimedia reporting is particularly suitable for diagnostic imaging by virtue of the readily identifiable information and data-bearing entities (eg, images, reports, and annotated images) and the processes that relate them. Hyperlinked text to annotations within images better directs clinicians and patients to key findings. Moreover, graphs direct consideration of the information needs of the user and assessment of the system in terms of how well the data-containing output products meet those needs.
We believe that the radiology community should continue to advance and align with other specialties that are embracing the power of multimedia reporting, while utilizing recent technological advances that allow global communication and information to be available at our fingertips.
Acknowledgments
Acknowledgments
The authors are grateful to Andrea B. Apolo, MD, for imaging review; Bradley Otterson, NIH Library Writing Service, for manuscript review; and Uzel Gulbu, MD, for sharing her experience of how the MERR has helped her management of patients with CTLA-4 mutations.
For this journal-based SA-CME activity, the authors L.R.F. and L.B.M. have provided disclosures (see “Disclosures of Conflicts of Interest”); the other author, the editor, and the reviewers have disclosed no relevant relationships.
Supported in part by the Intramural Research Program of the National Institutes of Health Clinical Center. The content of this manuscript is solely the responsibility of the authors and does not necessarily represent the official views of the National Institutes of Health.
Deceased.
Disclosures of Conflicts of Interest.— : L.R.F. Activities related to the present article: research agreement with Carestream Health; patent issued for multi grayscale overlay window. Activities not related to the present article: disclosed no relevant relationships. Other activities: disclosed no relevant relationships. L.B.M. Activities related to the present article: research agreement with Carestream Health. Activities not related to the present article: author royalties from Springer Publishing. Other activities: patent issued for portable imaging marker displaying upright angle.
Abbreviations:
- AIM
- Annotation and Image Markup
- CTLA-4
- cytotoxic T-lymphocyte antigen–4
- DICOM
- Digital Imaging and Communications in Medicine
- EMR
- electronic medical record
- MERR
- multimedia-enhanced radiology report
- NIH
- National Institutes of Health
- PACS
- picture archiving and communication system
- RECIST
- Response Evaluation Criteria in Solid Tumors
References
- 1.Eisenberg RL. Radiology: an illustrated history. St Louis, Mo: Mosby, 1992. [Google Scholar]
- 2.Bellon E, van Cleynenbreugel J, Suetens P, et al. Multimedia e-mail systems for computer-assisted radiological communication. Med Inform (Lond) 1994;19(2):139–148. [DOI] [PubMed] [Google Scholar]
- 3.Kurdziel KA, Hopper KD, Zaidel M, Zukoski MJ. “Robo-Rad”: an inexpensive user-friendly multimedia report system for radiology. Telemed J 1996;2(2):123–129. [DOI] [PubMed] [Google Scholar]
- 4.Rubin DL. Creating and curating a terminology for radiology: ontology modeling and analysis. J Digit Imaging 2008;21(4):355–362. [DOI] [PMC free article] [PubMed] [Google Scholar]
- 5.Kahn CE, Jr, Langlotz CP, Burnside ES, et al. Toward best practices in radiology reporting. Radiology 2009;252(3):852–856. [DOI] [PubMed] [Google Scholar]
- 6.Hong Y, Kahn CE, Jr. Content analysis of reporting templates and free-text radiology reports. J Digit Imaging 2013;26(5):843–849. [DOI] [PMC free article] [PubMed] [Google Scholar]
- 7.Folio LR, Choi MM, Solomon JM, Schaub NP. Automated registration, segmentation, and measurement of metastatic melanoma tumors in serial CT scans. Acad Radiol 2013;20(5):604–613. [DOI] [PubMed] [Google Scholar]
- 8.Folio LR, Sandouk A, Huang J, Solomon JM, Apolo AB. Consistency and efficiency of CT analysis of metastatic disease: semiautomated lesion management application within a PACS. AJR Am J Roentgenol 2013;201(3):618–625. [DOI] [PMC free article] [PubMed] [Google Scholar]
- 9.Schramm C, Goldberg M, Pagurek B. Multimedia radiological reports: creation and playback. J Digit Imaging 1989;2(2):106–113. [DOI] [PubMed] [Google Scholar]
- 10.Folio LR, Nelson CJ, Benjamin M, Ran A, Engelhard G, Bluemke DA. Quantitative radiology reporting in oncology: survey of oncologists and radiologists. AJR Am J Roentgenol 2015;205(3):W233–W243. [DOI] [PMC free article] [PubMed] [Google Scholar]
- 11.Machado LB, Apolo AB, Steinberg SM, Folio LR. Radiology reports with hyperlinks improve target lesion selection and measurement concordance in cancer trials. AJR Am J Roentgenol 2017;208(2):W31–W37. [DOI] [PMC free article] [PubMed] [Google Scholar]
- 12.Folio LR, Yazdi AA, Merchant M, Jones EC. Initial experience with multi-media and quantitative tumor reporting appears to improve oncologist efficiency in assessing tumor burden [abstr]. In: Radiological Society of North America scientific assembly and annual meeting program [book online]. Oak Brook, Ill: Radiological Society of North America, 2015. https://rsna2015.rsna.org/program/.
- 13.Rubin DL, Willrett D, O’Connor MJ, Hage C, Kurtz C, Moreira DA. Automated tracking of quantitative assessments of tumor burden in clinical trials. Transl Oncol 2014;7(1):23–35. [DOI] [PMC free article] [PubMed] [Google Scholar]
- 14.Travis AR, Sevenster M, Ganesh R, Peters JF, Chang PJ. Preferences for structured reporting of measurement data: an institutional survey of medical oncologists, oncology registrars, and radiologists. Acad Radiol 2014;21(6):785–796. [DOI] [PubMed] [Google Scholar]
- 15.Sadigh G, Hertweck T, Kao C, et al. Traditional text-only versus multimedia-enhanced radiology reporting: referring physicians’ perceptions of value. J Am Coll Radiol 2015;12(5):519–524. [DOI] [PubMed] [Google Scholar]
- 16.Tang PA, Pond GR, Chen EX. Influence of an independent review committee on assessment of response rate and progression-free survival in phase III clinical trials. Ann Oncol 2010;21(1):19–26. [DOI] [PubMed] [Google Scholar]
- 17.Ali KB, Shah SN, Rini BI, et al. Discrepancy between reported progressive disease per radiology report and treating oncologist tumor measurements in patients with metastatic renal cell carcinoma (mRCC) receiving sunitinib. J Clin Oncol 2012;30(5 suppl):420. [Google Scholar]
- 18.Chang PJ, Sevenster M, Travis AR, et al. Improved efficiency and error-reduction of oncology lesion measurement and follow-up via optimized PACS workflow orchestration and integration of an AIM (annotation and image markup)–based lesion tracking tool [abstr]. In: Radiological Society of North America scientific assembly and annual meeting program. Oak Brook, Ill: Radiological Society of North America, 2012; 186. [Google Scholar]
- 19.Sevenster M, Chang P, Bozeman J, et al. Radiologic measurement dictation and transcription error rates in RECIST (Response Evaluation Criteria in Solid Tumors) clinical trials: a limitation of the radiology narrative report to accurately communicate quantitative data [abstr]. In: Radiological Society of North America scientific assembly and annual meeting program. Oak Brook, Ill: Radiological Society of North America, 2013; 221. [Google Scholar]
- 20.Jaffe TA, Wickersham NW, Sullivan DC. Quantitative imaging in oncology patients. II. Oncologists’ opinions and expectations at major U.S. cancer centers. AJR Am J Roentgenol 2010;195(1):W19–W30. [DOI] [PubMed] [Google Scholar]
- 21.Jaffe TA, Wickersham NW, Sullivan DC. Quantitative imaging in oncology patients. I. Radiology practice patterns at major U.S. cancer centers. AJR Am J Roentgenol 2010;195(1):101–106. [DOI] [PubMed] [Google Scholar]
- 22.Goyal N, Apolo AB, Berman ED, et al. ENABLE (Exportable Notation and Bookmark List Engine): an interface to manage tumor measurement data from PACS to cancer databases. J Digit Imaging 2017;30(3):275–286. [DOI] [PMC free article] [PubMed] [Google Scholar]
- 23.Exportable Notation and Bookmark List Engine (ENABLE) source code . GitHub website. https://github.com/Ngoyal95/ENABLE. Accessed January 2018.
- 24.Gillespie TW. Understanding waterfall plots. J Adv Pract Oncol 2012;3(2):106–111. [PMC free article] [PubMed] [Google Scholar]
- 25.Kuehn HS, Ouyang W, Lo B, et al. Immune dysregulation in human subjects with heterozygous germline mutations in CTLA4. Science 2014;345(6204):1623–1627. [DOI] [PMC free article] [PubMed] [Google Scholar]
- 26.Roth CJ, Lannum LM, Persons KR. A foundation for enterprise imaging: HIMSS-SIIM collaborative white paper. J Digit Imaging 2016;29(5):530–538. [DOI] [PMC free article] [PubMed] [Google Scholar]
- 27.Boland MV. Moving to modern ophthalmic image management: what you need to know before taking the plunge into digital image management systems. Ophthalmol Manage 2014;18:48–51. [Google Scholar]
- 28.Kotowski J, Wollstein G, Folio LS, Ishikawa H, Schuman JS. Clinical use of OCT in assessing glaucoma progression. Ophthalmic Surg Lasers Imaging 2011;42(4 suppl):S6–S14. [DOI] [PMC free article] [PubMed] [Google Scholar]
- 29.VIS: vascular information system. Medstreaming website. http://www.medstreaming.com/Products/VIS. Updated 2018. Accessed January 2018.
- 30.Crowley RS, Gadd CS, Naus G, Becich M, Lowe HJ. Defining the role of anatomic pathology images in the multimedia electronic medical record: a preliminary report. In: Proceedings of the AMIA annual symposium [book online]. Bethesda, Md: AMIA, 2000; 161–165. https://knowledge.amia.org/amia-55142-a2000a-1.606968/t-001-1.609408/f-001-1.609409/a-033-1.609878/an-033-1.609879?qr=1. Accessed January 2018. [PMC free article] [PubMed] [Google Scholar]
- 31.Digital pathology . Sectra website. http://www.sectra.com/medical/. Updated February 26, 2017. Accessed January 2018.
- 32.Radiology and Imaging Sciences Clinical Image Processing Service . National Institutes of Health Clinical Center website. https://clinicalcenter.nih.gov/drd/info/cips.html. Updated June 22, 2017. Accessed January 2018.
- 33.Fenerty KE, Patronas NJ, Heery CR, Gulley JL, Folio LR. Resources required for semi-automatic volumetric measurements in metastatic chordoma: is potentially improved tumor burden assessment worth the time burden? J Digit Imaging 2016;29(3):357–364. [DOI] [PMC free article] [PubMed] [Google Scholar]
- 34.Zimmerman SL, Kim W, Boonn WW. Informatics in radiology: automated structured reporting of imaging findings using the AIM standard and XML. RadioGraphics 2011;31(3):881–887. [DOI] [PubMed] [Google Scholar]
- 35.Fedorov A, Rubin D, Clunie D, et al. Interoperable communication of quantitative image analysis results using the DICOM standard [abstr]. In: Radiological Society of North America scientific assembly and annual meeting program [book online]. Oak Brook, Ill: Radiological Society of North America, 2016. DOI:archive.rsna.org/2016/16004734.html. Accessed January 2018. [Google Scholar]
- 36.Roth CJ, Lannum LM, Dennison DK, Towbin AJ. The current state and path forward for enterprise image viewing: HIMSS-SIIM collaborative white paper. J Digit Imaging 2016;29(5):567–573. [DOI] [PMC free article] [PubMed] [Google Scholar]
- 37.Dennison DK. Image sharing: is it missing from your enterprise imaging strategy? Life Image website. http://www.lifeimage.com/solutions. Accessed January 2018.
- 38.Integrating the healthcare enterprise . IHE International website. http://www.ihe.net/. Accessed January 26, 2017.
- 39.Chen W, Shih CC. Architecture of portable electronic medical records system integrated with streaming media. J Med Syst 2012;36(1):25–31. [DOI] [PubMed] [Google Scholar]
- 40.Gillies RJ, Kinahan PE, Hricak H. Radiomics: images are more than pictures, they are data. Radiology 2016;278(2): 563–577. [DOI] [PMC free article] [PubMed] [Google Scholar]
- 41.Folio L, Malayeri A, Montealegre G, et al. Spectrum of paraseptal cystic CT lung findings as seen in several evolving genetically defined diseases, highlighting application of a radiogenomic lookup table [abstr]. In: Radiological Society of North America scientific assembly and annual meeting program. Oak Brook, Ill: Radiological Society of North America, 2016; 189. [Google Scholar]
- 42.Shin H, Lu L, Kim L, Seff A, Yao J, Summers RM. Interleaved text/image deep mining on a large-scale radiology database for automated image interpretation. J Mach Learn Res 2016;17(1):3729–3759. [Google Scholar]
- 43.Folio LR, Turkbey EB, Steinberg SM, Apolo AB. Viable tumor volume: volume of interest within segmented metastatic lesions, a pilot study of proposed computed tomography response criteria for urothelial cancer. Eur J Radiol 2015;84(9):1708–1714. [DOI] [PMC free article] [PubMed] [Google Scholar]
- 44.Zhang W, Liu J, Yao J, et al. Mesenteric vasculature-guided small bowel segmentation on 3-D CT. IEEE Trans Med Imaging 2013;32(11):2006–2021. [DOI] [PMC free article] [PubMed] [Google Scholar]
- 45.Gaskin C, Folio L. Creating value via analytics and AI-driven interactive radiology reports. Presented at the 2018 annual meeting of the HIMSS, Las Vegas, Nev, March 5–9, 2018. [Google Scholar]