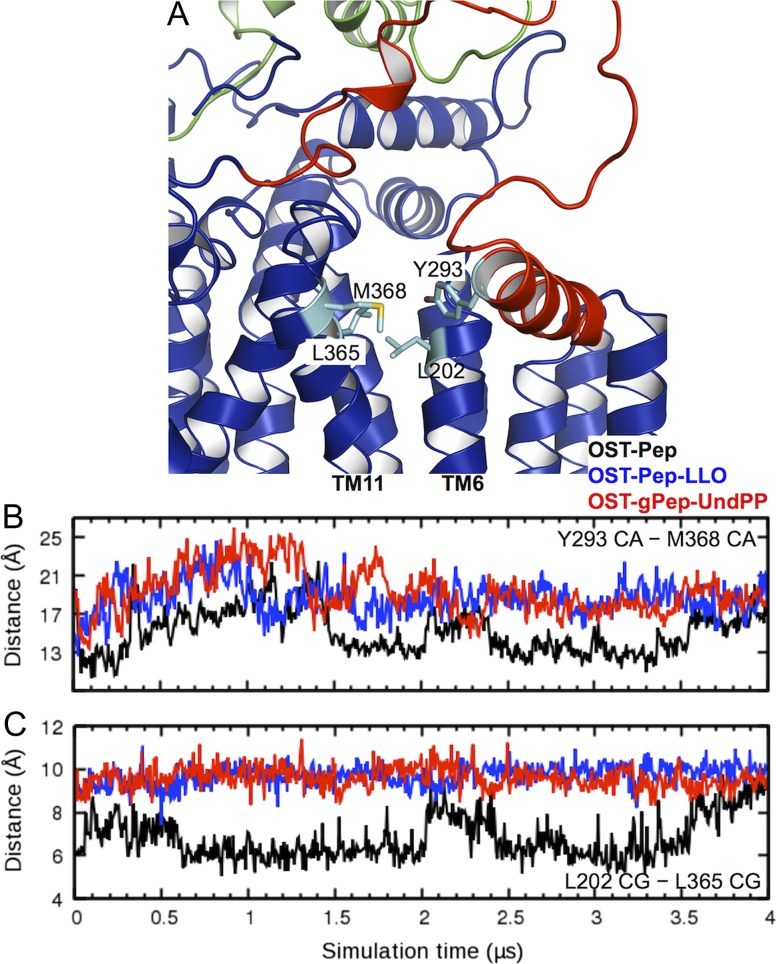
Fig. 6.
Deviations of EL5-h from the hydrophobic groove and its conformational changes. (A) A representative structure to show the key residue positions. (B) Time-series of the Cα distance between Y293 and M368 in OST-Pep (black), OST-Pep-LLO (blue), and OST-gPep-UndPP (red). (C) Time-series of the Cγ distance between L202 and L365. This figure is available in black and white in print and in color at Glycobiology online.

