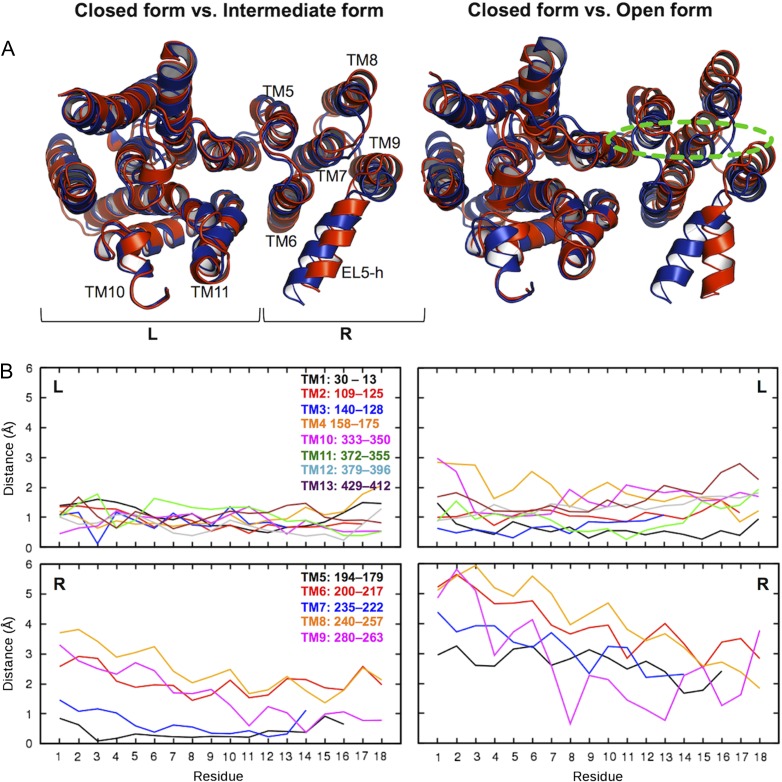
Fig. 7.
Conformational changes of TM domain. (A) Superposed structure pairs. The closed form is colored blue. The intermediate (left) and open (right) forms are colored red. Dotted green line indicates an approximate position of the carbohydrate moiety of LLO. These representative structures were chosen based on the L202−L365 Cγ distance in Figure 6C: the closed form (2.58 μs in OST-Pep, showing the minimum distance within 2.5−3.0 μs), the intermediate form (2.40 μs in OST-Pep, showing the maximum distance within 2.0−2.5 μs), and the open form (3.81 μs in OST-Pep-LLO, showing the maximum distance within 3.0−4.0 μs). “R” and “L” in the plots indicate right and left TM helix bundle, respectively. (B) Plots of Cα-atom displacements of the closed form from the intermediate or open form for each TM helix. The residue numbers in the plots are not the residue sequences of ClPglB, but counted from the periplasmic side for each TM helix. This figure is available in black and white in print and in color at Glycobiology online.

