

Abstract
The polydispersity of hyaluronan (HA) presents challenges for analyzing its solution properties, such as the relationship between mass and particle size. The broad mass range of natural HA (≤50-fold) makes molecular characterization difficult and ambiguous compared to molecules with known molecular weights (e.g., proteins). Biophysical studies show that large >MDa HA behaves like a random coil, whereas very small (e.g., 10 kDa) HA behaves like a rod. However, the mass range for this conformational transition is not easily determined in natural polydisperse HA. Some HA receptors (e.g., CD44 and HARE) initiate signaling responses upon binding HA in the 100–300 kDa range, but not larger MDa HA. Size-dependent responses are studied using nonnatural HA: purified narrow-size range HA [Pandey MS, Baggenstoss BA, Washburn J, Harris EN, Weigel PH. 2013. The hyaluronan receptor for endocytosis (HARE) activates NF-κB-mediated gene expression in response to 40–400 kDa, but not smaller or sarger, hyaluronans. J Biol Chem. 288:14068–14079] and very narrow size range Select-HA made chemo-enzymatically [Jing W, DeAngelis PL. 2004. Synchronized chemoenzymatic synthesis of monodisperse hyaluronan polymers. J Biol Chem. 279:42345–42349]. Here, we used size exclusion chromatography and multiangle light scattering to determine the weight-average molar mass and diameter of ~60 very narrow size preparations from 29 to 1650 kDa. The ratio of HA mass to HA diameter showed a transition in the 150–250 kDa size range (~65 nm). The HA rod-to-coil transition occurs within the size range that specifically activates cell signaling by some receptors. Thus, size-specific signaling could be due to unique external receptor•HA conformation changes that enable transmembrane-mediated activation of cytoplasmic domains. Alternatively and more likely, transition-size HA may enable multiple receptors to bind the same HA, creating new internal signal-competent cytoplasmic domain complexes.
Keywords: CD44, HARE/STAB2, LYVE-1, RHAMM, TLR2/4
Introduction
The solution properties and characteristics of hyaluronan (HA) have been studied extensively using a diverse array of biophysical techniques and instruments, including atomic force microscopy (Cowman et al. 1998), optical force probe assays (Chang et al. 2016), equilibrium centrifugation (Hokputsa et al. 2003), gel electrophoresis (Bhilocha et al. 2011; Cowman et al. 2011) and MALS with detection by either refractive index (Baggenstoss and Weigel 2006), intrinsic viscosity (Mendichi et al. 2003; Podzimek et al. 2010), both together (La Gatta et al. 2010) or by flow field-flow fractionation (Kim et al. 2015). Many of these studies examined the relationship between HA mass and size, generally radius (e.g., radius of gyration), by assessing how HA intrinsic viscosity [η] varies with its mass (e.g., the Mark–Houwink relationship: η = KMa, where M is mass and a and K depend on the solute conditions).
Molecular modeling and NMR studies have elucidated the conformation of HA oligos and the detailed molecular interactions between the HA oligos and the HA-binding Link domains of TSG-6 (Higman et al. 2014) and CD44 (Banerji et al. 2007; Jamison et al. 2011). However, technical issues currently limit and preclude the use of NMR or modeling studies with HA larger than 10 sugars; 6- and 8-mers are used most often. Thus, current structural data are necessarily biased toward an HA structure that is very short and rod-like. It should be expected, therefore, that the details of molecular interactions determined between an HA oligo and a receptor (or just its Link domain) may not be fully recapitulated in a complex between full-length intact (membrane bound) HA receptor and much larger signaling HA (e.g., 200 kDa). Some interactions found with the smaller partners may be altered or missing, due to exclusion or hindrance, and new interactions may be present between other regions of the binding partners which are missing in the model system interactions.
West et al. (1985) reported that HA fragments between 4 (an octamer) and 25 disaccharides (~10 kDa) were signaling competent to initiate angiogenesis and that large MDa HA or extensively digested HA (i.e., mostly tetra- and hexa-oligos) were not angiogenic. Other studies confirmed this remarkable and unexpected discovery (West and Kumar 1989; Lees et al. 1995; Liu et al. 1996; Slevin et al. 2002), and RHAMM was identified as the likely HA receptor responding to these HA oligomers in primary human endothelial cells (Lokeshwar and Selzer 2000). These findings energized other investigators to examine possible HA size-dependent signaling in other systems (Turley et al. 2002) and a second active size range at about 200 kDa was then discovered for HA-stimulated signal transduction leading to gene expression changes in macrophages (Noble et al. 1996; McKee et al. 1997; Horton et al. 1999) or rat liver Kupffer and sinusoidal endothelial cells (Rockey et al. 1998). Although these latter four studies used commercial umbilical cord HA fragments with up to 2% human protein contaminants, McKee et al. (1996) showed that highly purified rooster comb HA was also active when sonicated to ~200 kDa, whereas intact MDa HA was inactive. This important control indicated that contaminating growth factors or hormones in the umbilical preparations were not responsible for the biologic responses. Interestingly, HA hexamers were also active (McKee et al. 1996), indicating that the active HA size range for signaling in macrophpages might be from 1.2 to 400 kDa, but this has not been verified and endotoxin contamination could also be an issue (Dong et al. 2016). Concerns have also been raised about studies with HA fragments because endotoxin is found everywhere in our environment (Di Luzio and Friedmann, 1973) and hyaluronidase-generated fragments are usually contaminated with endotoxin (Dong et al. 2016), unless special reagents are used (Huang et al. 2014).
Although no studies have shown direct binding of HA by TLR2 or TLR4, TLR2 is implicated as a necessary receptor for the HA-mediated responses to ~100–400 kDa HA (Scheibner et al. 2006). Cell signaling mediated by CD44 (McKee et al. 1996) and HARE (Pandey et al. 2013) also occur only with HA in the 200 kDa size range. HARE, which is created by proteolysis, not mRNA splicing, is the C-terminal half of full-length STAB2; both isoforms are independent HA receptors (Harris et al. 2007).
It is now clear that HA plays two major roles in vertebrate and mammalian physiology. The first function of HA, well known within a few decades after its purification and characterization by Meyer's group (Meyer and Palmer 1934; Weissmann and Meyer 1952), is its role as a large molecule (e.g., 4–10 MDa) structural component in the extracellular matrices of virtually all tissues (Toole 1990; Fraser et al. 1997; Hascall and Esko 2009). In mammals, HA is the largest biomolecule made without a template. Extensive studies, especially in specialized tissues (e.g., cartilage, synovial fluid and vitreous) with high concentrations of very large MDa HA, contributed to our understanding that the very large size of HA is an integral part of its ability to function physiologically and that if its >MDa size is compromised, its tissue functionality can be readily lost. It was thus surprising to follow the convincing documentation of the second HA function; that HA fragments, much smaller than the normal structural MDa HA, are able to stimulate cell signaling pathways leading to a range of response outcomes. In retrospect, it now makes physiologic sense that the appearance of abnormal smaller HA should activate cell signaling cascades that create secretory responses to resolve whatever tissue insult (e.g., injury or infection) caused the generation of small HA. For example, HARE/STAB2 in liver and lymph nodes may serve as a Tissue-Stress Sensor system (Weigel et al. 2012), systemically monitoring in blood and lymph fluid, respectively, the levels and patterns of circulating extracellular matrix breakdown products (e.g., HA, dermatan sulfate, chondroitin sulfate types A, C, D and E) from tissue matrices throughout the body;
Since the second type of HA receptor signaling often occurs only in a relatively narrow 100–400 kDa size range, the fundamental question has been: why or how is HA of this size different than the HA that is smaller or larger? Since virtually all HA above about 2–4 kDa (10–20 sugars) is able to bind any of these HA receptors, why is the consequence of stimulating signal transduction more than simply binding to HA and so dependent on a particular size range? Could the structure or conformation of signaling HA be somehow different than that of larger or smaller HA? In this study, we used size exclusion chromatography coupled to multiangle light scattering (SEC-MALS) to characterize and analyze very-narrow size range preparations made during Select-HA trial synthesis or production runs and ranging in mass from 29 to 1645 kDa. We observed a discontinuity in the relationship between HA molecular size (diameter) and weight-average molar mass (Mw) in the 200 kDa size range. Below this transition point, HA is more rod-like, whereas above this transition HA behaves more like a compact random coil. Thus, the signal-competent HA size range may have different conformational properties than larger nonsignaling HA allowing creation of unique receptor•HA complexes activated for signaling as monomers. Alternatively, HA conformational characteristics may not be important for signaling; transition-size HA may be intrinsically best suited for creating oligomeric receptor•HA•receptor complexes in which CDs interact to activate signaling.
Results
The complication of its polydispersity has made the biophysical characterization of HA difficult, especially in efforts to understand the hydrodynamic characteristics of an HA preparation for which there is no uniform molecular size. Three types of HA preparations with different molecular size ranges (broad or natural, narrow and very narrow), illustrated visually in Figure 1, have been used to study the size-dependent biology of HA. Naturally occurring HA, made by any HA synthase, is polydisperse with the lowest and highest masses present typically representing up to a 50-fold size range. For example, based on SEC-MALS analysis, we find that the 98% HA size range (encompassing 98% of all HA; excluding the smallest 1% and largest 1%) for commercial Lifecore 215 and 51 kDa HA made by Streptococcus pyogenes (Figure 1, lanes 1 and 2) is 21–431 kDa (20.5-fold) and 12–130 kDa (10.8-fold), respectively. Lifecore 154-, 309- and 621-kDa HA preparations had 98% size ranges of 42-, 47- and 39-fold, respectively (not shown). In contrast to these broader distributions of natural HA, HA preparations made chemo-enzymatically (e.g., commercial Select-HA) show very narrow size ranges (Jing and DeAngelis 2004); typically <2-fold. The 98% range for 30 kDa Select HA was 26–35 kDa (Figure 1 lane 3, bottom band), only a 1.3-fold size range and the larger 495 kDa Select HA 98% size range was 460–549 kDa (Figure 1 lane 3, top band), a 1.2-fold size range. Depending on the preparations being compared, the size ranges of natural HA are about 10–35 times broader than very-narrow size range Select-HA, which for some preparations approach mono-dispersity. We define the third type of HA preparations (Figure 1, lanes 4–8), which are not commercially available, as narrow-size range HA. These low endotoxin HA preparations, made by SEC fractionation of natural HA (Pandey et al. 2013), are much less polydisperse than natural HA and more similar to Select-HA; only 2–3 times broader. For example, the 98% HA size ranges of 13-, 28-, 51- and 87-kDa narrow range HA preparations (Figure 1) were 2.3-, 2.2-, 1.6- and 1.4-fold, respectively.
Fig. 1.
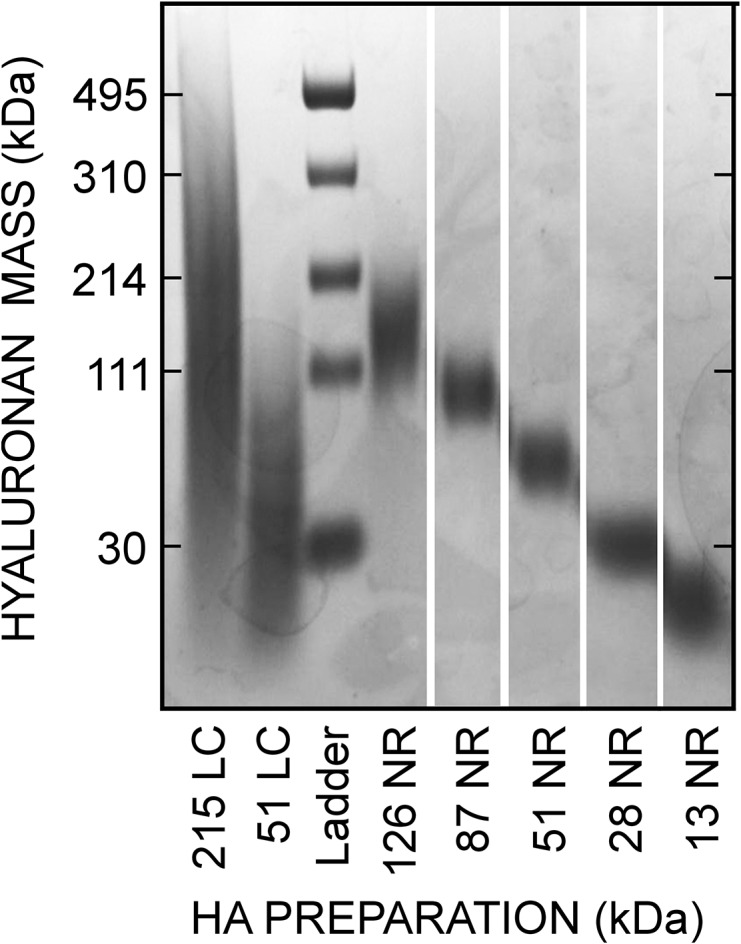
Mass range distributions of three different types of HA preparations. Samples of natural Lifecore (LC) HA, narrow-size range (NR) HA of the indicated Mw made in-house by SEC fractionation and a Hyalose Lo-Ladder with Select-HA mass markers (Ladder) of the indicated very-narrow size range were subjected to agarose gel electrophoresis and staining as described in Methods.
In this study, we examined samples of very-narrow size range HA by SEC-MALS to determine the relationship between the Mw of an HA cohort and its overall molecular volume, as indicated by its diameter (Figure 2). We present the hydrodynamic data as diameter rather than radius in order to reflect molecular size, since this is usually a more relevant concept in the context of cells, cell biology and cell signaling. The relationship between the Mw of HA and its diameter was linear (cc = 0.98) over a mass range from about 200 to 1645 kDa, the largest size examined (Figure 2A). However, data for HA samples <200 kDa were not fit well by the same linear regression line. For these samples, the relationship between the HA Mw and its diameter was also linear (cc = 0.75) over a mass range from about 30 to 150 kDa (Figure 2B), but the slope for this relationship [Δdiameter ÷ Δmass] was twice the value of the mass range above 200 kDa. Thus, HA with a Mw below about 200 kDa has a conformation that is much more like a rod compared to HA that is >200 kDa, which is more folded and compact. The diameter of this transition-size HA is roughly 65 nm. Figure 3 shows two examples of the type of SEC-MALS data obtained for the HA preparations in Figure 2B; the 30 and 527 kDa mass examples are less than and more than, respectively, the transition zone HA masses noted above.
Fig. 2.

SEC-MALS assessment of the relationship between weight-average molar mass and particle size for very-narrow size range HA. Samples of Select-HA and other very-narrow size range HA were analyzed by SEC-MALS as described in Methods to determine weight-average molar mass and particle diameter. Values below or above 200 kDa are white or black circles, respectively. (A) The full scale range of Mw values examined is shown with a linear regression line (r2 = 0.98) using all data ≥200 kDa. (B) The scale in A is expanded to highlight the region below ~500 kDa. The regression line for samples >200 kDa is the same as in panel A and a different regression line (r2 = 0.75) is shown for samples <200 kDa. The intersection of the two regression lines indicates that the midpoint of the transition in the relationship between HA size and mass occurs at about 200 kDa. The change in HA conformation from an extended rod-like structure to a more compact random coil likely occurs in stages over an extended mass range (e.g., 100–300 kDa) around this approximate midpoint.
Fig. 3.

SEC-MALS data for very-narrow size range HA samples. Individual SEC-MALS data are shown for 30 kDa (dashed line) and 527 kDa (solid line) HA samples in Figure 2, processed as described in Methods. After it is fractionated through the SEC resin, the eluate goes through the flow cells of a multiangle laser light scattering instrument and then a refractive index (RI, right scale) monitor, which continuously collect data from which the weight-average molar mass (left scale) of individual scattering molecules is calculated, shown for the larger (circles) and smaller (triangles) HA samples; each symbol represents the mean of data values collected over a 1 s interval (every eighth value is shown). The RI values (solid and dashed lines) indicate the HA concentration in the continuously monitored eluate. The lines through each set of symbols were calculated by linear regression and are essentially parallel with the X-axis, demonstrating that the masses of molecules at the leading and trailing edges of the elution peak are virtually identical for these two very-narrow size range HA preparations. For normal biological HA samples, made by any HA synthase, the masses eluting first (left side) are many-fold greater than the smaller HA masses eluting at the tail end (right side); a linear regression fit for these corresponding molar mass values is typically sloped down (\) at a significant angle (e.g., 30–45 degrees) and the elution peak shape is not symmetric (Baggenstoss and Weigel 2006).
Discussion
The HA rod-to-coil transition
Several studies have concluded that as its mass decreases, HA undergoes a change from a random coil to a rod-like conformation. La Gatta et al. (2010) studied natural HA digested to different extents by testicular hyaluronidase and concluded, based on Mark-Houwink plots, that 1.4 MDa HA behaves as a random coil and 10 kDa HA behaves as a rigid rod. The mass at which the rod-to-coil transition occurred was not evident because of the broad HA-size distributions in hyaluronidase digests. Using nine HA samples with Mw values ranging from 90 to 3500 kDa, Mendichi et al. (2003) found a curvilinear Mark–Houwink plot, also indicating a transition from a more compact random coil to an extended rod-like conformation as Mw decreases. Interestingly, since Mark–Houwink plots of linear polymers are usually linear over an extended mass range, whereas curved plots can indicate a branched structure, Podzimek et al. (2010) concluded that HA is a branched polymer. Since HA is not branched, an alternative possibility is that the relationship between mass and size for HA is not uniform across all masses; in particular HA that is less than 200–400 kDa may not behave as the more ideal polymer that MDa HA might be. Bhilocha et al. (2011) found a linear relationship for the migration of HA in 0.5% agarose gels between 200 kDa and 8 MDa, whereas HA < 200 kDa showed an improved separation; migration distance was more dependent on mass. Specific results were dependent on solution factors such as buffer and ionic strength. However, it is also possible that these migration differences during agarose gel electrophoresis reflect a similar conformational transition to what we observed here for HA above and below about 200 kDa (65 nm diameter); HA that is <200 kDa is more elongated and rod-like and HA that is >200 kDa is more compact and folded, like a random coil. Although this latter conclusion may need further study to confirm, it is consistent with the literature and the novel data presented in Figure 2.
Signaling receptors use different mechanisms to bind HA and some may not bind HA directly
CD44, LYVE-1 and HARE/STAB2 are HA-binding proteins by virtue of containing a conserved ~93 aa HA-binding Link domain, also designated the HA-Binding Module. If the Link domain is deleted or mutated, then HA binding and associated signaling do not occur. HA binding to CD44 and subsequent signaling are also modified or abrogated by alterations of CD44 glycans (Turley et al. 2002). Deletion of an N-glycan in the HARE Link domain eliminates HA signaling, but not HA binding and endocytosis, yet has no effect on HARE-mediated signaling upon binding three other ligands (Pandey and Weigel 2014). RHAMM lacks a Link domain but binds HA via two B-X7-B motifs, where B is a positively charged Lys or Arg and X is any amino acid except Asp and Glu (Yang et al. 1993). Layilin, apparently named after an internal LAYILI238 sequence, has no Link domain (Bono et al. 2001) but has two noncanonical B-X7-B motifs that should not bind HA because they contain acidic (negative charge) residues that preclude binding (Yang et al. 1994). Despite lacking the two known protein domains that bind to HA, human Layilin specifically binds HA, but not other glycosaminoglycans (Bono et al. 2001). Thus, the ability of Layilin to bind HA is by an as yet unknown mechanism.
Five of the six characterized receptors responsive to binding HA (CD44, HARE/Stab2, LYVE-1, Layilin and RHAMM) have been shown to bind HA directly and to signal as a result of directly binding HA. In contrast, no studies have reported that either the TLR2 or TLR4 proteins bind HA. Human TLR2 and TLR4 do not have a Link domain but they each have two B-X7-B motifs that do not have acidic residues, although one motif in TLR4 contains Pro, which could prevent alignment of HA carboxyl negative charges with positive charges of the B-X7-B motif. The human TLR4 motif KRLTFTSNK36 and the two TLR2 motifs KYLNLSSTR447 and RNAITTFSK525 potentially meet the criteria for HA binding (Yang et al. 1994), but this possibility has not been reported in previous studies. However, using a sensitive assay the Cowman group recently found that HA fragments of approximately 50 kDa did not bind to human TLR2 or TLR4, whereas four other HA-binding proteins were active [Mary Cowman, personal communication (unpublished data)]. If TLR2/4 do not bind HA directly, they might interact with an accessory protein that does bind and is required for the downstream signaling attributed to TLR2/4.
Note that studies in which B-X7-B sequences are incorporated into recombinant peptides and shown to bind HA cannot be interpreted to mean that these same motifs within the native protein are able to bind HA. A B-X7-B motif in a native protein might not mediate HA binding to the protein for multiple reasons (e.g., inaccessibility or steric hindrance). Mutations of a motif in the native protein must be shown to abrogate HA binding to confirm its likely involvement in this function. The Class I HA synthase family, for example, has two conserved tandem B-X7-B sequences that are involved in the independent control of HA synthesis rate and HA product size, yet HAS enzymes are not, and cannot be, HA-binding proteins (Baggenstoss et al. 2017).
HA size dependence for receptor-mediated cell signaling
There are several types or classes of cell signaling response systems with the ability to detect and respond to different ranges of smaller-size HA. The first receptor response type identified stimulated angiogenesis in response to HA oligos from 8 to 50 sugars (West et al. 1985). Recent studies have shown that even tetrasaccharides, the smallest HA structural units, appear to stimulate cell signaling (Xu et al. 2002) and prevent neural damage (Torigoe et al. 2011), although the detecting and responding receptor(s) have not yet been identified. Surprisingly, therefore, some vertebrate cells can bind and respond to very small HA, despite the expected poor binding constants for such small molecule-protein interactions. Low or no detectable binding to HA receptors, for which it has been determined (e.g., CD44, LYVE-1 and HARE/STAB2), occurs with molecules <6–8 sugars long (Lesley et al. 2000; Banerji et al. 2010; Pandey et al. 2013). A second type of HA receptor response activates cellular signal transduction pathways in response to binding HA that is larger than the <10 kDa size to which the first receptor type responds but much smaller than the typical 4–10 MDa size associated with extracellular matrices. A consensus active HA size range for these signaling-competent receptor responses, observed in many different studies using different cell types, assays and HA preparations is 100–400 kDa (Turley et al. 2002; Stern et al. 2006).
Technically, all HA receptors show a size dependence for binding HA. For example, LYVE-1 requires an HA length ≥22 sugars for maximal interaction, based on competition assays with MDa HA (Banerji et al. 2010) and in assays with end-labeled [3H]GlcUA HA fragments, HARE binds with increasing affinity to oligos that are 10–20 sugars long (Pandey et al. 2013). Other HA-binding receptors likely bind to all size ranges of HA above a similar length threshold. Some signaling HA receptors have also shown HA size-dependent activation of their cell signal cascades. Small HA found in vivo is usually assumed to arise by hyaluroidase breakdown of MDa HA, but it could also be made directly by HA synthases that are able to make smaller HA normally, such as HAS3 (Brinck and Heldin 1999; Itano et al. 1999), or that are regulated to decrease their HA product size (Baggenstoss et al. 2017). Depending on the cell type, CD44 can be activated to signal by binding small HA oligos (Iacob and Knudson 2006) or 200 kDa HA (Fitzgerald et al. 2000) but not MDa HA. HA oligos can stimulate signaling indirectly by disrupting normal CD44-HA complexes between some cells and HA in the external matrix (or cell surface), as noted in the below section contrasting large and small HA.
HARE activates ERK1/2 and NFκB signaling during endocytosis of 40–400 kDa, but not smaller or larger HA (Pandey et al. 2013). To date, this latter study is the most detailed characterization of an HA size dependence for cell signaling by an HA receptor, and it also showed inhibition of cell signaling by nonsignaling HA. Layilin is an HA-binding signaling receptor (Bono et al. 2001, 2005; Asano et al. 2014), but a dependence on HA size has not been reported. LYVE-1 avidity for HA (i.e., its functional affinity) depends on its ability to homo-dimerize, form surface microclusters and create a network of cross-linked receptor-HA complexes (Banerji et al. 2016; Lawrance et al. 2016). Binding of HA to LYVE-1 in primary lymphatic endothelium promotes junctional remodeling, but occurs with different kinetics and downstream signaling outcomes in response to HA ≤ 20 kDa or HA ≥135 kDa; however, MDa HA was not assessed for its ability to activate LYVE-1 signaling [David Jackson, personal communication (unpublished data)].
There are no reports that TLR2/4 bind HA directly, and at least one study found they do not [Mary Cowman, personal communication (unpublished data)]. Despite lack of evidence for TLR2/4 binding to HA, many studies support their role in cellular responses to HA (McKee et al. 1996; Noble et al. 1996; Horton et al. 1999; Jiang et al. 2006, 2011). Thus, TLR2 and TLR4 respond to 100–400 kDa HA, to 35 kDa HA and also to an HA hexamer but not to MDa HA. RHAMM-mediated signaling can be activated by HA oligos (Gao et al. 2008) or MDa (Hall et al. 1994; Goueffic et al. 2006) HA, depending on the cell type. We have found no systematic studies of the HA size ranges that activate RHAMM, and perhaps this HA receptor does not distinguish among various HA sizes for its ability to signal.
HA preparations used to study size-dependent responses
Very few studies have accurately defined the active HA size range in their system by testing either very-narrow size range HA preparations obtained commercially or narrow-size range HA preparations made in-house. Although it is tedious and time-consuming to prepare low endotoxin narrow-size range HA, very useful preparations (Figure 1) can be obtained by SEC fractionation , in which 2–3 elution fractions at a consistent mass are pooled from multiple SEC runs. Hyalose previously sold a range of Select-HA products of very narrow size range and also provided these as Lo-, Hi- and Mega-Ladders for use as HA mass markers (Jing and DeAngelis 2004; Jing et al. 2006), which cover a very broad size range (e.g., from ~25 kDa to 8 MDa), to help researchers calibrate the size of HA used or made in their system (e.g., Bourguignon et al. 2004; Casalino-Matsuda et al. 2006; Garantziotis et al. 2009). These novel HA mass markers, made chemo-enzymatically, have very low polydispersity compared to natural HA made by fermentation (Figure 1). Although Hyalose no longer makes HA, some inventory is still available including Select-HA (50, 150, 500 and 1000 kDa) and Lo and Hi-Ladder markers. When this inventory is sold-out, very narrow size range HA products will no longer be available.
HA conformation, valency and receptor signaling
Many studies using different techniques find that HA can have many types of secondary, tertiary and quaternary structure; some of which might influence the nature and outcome of interactions with receptors. HA has natural secondary structure as a left-handed helix, due to its alternating β(1,4) and β(1,3) linkages. NMR studies by Atkins et al. (1980) found that four intra-chain H-bonds per disaccharide unit stabilize this left-handed helical conformation, as occurs in a similar way for protein α-helices. Using X-ray diffraction, Mitra et al. (1983) found HA in left-handed helices with a 0.95 nm rise per disaccharide stabilized by intramolecular H-bonds. A stabilized left-handed helix structure would stiffen shorter HA, making it even more rod-like. Solid phase NMR and electron microscopy data indicate that HA tertiary structure can be sheets or tubules, which are modeled well by parallel, anti-parallel and stacked HA chains (Mikelsaar and Scott 1994). Atomic force microscopy shows that the same HA chain can interact with itself, probably in several ways (Cowman et al. 1998). Based on modeling of NMR data, the local structure for HA4-8 oligos is a compact left-handed 4-fold helix (Almond et al. 2006).
An important concept for understanding HA-protein interactions relates to the multi-valency of HA, first documented by Laurent et al. (1986) in a landmark paper. They examined the binding of defined HA oligos and two MDa HAs to rat liver sinusoidal endothelial cells (expressing HARE/Stab2), and found that Kd values varied from 4.6 × 10⁻⁶ M for HA8 to 9 × 10⁻¹² M for 6.4 MDa. Each cell bound 105 oligos but only 103 molecules of 6.4 MDa HA. This effect was explained by the increased probability that much larger HA binds to multiple receptors and to the same receptor for a longer net time (i.e., koff decreases and kon increases), due to the repetitive binding sequence along the HA chain. The multi-valent nature of binding sites along an HA molecule effectively increases the ligand concentration and increases receptor occupancy time with bound ligand. More recently, this super-selectivity concept was elegantly shown for HA interactions with CD44 (Dubacheva et al. 2015) and highly sensitive nano-techniques are enabling the examination of single CD44 interactions with HA (Bano et al. 2016).
A common question is whether nonsignaling HA blocks or inhibits signaling HA. Few studies have examined this, but the answer should be yes, since receptors that can bind HA can do so whether the HA is or is not signaling competent. The HA-binding activity of CD44 (Kincade et al. 1997) and HARE (Pandey and Weigel 2014) can be regulated by glycosylation of the Link domain but if they are capable of binding any HA, they can bind to all HA sizes above the oligomer threshold length for stable occupancy of the binding site. It is the signaling outcome that appears to vary in response to the size of HA bound. Thus, any bound nonsignaling HA should be a competitive inhibitor of signaling HA. This is the case for HARE, which only signals with 40–400 kDa HA, but binds and endocytoses HA of all sizes, and as the content of signaling HA within any HA sample decreases, so does signaling (Pandey et al. 2013).
Two mechanisms can explain differential receptor signaling by binding different size HA: cytoplasmic domain conformational changes are either transmembrane-mediated or induced by physical clustering into oligomers
Many receptor cytoplasmic domains (CDs) are already phosphorylated and complexed with one or more signaling proteins prior to their activation by HA. Intracellular signaling occurs in response to external ligands when a receptor CD undergoes conformational changes that enable new interactions with signaling proteins to be initiated or activated. New CD binding interactions can be due: (i) to a new conformation in an individual CD, (ii) to new conformations created by complex formation between two or more CDs or (iii) in the absence of conformational changes, new [CD]n complexes create new binding interfaces recognized by signaling factors. Figure 4 illustrates some of the possibilities for three different hypothetical HA receptors (HAR; Figures 4A–J) as they interact with various combinations of oligo, transition-size 200 kDa or native MDa HA. HAR-1 and HAR-2 (Figure 4A–G) are involved in regulating “response-to-disruption” signaling pathways (dark green arrows and CDs); disruption means that normal MDa HA in the environment is altered, as detected by either its displacement from a HAR or by the presence of smaller HA generated by its degradation.
Fig. 4.

Schemes for signaling control by receptor binding to three different HA sizes. The extracellular (vertical ovals) and transmembrane (yellow) domains of imaginary HA receptors 1–3 (HAR-1, tan; HAR-2, gray; HAR-3, purple) are connected across the membrane (black) to signaling-active (light or dark green) or-inactive (red) CDs (small ovals); signal transduction pathways are active (green arrows) or inactive (green arrows with X). Two signaling pathways are shown: a “response-to-disruption” pathway (dark green, top) senses smaller HA that indicates degradation or loss of normal MDa HA; a “stable-external-contact” pathway (light green, bottom) establishes and senses normal interfaces between cell surface and external HA. Free HA (blue) near a HAR indicates excess HA is present. (A) HAR-1 and HAR-2 (middle row) are normally not bound to HA; they are quiescent, not signaling. (B) Both receptors bind to oligo HA (e.g., 10 kDa, small blue lines) for a fraction of the time (i.e., low affinity, high Kd values); HAR-1•HA, but not HAR-2•HA, initiates signaling if binding creates external conformational changes that also alter the internal CD to activate signaling. (C) The equilibrium wheel (A,C,D) shows that transition-size HA (200 kDa; multiple blue-line shapes) is neither solely a rod nor a coil because both conformations are energetically equivalent (Keq for these conformational reactions is ~1). The same HA chain can spend time as a rod, a coil or an intermediate with different intramolecular sections showing both characteristics. Excess transition-size HA binds stably (i.e., high affinity, low Kd values) so all HAR-1•HA and HAR-2•HA complexes are monomeric. HAR-1•HA signals if external conformational changes with this size HA creates CD changes needed to activate signaling. In contrast, monomeric HAR-2•HA cannot activate signaling. (D) Two HAR-2 proteins can physically bind to the same 200 kDa HA, in a self -titrating manner as noted in Discussion, to create tri- or oligomeric HAR-2•HA•HAR-2 complexes. In close proximity, the two CDs bind and undergo conformational changes that activate signaling (indicated by altered CD positioning). The same proximity of HAR-1 CDs occurs with 200 kD HA but may not activate signaling. (E) If limiting MDa HA (large blue-line ball) is presented to unbound (A) or occupied receptors (D), it binds, or displaces smaller HA, respectively, creating trimeric HAR•HA•HAR complexes in which receptor CDs are not spatially close and do not interact. HAR-2•HA•HAR-2 is inactive since the CDs do not interact. HAR-1•HA•HAR-1 could still be active, if the bound HA supports conformational changes needed for transmembrane-CD activation and signaling. (F) Trimeric HAR•HA•HAR with 200 kDa HA (D, dashed arrow) or MDa HA (E) can be disrupted by excess oligo HA to generate monomeric receptor complexes (F) that can be signaling competent or incompetent. (G) Excess MDa HA could displace oligo HA (F) or 200 kDa HA (D) or bind to free HAR (A) to generate monomeric HAR•HA complexes that are typically not activated to signal, at least in the “response-to-disruption” sensing pathways that respond to nonMDa HA. (H) MDa HA does not activate “response-to-disruption” signaling because it is normally in the environment of tissue cells; rather HAR-3 is always bound to MDa HA and activated in “stable-external-contact” signaling pathways. Degradation of bound MDa HA or its displacement by oligo (I) or 200 kDa HA (J) inactivates these latter pathways and may or may not activate “response-to-disruption” signaling. Additional details are in the text. HAR-2 signaling behavior upon binding oligo, transition-size or MDa HA (B, D or E) is similar to that of HARE (Pandey et al. 2013).
Model (i) represents transmembrane-mediated activation of an internal CD by the external HA-binding event; a new ectodomain•HA conformation alters the transmembrane domain, which in turn alters receptor CD conformation to activate signal transduction. An example is HAR-1 (tan ovals, Figure 4A), shown being activated by binding oligo HA (Figure 4B), 200 kDa HA (Figure 4C) or MDa HA (Figures 4E and G). In contrast, models (ii) and (iii) are physical-spatial mechanisms that achieve internal CD activation, due to transition-size HA (150–250 kDa) binding, without a required external transmembrane-mediated conformational change. Spatial-physical mechanisms would be highly dependent on HA mass, because a bound HA only has the potential to oligomerize HAR-2 (gray ovals, Figure 4A) in close enough proximity if it is small enough to allow the CDs to interact (Figure 4D) and this provides the conformational driver for initiation of new interactions leading to signaling (Pandey et al. 2013). If the HA size is too small, then multiple receptors cannot be engaged (Figures 4B and F) and if the size is too large, the engaged receptors are too far apart to enable CD interactions (Figure 4E). These models also predict that such bridging HA effects will occur at an optimal HA concentration and be inhibited at higher concentrations of the same HA, as individual receptor•HA complexes replace signal competent receptor•HA•receptor complexes (Figure 4C). Similarly, nonsignaling HA can displace and stop signaling by bridging transition-size HA, which is ~65 nm in diameter (Figure 4F and G). Also, as HA size increases other HAR interactions with the huge bound HA chain (independent of the actual HA-binding site) might occur that hinder or alter the conformation change needed for activation. Therefore, MDa HA might intrinsically be less likely to activate signaling by receptors designed to respond to a particular smaller HA size range, especially if the activation mechanism is transmembrane-mediation of an ectodomain conformation change.
In contrast to HAR-1 and HAR-2 being involved in regulating “response-to-disruption” pathways, HAR-3 regulates “stable-external-contact” signaling pathways (Figure 4H–J, light green arrows and CDs); HAR-3 is normally bound with MDa HA as part of its function to convey information about the external environment and the “response-to-disruption” pathways would be inactive. Competing MDa HA that displaced endogenous bound MDa HA from HAR-3 would likely not activate a new response, whereas oligo (Figure 4I) or 200 kDa HA (Figure 4J) could displace MDa HA with abnormal (smaller) HA resulting in repression of “stable-external-contact” signaling and activation of “response-to-disruption” signaling.
We propose that the malleability of ~65 nm diameter HA in this transition-size range is central to its signaling functionality. A key concept is that transition-size HA is neither like a rod nor a coil because Keq for this conformational reaction is ~1; both conformations are energetically equivalent, so that the same HA chain can spend time as a rod, a coil or an intermediate with different intramolecular sections showing both characteristics (Figure 4A, C and D, equilibrium wheel). This conformational flexibility of transition-size HA chains means that two (or more) receptors bound to the same molecule can come together physically close enough to allow the CDs to bind each other, without a significant energy barrier to overcome, by altering the conformation of HA to make it more compact (less rod-like); each receptor can bind to a rod-like region of the HA and the intervening HA could flex between rod and coil, until the new protein-protein binding events occurred with high probability (i.e., high affinity). Thus, weak or nonexistent receptor-receptor CD interactions in the absence of HA would become stronger or be created as more energetically favorable in the presence of bound transition-size HA that could self-titrate the HA-binding sites along the chain and the conformation of the intervening HA to enable formation of stable receptor•HA•receptor complexes.
Why does large MDa HA not activate signaling in the same way as smaller HA?
Current information about HA size ranges that are competent to initiate signaling by receptor•HA complexes is confusing. Some receptors are activated by binding small rod-like HA (e.g., <20 kDa), whereas other receptors not activated by such small HA are activated by larger (e.g., 200 kDa) HA, but are not activated by MDa HA. The following considerations may explain why MDa does not initiate the same signaling observed with smaller HA.
(i) Interactions with MDa HA reflect a normal status quo. It makes biologic sense that MDa HA should not be capable of initiating signaling in the same manner as smaller HA, since the normal mass of HA in the tissue environment of cells is very large (MDa), not small. Important cellular processes are always controlled in multiple ways, so cells must have multiple pathways for an ongoing response to, and regulation of, their stable-external interactions, such as those mediated via cell surface receptors bound to external tissue MDa HA. The signaling feedback that monitors and responds to the status of such long-term interactions would be in a steady-state and would sense when the receptor•HA complexes are disrupted. These are “stable-external-contact” pathways responsible for establishing and maintaining these normal ongoing receptor-HA interactions. As part of their function, they are likely designed to respond to disruption of receptor•HA complexes, due to degradation of bound HA or its displacement with smaller HA (Figure 4H–J, light green arrows and CDs) by trying to reestablish the status quo by making more receptor or targeting more receptor to the cell surface.
(ii) Receptor interactions with smaller HA can disrupt the status quo. In contrast to the “stable-external-contact” pathways, some of the HA signaling pathways discovered over the last few decades are “response-to-disruption” signaling pathways designed to sense and respond to receptor binding with abnormal HA not usually in the environment (i.e., much smaller than MDa). These danger-sensing pathways are intrinsically different than the “stable-external-contact” pathways. The signaling pathways, transcription factors activated and gene expression changes are also likely very different, since their purposes differ. For example, gene expression patterns for cellular “stable-external-contact” pathways involving MDa HA necessarily include mostly proteins and processes within the cell or in near proximity, whereas a hallmark of cellular “response-to-disruption” pathways is a gene expression pattern with secreted protein couriers (e.g., cytokines) that convey distress warnings to distant cells and tissues.
It is also clear that the ability of small HA oligos to stimulate signaling may not always be by a direct mechanism, but rather be by disrupting receptor•HA complexes via displacement of larger sentinel HA, which when bound blocks “response-to-disruption” signaling (Figure 4H–J). HA receptors, such as CD44 in some cell types (e.g., chondrocytes), may be normally engaged with MDa HA and their steady-state situation is little or no signal activation; they become activated when the bound large HA is degraded or displaced by smaller HA or oligos. In contrast, HARE is a coated pit mediated constitutively recycling receptor that binds, endocytoses and releases its ligand for lysosomal degradation before it returns to the cell surface. The HAR-2 signaling behavior shown for binding to oligo, transition-size or MDa HA (Figs. 4B, D or E) similarly occurs for HARE, which does not signal after binding oligo or MDa HA but does signal when bound to transition-size HA (Pandey et al. 2013).
Summary
The results presented here indicate that the mass midpoint for an HA rod-to-coil conformational change is ~150–250 kDa (65 nm diameter), although the change between extended rod and a more globular random coil likely occurs over a broader HA mass range (e.g., 100–300 kDa). In this case, HA of >300 kDa mass might have essentially the same conformation as MDa. It remains to be determined if the novel signaling characteristics of HA receptors that bind 100–300 kDa HA are because: (i) the receptor•HA complex achieves conformational features that allow transmembrane activation of CD-mediated signaling that does not occur with binding to larger HA or smaller HA, or (ii) the size of HA in this transition region uniquely enables two or more receptors to bind the same HA molecule and bring their CDs into close proximity to create new conformations or binding interfaces that then bind and/or activate signaling components. It seems likely that the latter scenario in which a specific HA size range drives signal-competent oligomerization (Figure 4) is a more satisfactory explanation, since we know that any size HA molecule (>20 sugars) is bound well by any HA receptor. It is unlikely that a particular size range of HA has a unique stable conformation different from those found in other size ranges (even if transitory). In any case, there is no reason to believe that future discoveries related to the mechanisms and features that confer HA receptor-mediated cell signaling competence will be any less exciting than the discoveries brought forth over the last three decades.
Materials and methods
Hyaluronan samples
Samples representing small-scale trials, individual Select-HA products and Select-HA preparations to be incorporated as standards for Lo-Ladders or Hi-Ladder products were made and provided by Dr. Wei Jing of Hyalose. Agarose gel electrophoretic analysis of HA samples was performed as described by Cowman et al. (2011) and Weigel et al. (2013).
SEC-MALS analyses to determine HA weight-average molar mass and radius
Samples were chromatographed at 22°C using one or two (in series) PLaquagel-OH60, PLaquagel-OH40 or PLaquagel-OH30 columns (Polymer Labs), depending on the size range being analyzed. Elution buffer (50 mM sodium phosphate, pH 7.0, 150 mM NaCl, 0.05% sodium azide) was pumped at a flow rate of 0.4–0.5 mL/min and sample MALS analyses were continuously performed on the column eluate, as it first passed through a DAWN DSP Laser Photometer and then a OPTILAB DSP Interferometric Refractometer (Wyatt Technologies, Inc., Santa Barbara, CA). Mw and radius values were calculated, using Astra v4.73, a dn/dc value of 0.153, an A2 value of 0.0023, and either first order Zimm or second order Berry fits. In our experience analyzing data for HA <2 MDa, first-order Zimm fits have less uncertainty than second order Berry fits. As described in detail by Baggenstoss et al. (2006, 2017), injected samples were ≤0.05 mg/mL HA to minimize any concentration-dependent artifacts. Column performance was monitored regularly using an HA reference standard.
Acknowledgement
We thank Dr. Wei Jing for providing the samples used in this study.
Authors’ contributions
P.H.W. conceived, planned and secured funding for the project. B.A.B. performed all experiments and data analyses, and helped interpret data. Both authors created the figures. P.H.W. wrote the manuscript and both authors edited and approved the final version.
Funding
This research was supported in part by National Institutes of Health grants GM035978 and GM069961 and by the Ed Miller Chair in Molecular Biology.
Conflict of interest statement
None declared.
Abbreviations
CD, cytoplasmic domain; HA, hyaluronic acid or hyaluronate or hyaluronan; HAR, hyaluronan receptor; Mw, weight-average molar mass; oligo, oligomer or oligosaccharide; SEC-MALS, size exclusion chromatography-multiangle light scattering.
References
- Almond A, DeAngelis PL, Blundell CD. 2006. Hyaluronan: The local solution conformation determined by NMR and computer modeling is close to a contracted left-handed 4-fold helix. J Mol Biol. 358:1256–1269. [DOI] [PubMed] [Google Scholar]
- Asano K, Arito M, Kurokawa MS, Omoteyama K, Okamoto K, Suematsu N, Yudoh K, Nakamura H, Beppu M, Kato T. 2014. Secretion of inflammatory factors from chondrocytes by layilin signaling. Biochem Biophys Res Commun. 452:85–90. [DOI] [PubMed] [Google Scholar]
- Atkins EDT, Meader D, Scott JE. 1980. Model of hyaluronic acid incorporating four intra-molecular hydrogen-bonds. Int J Biol Macromol. 2:318–319. [Google Scholar]
- Baggenstoss BA, Weigel PH. 2006. Size exclusion chromatography–multiangle laser light scattering analysis of hyaluronan size distributions made by membrane-bound hyaluronan synthase. Anal Biochem. 352:243–251. [DOI] [PMC free article] [PubMed] [Google Scholar]
- Baggenstoss BA, Harris EN, Washburn JL, Medina AP, Nguyen L, Weigel PH. 2017. Hyaluronan synthase control of synthesis rate and hyaluronan product size are independent functions differentially affected by mutations in a conserved tandem B-X7-B motif. Glycobiology. 27:154–164. [DOI] [PMC free article] [PubMed] [Google Scholar]
- Banerji S, Hide BR, James JR, Noble ME, Jackson DG. 2010. Distinctive properties of the hyaluronan-binding domain in the lymphatic endothelial receptor Lyve-1 and their implications for receptor function. J Biol Chem. 285:10724–10735, doi:10.1074/jbc.M109.047647. [DOI] [PMC free article] [PubMed] [Google Scholar]
- Banerji S, Lawrance W, Metcalfe C, Briggs DC, Yamauchi A, Dushek O, Van Der Merwe PA, Day AJ, Jackson DG. 2016. Homodimerization of the lymph vessel endothelial receptor Lyve-1 through a redox-labile disulfide is critical for hyaluronan-binding in lymphatic endothelium. J Biol Chem. 291:25004–25018. [DOI] [PMC free article] [PubMed] [Google Scholar]
- Banerji S, Wright AJ, Noble M, Mahoney DJ, Campbell ID, Day AJ, Jackson DG. 2007. Structures of the CD44-hyaluronan complex provide insight into a fundamental carbohydrate-protein interaction. Nat Struct Mol Biol. 14:234–239. [DOI] [PubMed] [Google Scholar]
- Bano F, Banerji S, Howarth M, Jackson DG, Richter RP. 2016. A single molecule assay to probe monovalent and multivalent bonds between hyaluronan and its key leukocyte receptor CD44 under force. Sci Rep.. 6:34176, doi:10.1038/srep34176. [DOI] [PMC free article] [PubMed] [Google Scholar]
- Bhilocha S, Amin R, Pandya M, Yuan H, Tank M, LoBello J, Shytunhina A, Wang W, Wisniewski H-G, de la Motte C, et al. . 2011. Agarose and polyacrylamide gel electrophoresis methods for molecular mass analysis of 5- to 500-kDa hyaluronan. Anal Biochem. 417:41–49. [DOI] [PMC free article] [PubMed] [Google Scholar]
- Bono P, Cordero E, Johnson K, Borowsky M, Ramesh V, Jacks T, Hynes RO. 2005. Layilin, a cell surface hyaluronan receptor interacts with merlin and radixin. Exp Cell Res. 308:177–187. [DOI] [PubMed] [Google Scholar]
- Bono P, Rubin K, Higgins JM, Hynes RO. 2001. Layilin, a novel integral membrane protein, is a hyaluronan receptor. Mol Biol Cell. 12:891–900. [DOI] [PMC free article] [PubMed] [Google Scholar]
- Bourguignon LYW, Singleton PA, Diedrich F, Stern R, Gilad E. 2004. CD44 interaction with Na-H Exchanger (NHE1) creates acidic microenvironments leading to hyaluronidase-2 and cathepsin B activation and breast tumor cell invasion. J Biol Chem. 279:26991–27007. [DOI] [PubMed] [Google Scholar]
- Brinck J, Heldin P. 1999. Expression of recombinant hyaluronan synthase (HAS) isoforms in CHO cells reduces cell migration and cell surface CD44. Exp Cell Res. 252:342–351. [DOI] [PubMed] [Google Scholar]
- Casalino-Matsuda SM, Monzo´n ME, Forteza RM. 2006. Epidermal growth factor receptor activation by epidermal growth factor mediates oxidant-induced goblet cell metaplasia in human airway epithelium. Am J Respir Cell Mol Biol. 34:581–591. [DOI] [PMC free article] [PubMed] [Google Scholar]
- Chang PS, McLane LT, Fogg R, Scrimgeour J, Temenoff JS, Granqvist A, Curtis JE. 2016. Cell surface access is modulated by tethered bottlebrush proteoglycans. Biophys J. 110:2739–2750. [DOI] [PMC free article] [PubMed] [Google Scholar]
- Cowman MK, Chen CC, Pandya M, Yuan H, Ramkishun D, LoBello J, Bhilocha S, Russell-Puleri S, Skendaj E, Mijovic J, et al. . 2011. Improved agarose gel electrophoresis method and molecular mass calculation for high molecular mass hyaluronan. Anal Biochem. 415:50–56. [DOI] [PubMed] [Google Scholar]
- Cowman MK, Li M, Balazs EA. 1998. Tapping mode atomic force microscopy of hyaluronan: Extended and intramolecularly interacting chains. Biophys J. 75:2030–2037. [DOI] [PMC free article] [PubMed] [Google Scholar]
- Dong Y, Arif A, Olsson M, Cali V, Hardman B, Dosanjh M, Lauer M, Midura RJ, Hascall VC, Brown KL, et al. . 2016. Endotoxin free hyaluronan and hyaluronan fragments do not stimulate TNF-α, interleukin-12 or upregulate co-stimulatory molecules in dendritic cells or macrophages. Sci Rep. 6:36928, doi:10.1038/srep36928. [DOI] [PMC free article] [PubMed] [Google Scholar]
- Di Luzio NR, Friedmann TJ. 1973. Letter: Bacterial endotoxins in the environment. Nature. 244:49–51. [DOI] [PubMed] [Google Scholar]
- Dubacheva GV, Curk T, Auzély-Velty R, Frenkel D, Richter RP. 2015. Designing multivalent probes for tunable superselective targeting. Proc Natl Acad Sci USA. 112:5579–5584. [DOI] [PMC free article] [PubMed] [Google Scholar]
- Fitzgerald KA, Bowie AG, Skeffington BS, O'Neill LA. 2000. Ras, protein kinase C zeta, and I kappa B kinases 1 and 2 are downstream effectors of CD44 during the activation of NF-kappa B by hyaluronic acid fragments in T-24 carcinoma cells. J Immunol. 164:2053–2063. [DOI] [PubMed] [Google Scholar]
- Fraser JR, Laurent TC, Laurent UB. 1997. Hyaluronan: Its nature, distribution, functions and turnover. J Intern Med. 242:27–33. [DOI] [PubMed] [Google Scholar]
- Gao F, Yang CX, Mo W, Liu YW, He YQ. 2008. Hyaluronan oligosaccharides are potential stimulators to angiogenesis via RHAMM mediated signal pathway in wound healing. Clin Invest Med. 31:E106–E116. [DOI] [PubMed] [Google Scholar]
- Garantziotis S, Li Z, Potts EN, Kimata K, Zhuo L, Morgan DL, Savani RC, Noble PW, Foster WM, Schwartz DA, et al. . 2009. Hyaluronan mediates ozone-induced airway hyperresponsiveness in mice. J Biol Chem. 284:11309–11317. [DOI] [PMC free article] [PubMed] [Google Scholar] [Research Misconduct Found]
- Goueffic Y, Guilluy C, Guerin P, Patra P, Pacaud P, Loirand G. 2006. Hyaluronan induces vascular smooth muscle cell migration through RHAMM-mediated PI3K-dependent Rac activation. Cardiovas. Res. 72:339–348. [DOI] [PubMed] [Google Scholar]
- Hall CL, Wang C, Lange LA, Turley EA. 1994. Hyaluronan and the hyaluronan receptor RHAMM promote focal adhesion turnover and transient tyrosine kinase activity. J Cell Biol. 126:575–588. [DOI] [PMC free article] [PubMed] [Google Scholar]
- Harris EN, Kiosseva SV, Weigel JA, Weigel PH. 2007. Expression, processing and glycosaminoglycan binding activity of the recombinant human 315-kDa Hyaluronic Acid Receptor for Endoyctosis (HARE). J Biol Chem. 282:2785–2797. [DOI] [PubMed] [Google Scholar]
- Hascall V, Esko JD. 2009. Hyaluronan In: Varki A, Cummings RD, Esko JD, Freeze HH, Stanley P, Bertozzi CR, Hart GW, Etzler ME, editors. Essentials of Glycobiology, 2nd ed NY: Cold Spring Harbor Laboratory Press, Chapter 15. [PubMed] [Google Scholar]
- Higman A, Briggs DC, Mahoney DJ, Blundell CD, Sattelle BM, Dyer DP, Green DE, DeAngelis PL, Almond A, Milner CM, et al. . 2014. A refined model for the TSG-6 link module in complex with hyaluronan. J Biol Chem. 289:5619–5634. [DOI] [PMC free article] [PubMed] [Google Scholar]
- Hokputsa S, Jumel K, Alexander C, Harding SE. 2003. A comparison of molecular mass determination of hyaluronic acid using SEC/MALLS and sedimentation equilibrium. Eur Biophys J. 32:450–456. [DOI] [PubMed] [Google Scholar]
- Horton MR, Shapiro S, Bao C, Lowenstein CJ, Noble PW. 1999. Induction and regulation of macrophage metalloelastase by hyaluronan fragments in mouse macrophages. J Immunol. 162:4171–4176. [PubMed] [Google Scholar]
- Huang Z, Zhao C, Chen Y, Cowell JA, Wei G, Kultti A, Huang L, Thompson CB, Rosengren S, Frost GI, et al. . 2014. Recombinant human hyaluronidase PH20 does not stimulate an acute inflammatory response and inhibits lipopolysaccharide-induced neutrophil recruitment in the air pouch model of inflammation. J Immunol. 192:5285–5295. [DOI] [PubMed] [Google Scholar]
- Iacob S, Knudson CB. 2006. Hyaluronan fragments activate nitric oxide synthase and the production of nitric oxide by articular chondrocytes. Int J Biochem Cell Biol. 38:123–133. [DOI] [PMC free article] [PubMed] [Google Scholar]
- Itano N, Sawai T, Yoshida M, Lenas P, Yamada Y, Imagawa M, Shinomura T, Hamaguchi M, Yoshida Y, Ohnuki Y, et al. . 1999. Three isoforms of mammalian hyaluronan synthases have distinct enzymatic properties. J Biol Chem. 274:25085–25092. [DOI] [PubMed] [Google Scholar]
- Jamison FW II, Foster TJ, Barker JA, Hills RD Jr, Guvench O. 2011. Mechanism of binding site conformational switching in the CD44-hyaluronan protein-carbohydrate binding interaction. J Mol Biol. 406:631–647. [DOI] [PubMed] [Google Scholar]
- Jiang D, Liang J, Li Y, Noble PW. 2006. The role of Toll-like receptors in non-infectious lung injury. Cell Res. 16:693–701. [DOI] [PubMed] [Google Scholar]
- Jiang D, Liang J, Noble PW. 2011. Hyaluronan as an immune regulator in human diseeases. Physiol Rev. 91:221–264. [DOI] [PMC free article] [PubMed] [Google Scholar]
- Jing W, DeAngelis PL. 2004. Synchronized chemoenzymatic synthesis of monodisperse hyaluronan polymers. J Biol Chem. 279:42345–42349. [DOI] [PubMed] [Google Scholar]
- Jing W, Haller FM, Almond A, DeAngelis PL. 2006. Defined megadalton hyaluronan polymer standards. Anal Biochem. 355:183–188. [DOI] [PubMed] [Google Scholar]
- Kim B, Woo S, Park Y-S, Hwang E, Moon MH. 2015. Ionic strength effect on molecular structure of hyaluronic acid investigated by flow field-flow fractionation and multiangle light scattering. Anal Bioanal Chem. 407:1327–1334. [DOI] [PubMed] [Google Scholar]
- Kincade PW, Zheng Z, Katoh S, Hanson L. 1997. The importance of cellular environment to function of the CD44 matrix receptor. Curr Opin Cell Biol. 9:635–642. [DOI] [PubMed] [Google Scholar]
- La Gatta A, De Rosa M, Marzaioli I, Busico T, Schiraldi C. 2010. A complete hyaluronan hydrodynamic characterization using a size exclusion chromatography-triple detector array system during in vitro enzymatic digestion. Anal Biochem. 404:21–29. [DOI] [PubMed] [Google Scholar]
- Laurent TC, Fraser JRE, Pertoft H, Smedsrod B. 1986. Binding of hyaluronate and chondrotin sulfate to liver endothelial cells. Biochem J. 234:653–658. [DOI] [PMC free article] [PubMed] [Google Scholar]
- Lawrance W, Banerji S, Day AJ, Bhattacharjee S, Jackson DG. 2016. Binding of hyaluronan to the native Lymphatic Vessel Endothelial Receptor LYVE-1 is critically dependent on receptor clustering and hyaluronan organization. J Biol Chem. 291:8014–8030. [DOI] [PMC free article] [PubMed] [Google Scholar]
- Lees VC, Fan TPD, West DC. 1995. Angiogenesis in a delayed revascularization model is accelerated by angiogenic oligosaccharides of hyaluronan. Lab Invest. 73:259–266. [PubMed] [Google Scholar]
- Lesley J, Hascall VC, Tammi M, Hyman R. 2000. Hyaluronan binding by cell surface CD44. J Biol Chem. 275:26967–26975. [DOI] [PubMed] [Google Scholar]
- Liu D, Pearlman E, Diaconu E, Guo K, Mori H, Haqqi T, Markowitz S, Willson J, Sy MS. 1996. Expression of hyaluronidase by tumor cells induces angiogenesis in vivo. Proc Natl Acad Sci USA. 93:7832–7837. [DOI] [PMC free article] [PubMed] [Google Scholar]
- Lokeshwar VB, Selzer MG. 2000. Differences in hyaluronic acid-mediated functions and signaling in arterial, microvessel, and vein-derived human endothelial cells. J Biol Chem. 275:27641–27649. [DOI] [PubMed] [Google Scholar]
- McKee CM, Lowenstein CJ, Horton MR, Wu J, Bao C, Chin BY, Choi AMK, Noble PW. 1997. Hyaluronan fragments induce nitric-oxide synthase in murine macrophages through a nuclear factor kappa B- dependent mechanism. J Biol Chem. 272:8013–8018. [DOI] [PubMed] [Google Scholar]
- McKee CM, Penno MB, Cowman M, Burdick MD, Strieter RM, Bao C, Noble PW. 1996. Hyaluronan (HA) fragments induce chemokine gene expression in alveolar macrophages – the role of HA size and CD44. J Clin Invest. 98:2403–2413. [DOI] [PMC free article] [PubMed] [Google Scholar]
- Mendichi R, Soltes L, Schieroni AG. 2003. Evaluation of radius of gyration and intrinsic viscosity molar mass dependence and stiffness of hyaluronan. Biomacromolecules. 4:1805–1810. [DOI] [PubMed] [Google Scholar]
- Meyer K, Palmer JW. 1934. The polysaccharide of the vitreous humor. J Biol Chem. 107:629–634. [Google Scholar]
- Mikelsaar RH, Scott JE. 1994. Molecular modelling of secondary and tertiary structures of hyaluronan, compared with electron microscopy and NMR data. Possible sheets and tubular structures in aqueous solution. Glycoconj J. 11:65–71. [DOI] [PubMed] [Google Scholar]
- Mitra AK, Arnott S, Sheehan JK. 1983. Hyaluronic acid: Molecular conformation and interactions in the tetragonal form of the potassium salt containing extended chains. J Mol Biol. 169:813–827. [DOI] [PubMed] [Google Scholar]
- Noble PW, McKee CM, Cowman M, Shin HS. 1996. Hyaluronan fragments activate an NF-kappa B/I-kappa B alpha autoregulatory loop in murine macrophages. J Exp Med. 183:2373–2378. [DOI] [PMC free article] [PubMed] [Google Scholar]
- Pandey MS, Baggenstoss BA, Washburn J, Harris EN, Weigel PH. 2013. The Hyaluronan Receptor for Endocytosis (HARE) activates NF-κB-mediated gene expression in response to 40–400 kDa, but not smaller or sarger, hyaluronans. J Biol Chem. 288:14068–14079. [DOI] [PMC free article] [PubMed] [Google Scholar]
- Pandey MS, Weigel PH. 2014. A HARE Link domain N-glycan is required for ERK and NF-κB signaling in response to the uptake of hyaluronan but not heparin, dermatan sulfate or acetylated LDL. J Biol Chem. 289:21807–21817. [DOI] [PMC free article] [PubMed] [Google Scholar]
- Podzimek S, Hermannova M, Bilerova H, Bezakova Z, Velebny V. 2010. Solution properties of hyaluronic acid and comparison of SEC-MALS-VIS data with off-line capillary viscometry. J Appl Polym Sci. 116:3013–3020. [Google Scholar]
- Rockey DC, Chung JJ, McKee CM, Noble PW. 1998. Stimulation of inducible nitric oxide synthase in rat liver by hyaluronan fragments. Hepatology. 27:86–92. [DOI] [PubMed] [Google Scholar]
- Scheibner KA, Lutz MA, Boodoo S, Fenton MJ, Powell JD, Horton MR. 2006. Hyaluronan fragments act as an endogenous danger signal by engaging TLR2. J Immunol. 177:1272–1281. [DOI] [PubMed] [Google Scholar]
- Slevin M, Kumar S, Gaffney J. 2002. Angiogenic oligosaccharides of hyaluronan induce multiple signaling pathways affecting vascular endothelial cell mitogenic and wound Healing responses. J Biol Chem. 277:41046–41059. [DOI] [PubMed] [Google Scholar]
- Stern R, Asari AA, Sugahara KN. 2006. Hyaluronan fragments: An information-rich system. Euro J Cell Biol. 85:699–715. [DOI] [PubMed] [Google Scholar]
- Toole BP. 1990. Hyaluronan and its binding proteins, the hyaladherins. Curr Opin Cell Biol. 2:839–844. [DOI] [PubMed] [Google Scholar]
- Torigoe K, Tanaka HF, Ohkochi H, Miyasaka M, Yamanokuchi H, Yoshidad K, Yoshida T. 2011. Hyaluronan tetrasaccharide promotes regeneration of peripheral nerve: In vivo analysis by film model method. Brain Res. 1385:87–92. [DOI] [PubMed] [Google Scholar]
- Turley EA, Noble PW, Bourguignon LYW. 2002. Signaling properties of hyaluronan receptors. J Biol Chem. 277:4589–4592. [DOI] [PubMed] [Google Scholar]
- Weigel PH, Pandey MS, Harris EN. 2012. Hyaluronan from basic science to clinical applications In: Balazs EA, editor. A HARE/STAB2 Mediated Sensing System May Monitor Tissue Biomatrix Homeostatsis and Stress. vol 5, Edgewater, NJ: Matrix Biology Institute; p. 293–314, Chap 9. [Google Scholar]
- Weigel PHAJ, Padgett-McCue AJ, Baggenstoss BA. 2013. Methods for measuring Class I membrane-bound hyaluronan synthase activity in glycosyltransferases: Methods and protocol. Methods Mol Biol. 1022, doi:10.1007/978-1-62703-465-4_18. Springer Science+Business Media, NY. [DOI] [PubMed] [Google Scholar]
- Weissmann B, Meyer K. 1952. Structure of hyaluronic acid – the glucuronidic linkage. J Am Chem Soc. 74:4729. [Google Scholar]
- West DC, Hampson IN, Arnold F, Kumar S. 1985. Angiogenesis induced by degradation products of hyaluronic acid. Science. 228:1324–1326. [DOI] [PubMed] [Google Scholar]
- West DC, Kumar S. 1989. Hyaluronan and angiogenesis. Ciba Found Symp. 143:187–201. [DOI] [PubMed] [Google Scholar]
- Xu HP, Ito T, Tawada A, Maeda H, Yamanokuchi H, Isahara K, Yoshida K, Uchiyama Y, Asari A. 2002. Effect of hyaluronan oligosaccharides on the expression of heat shock protein 72. J Biol Chem. 277:17308–17314. [DOI] [PubMed] [Google Scholar]
- Yang B, Yang BL, Savani RC, Turley EA. 1994. Identification of a common hyaluronan binding motif in the hyaluronan binding proteins RHAMM, CD44 and link protein. EMBO J. 13:286–296. [DOI] [PMC free article] [PubMed] [Google Scholar]
- Yang B, Zhang L, Turley EA. 1993. Identification of two hyaluronan-binding domains in the hyaluronan receptor RHAMM. J Biol Chem. 268:8617–8623. [PubMed] [Google Scholar]