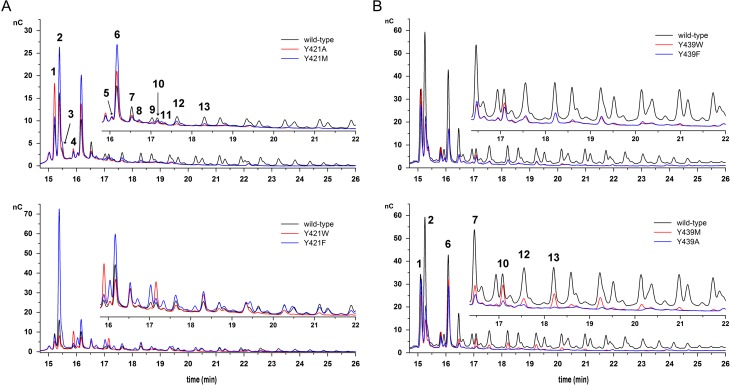
Fig. 5.
HPAEC-PAD product spectra of Y421 (A) and Y439 (B) variants. Products were obtained from reactions containing 0.5 M sucrose and 2 U/mL of enzymatic activity in 50 mM Soerensen buffer pH 6.6. Samples were evaluated at sucrose conversion of around 70%. (1) 1-kestose, (2) blastose, (3) disaccharide, (4) 6-kestose, (5) disaccharide, (6) neokestose, (7) tetrasaccharide Glu-(Fru)3, (8) disaccharide, (9) tetrasaccharide, (10) 6-nystose, (11) tetrasaccharide, (12) pentasaccharide and (13) hexasaccharide. Signal intensities may vary between measurements, thus, wild-type Bm-LS was measured with every sample batch to allow comparison, except for samples in Figure 5B. This figure is available in black and white in print and in color at Glycobiology online.

