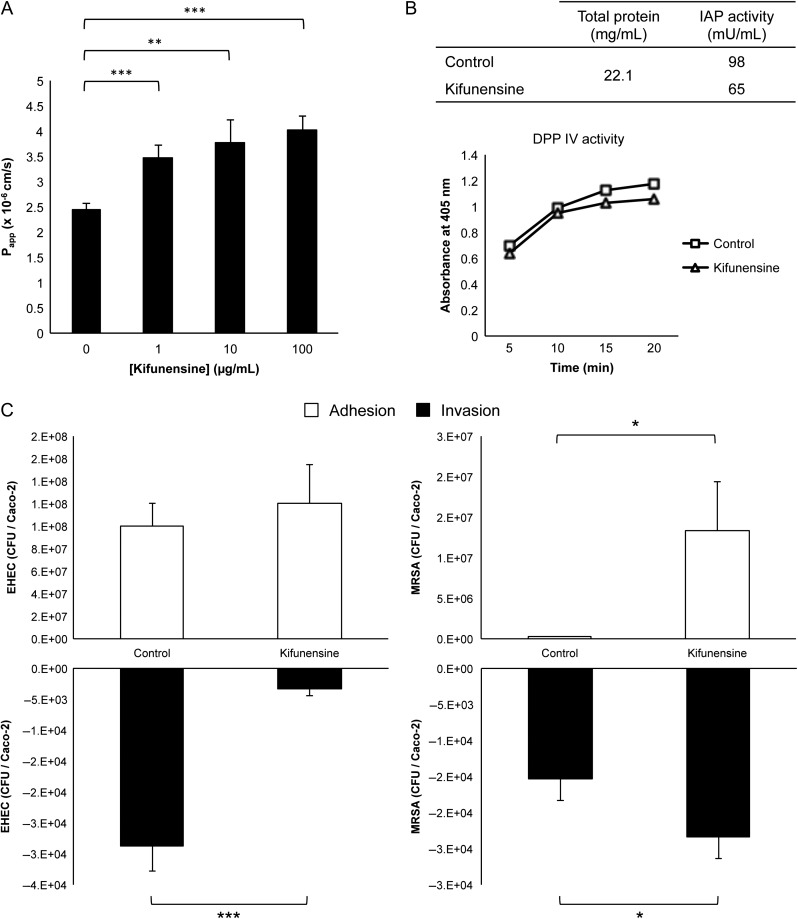
Fig. 5.
Functional assays after transformation of cell surface glycans into high mannose type by kifunensine treatment. (A) Intensity of FITC-dextran measured in the basolateral face after passage through cell monolayers. Error bars depict standard deviation (n = 4). Asterisks denote statistically significant changes, where **P < 0.01 and ***P < 0.001. (B) Comparison of bacterial adhesion and translocation of untreated vs. kifunensine-treated host cells. Asterisks denote statistically significant changes, where *P < 0.05 and ***P < 0.001. (C) Enzymatic activity of IAP and DPP IV in membrane fractions of control and kifunensine-treated cells.

