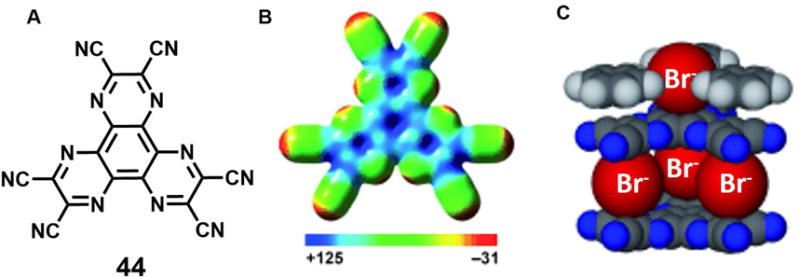
Figure 18. Anionic complexes based on anion-π interactions.

(A) Molecular structure of anion receptor 44.
(B) Electron spin polarization (ESP) map of 44 [kcal mol−1].
(C) Space-filling model of crystal structure of the bromide complex of 44.
Color code: C = black, N = blue, Br = red. The counter cations and other molecules are omitted for clarity.
Taken from Chifotides et al.62 and reproduced with permission. © 2010 Wiley-VCH Verlag GmbH & Co. KGaA.
