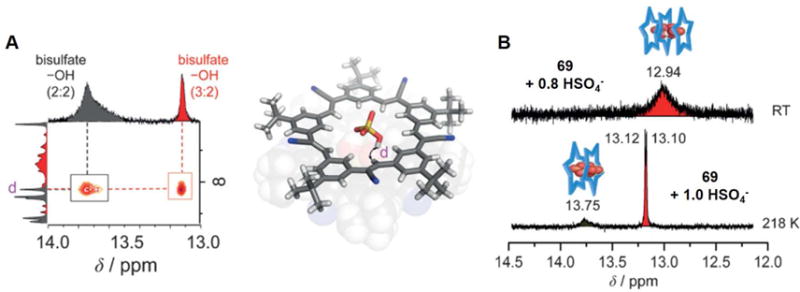
Figure 30. 1H-1H NOESY spectra and 1H NMR spectral signatures.

(A) Through-space correlations that were used to determine solution-phase structures; structures with NOE correlations labeled for HSO4− protons proximal to the inner protons of 69 as determined in CD2Cl2 and 1H-1H NOESY spectra with a mixing time of 800 ms for a solution of 69 (10 mm) containing 4 equivalents of NBu4HSO4 (218 K, CD2Cl2).
(B) 1H NMR spectral signatures of the bisulfate dimers stabilized by 69 at RT and 218 K, respectively. Here the blue star represents receptor 69.
Taken from Fatila et al.94 and reproduced with permission. © 2016 Wiley-VCH Verlag GmbH & Co. KGaA.
