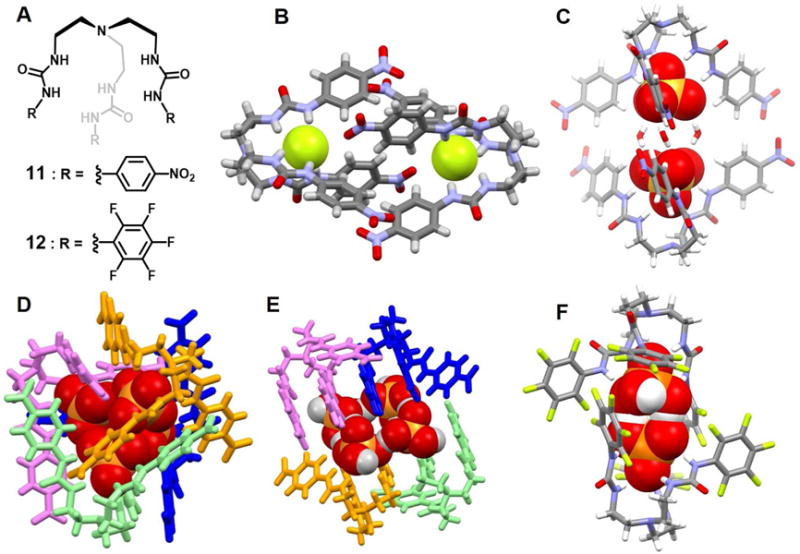
Figure 6. Acyclic tren-based tris(urea) anion receptors and their anionic complexes.

(A) Molecular structures of receptors 11 and 12.
(B) Single crystal X-ray structure of the complex [F2]2−⊂ 112.
(C) Single crystal X-ray structure of the complex [(SO4)2(H2O)3]4−⊂ 112.
(D) Single crystal X-ray structure of the complex [(H2PO4)2(HPO4)2]6−⊂ 114.
(E) Single crystal X-ray structure of the complex [(H2PO4)2(H3PO4)2]2−⊂ 114.
(F) Single crystal X-ray structure of the complex [(H2PO4)2]2−⊂ 122.
All anions encapsulated in the cavities are shown in space-filling form. Color code: C = gray, N = blue, O = red, F = chartreuse yellow and S, P = yellow. For D and E, various colors (pink, blue or aqua) are used to represent different independent ligands. The counter cations and other solvent molecules outside the cavities are omitted for clarity.
