Abstract
We describe the construction of a simplified, inexpensive lattice light-sheet microscope, and illustrate its use for imaging subcellular Ca2+ puffs evoked by photoreleased i-IP3 in cultured SH-SY5Y neuroblastoma cells loaded with the Ca2+ probe Cal520. The microscope provides sub-micron spatial resolution and enables recording of local Ca2+ transients in single-slice mode with a signal-to-noise ratio and temporal resolution (2ms) at least as good as confocal or total internal reflection microscopy. Signals arising from openings of individual IP3R channels are clearly resolved, as are stepwise changes in fluorescence reflecting openings and closings of individual channels during puffs. Moreover, by stepping the specimen through the light-sheet, the entire volume of a cell can be scanned within a few hundred ms. The ability to directly visualize a sideways (axial) section through cells directly reveals that IP3-evoked Ca2+ puffs originate at sites in very close (≤ a few hundred nm) to the plasma membrane, suggesting they play a specific role in signaling to the membrane.
Keywords: lattice light-sheet, Ca2+ puffs, microscopy, Ca2+ imaging
Graphical Abstract
1. Introduction
Calcium serves as a universal intracellular messenger, controlling numerous cellular processes as wide-ranging as gene transcription, secretion, electrical excitability and cell proliferation [1]. The versatility of Ca2+ signaling crucially depends on mechanisms by which cytosolic Ca2+ elevations are generated and transmitted to act over very different time and distance scales - ranging from cell-wide oscillatory waves with periods of minutes to local transient nanodomains lasting only milliseconds [2–4]. This is exemplified by pathway mediated by the second messenger inositol trisphosphate (IP3). IP3 is generated in response to activation of cell surface G-protein coupled receptors, and diffuses in the cytosol to bind to IP3 receptor/channels (IP3Rs) in the membrane of the endoplasmic reticulum (ER), causing them to open and release Ca2+ ions sequestered in the ER lumen. The resulting cytosolic Ca2+ elevations form a hierarchy of signaling events, with increasing amounts of IP3 progressively evoking Ca2+ liberation from individual IP3Rs (Ca2+ blips: [5]); local Ca2+ signals arising from the concerted openings of several IP3Rs within a cluster (puffs; [6,7]); and global Ca2+ waves that propagate through the cell [8,9].
Given that the actions of local Ca2+ signals may be restricted to effectors (such as channels, transporters and binding proteins) located within sub-micron distances from the Ca2+ source, we would ideally like to know the precise location of these signals as well as their magnitude and time course. Following the introduction of small-molecule fluorescent Ca2+ probes [10] it became possible to image cellular and subcellular Ca2+ signals with good fidelity. Nevertheless, technical limitations have always necessitated a tradeoff between the resolution achieved in the three spatial dimensions (x,y,z), in time, and in the fifth ‘dimension’ of signal amplitude and signal-to-noise ratio. Early experiments employing photometric measurements from a single, stationary confocal spot within a cell, yielded excellent (millisecond) time resolution, but at the expense of providing essentially no spatial information [11]. The subsequent use of camera-based, wide-field fluorescence microscopy extended resolution to the x-y plane, but with little discrimination in the axial (z) dimension [12]. During the 1990’s confocal linescan imaging [13] became popular for studies of local Ca2+ signals (sparks [14] and puffs [15]), enabling good temporal resolution along a single spatial dimension, but sampled only a tiny fraction of the cell volume and suffered difficulties in interpreting signals that arise from Ca2+ diffusing from release sites away from the scanned line. By raster scanning of the laser spot, confocal [15] and 2-photon microscopy [provide 2-dimensional (x-y) images from relatively thin (<1 μm) optical sections, but their temporal resolution is limited by the speed at which the laser spot can be scanned. More recently, total internal reflection fluorescence (TIRF) microscopy has enabled fast camera-based imaging of an extremely thin (a few hundred nm) optical section formed by the evanescent field adjacent to the coverglass [16–18]. We had described the use of TIRF microscopy as an optimal modality for imaging Ca2+ flux through individual plasmalemmal channels [19] and puffs arising in close proximity to the plasma membrane at the base of cultured cells [20], but this approach cannot be used to study processes deeper into the cell.
Light-sheet microscopy (selective plane illumination; SPIM) is alternative technique for time-resolved imaging of an optical section through cells. This works by projecting a thin sheet of excitation light through the specimen, and imaging the resulting fluorescence through a second, orthogonal objective lens. A particular advantage is that excitation light is restricted to the imaging plane, thereby minimizing effects of photobleaching and photodamage associated with confocal excitation [21]. Moreover, in contrast to TIRF microscopy, the light-sheet can be positioned to slice through any part of the cell, and can be scanned to render a 3-D volumetric image. Light-sheet microscopy has become the method of choice for imaging relatively large specimens, such as developing embryos, but had been of limited applicability for subcellular imaging because sufficiently thin and extended conventional light-sheets cannot be created with Gaussian beams. This limitation was mitigated by the invention of lattice light-sheet microscopy [22], wherein an array of Bessel beams creates a thin ( ≤ 1 μm) virtual light-sheet extending over tens of micrometers.
Commercial lattice light-sheet (LLS) microscopes based on the original Betzig prototype [22] have only recently become available, but at a price (~$700k) that puts them out of reach for most individual labs. We thus constructed a simplified, relatively inexpensive system based on the same principles. Here we describe the design of this microscope, and illustrate its use for studying the localization and kinetics of Ca2+ puffs within cultured neuroblastoma cells.
2. Experimental Methods
2.1 Lattice light-sheet microscope
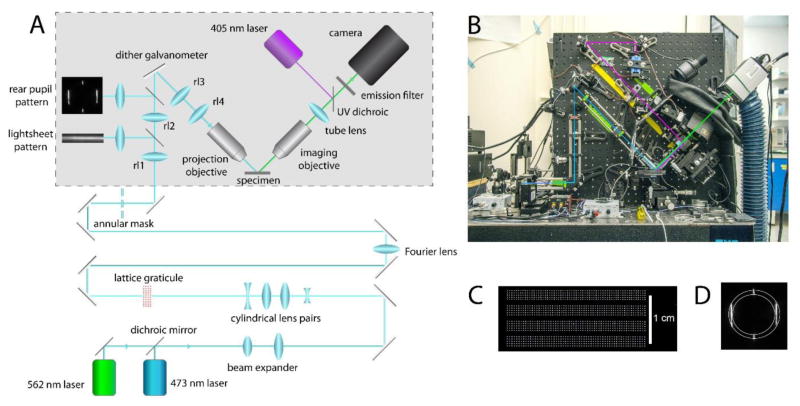
We constructed a microscope largely following the original Betzig HHMI prototype design [22], but with simplifications and cost-saving measures; notably the use of a custom graticule to generate lattice patterns in place of a spatial light modulator, and use of standard Nikon 40x NA 0.8 water-dipping objectives for both projection and imaging lenses. The schematic of the optical system is shown in Fig. 1. Laser beams from solid-state 478 and 562 nm lasers are combined, expanded and then passed through two pairs of cylindrical lenses to create a parallel beam of light as a thin slit that impinges on a custom graticule to generate the lattice pattern. A half-wave plate and polarizing beamsplitter enable continuously variable attenuation of the laser intensity. The graticule (Benchmark Technologies, Lynnfield MA) is etched with multiple lattice patterns (Fig. 1C) of varying periodicities that can be selected by vertical translation of the graticule in front of the light beam. The CAD file for the graticule can be downloaded at https://github.com/kyleellefsen/light_sheet_controller/blob/master/docs/reticle_cad.dwg. A converging lens placed one focal length beyond the graticule forms an image of the diffraction pattern (Fourier transform) of the lattice at its focal point, where an annular mask is placed to block the zero and higher order diffraction patterns, passing only the first order to generate a pattern (Fig. 1C) that is re-imaged via relay lenses onto the rear pupil of the projection objective. The annular mask graticule is mounted on a motorized translation stage, so that it can be rapidly moved to match the change in size of the diffraction patterns formed by the different wavelengths of laser light. A pair of relay lenses (rl 1,2) project a reduced image of the rear pupil pattern passing through the annular mask onto a galvanometer-driven mirror that can be rapidly oscillated to dither the light-sheet pattern projected onto the specimen. Cover slips (acting as partially reflective mirrors) placed between the relay lenses divert a small fraction of the light through lenses to project images of the light-sheet pattern and the pattern formed at the rear pupil onto a viewing screen to assist in aligning the optics. Light reflected by the dither galvanometer mirror then passes through a further pair of relay lenses (r3, r4). These form a conjugate image of the annular aperture at the rear pupil of the 40x NA 0.8 water-dipping projection lens, which then projects the light-sheet into the specimen.
Fig. 1.
Schematic of the LLS microscope. (A) Optical path. Components within the grey box are mounted on a vertical breadboard; other components are mounted on the horizontal surface of an optical table. (B) Photograph of the LLS microscope. Blue line indicates the path of the fluorescence excitation light; green line the fluorescence emission; and magenta line the 405 nm laser light for uncaging. (C) A part of the lattice graticule, showing four sections of square lattice patterns with varying spacings. (D) Image of the Fourier transform pattern passing through the annular aperture. Vertical lines are the diffraction pattern formed by the lattice, and concentric circles indicate the outlines of the annular aperture.
A separate light path projects near-UV (405 nm) light from a 20 mW violet laser module via a dichroic mirror through the imaging objective to induce photorelease of i-IP3 from caged i-IP3 loaded into the cells. The intensity of the photolysis flash is controlled by a variable neutral density filter and its duration by an electronic shutter.
Fluorescence excited in the cells is collected by an identical, orthogonally mounted detection objective focused coincident with the light-sheet, and is projected through a 500 mm tube lens onto a sCMOS camera (Andor Zyla 4.2) providing a final magnification of 105 nm per pixel. A motorized filter changer enables interchange of emission filters appropriate for different fluorophores and laser lines. The projection lens is rigidly mounted, whereas the imaging lens is mounted on a 3-axis translation stage to enable it to be positioned and focused at the same plane as the projected light-sheet. Cells are cultured on a 1 cm coverglass, which is adhered with vacuum grease to a light cantilever attached to a single-axis piezoelectric translation stage. That, in turn, is mounted on a 3-axis translation stage driven by manual differential micrometers. The piezo is controlled by custom software to step the specimen through the light-sheet, in coordination with image acquisition by the camera. Image acquisition is controlled by Micro-Manager open source microscopy software (https://micro-manager.org/). For maximal temporal resolution the camera is operated in free-running internal trigger mode, to acquire images from a single light-sheet slice at rates up to 500 fps. For 3D imaging the camera is operated in ‘external triggered’ mode, so that a TTL trigger generated by custom software initiates acquisition and determines the frame acquisition time. The camera is typically set to acquire from a central region of interest of 512 × 256 pixels, corresponding to about 50 × 25 μm at the specimen, which largely encompasses the usable extent of the light-sheet. In conjunction with the ~100 μm maximum deflection of the piezo, the maximum volume that can be imaged is thus about 100 × 50 × 18 μm (x,y,z in conventional rectangular coordinates, with the z dimension = 25 × √2 μm because of the 45° diagonal scan).
2.2 Microscope control software
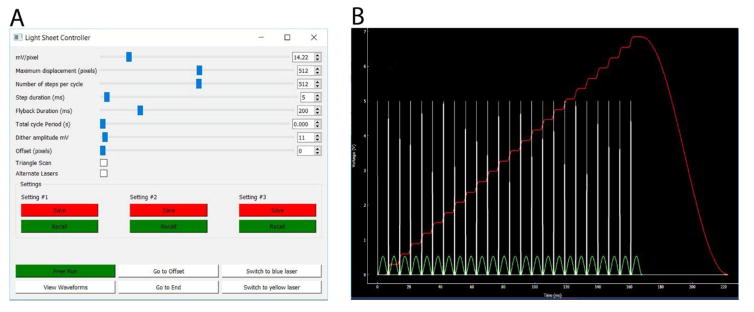
Custom written software (‘flika’) is used for both control of the microscope and camera during image acquisition, and for post-processing of acquired image stacks [23]. This open-source software written in the python programming language is freely available for download at https://github.com/kyleellefsen/light_sheet_controller and https://github.com/kyleellefsen/light_sheet_analyzer. A stand-alone program ‘light-sheet controller’ enables 3D image acquisition by synchronizing camera triggering with control of the piezo stepper, the dither galvanometer, laser activation, exchange of emission filters and lateral positioning of the annular aperture by generating analog voltages and TTL pulses from two National Instruments USB interfaces (NI USB 6001). A screenshot of the dialog box is shown in Fig. 2A, and Fig. 2B illustrates representative waveforms generated by the software. Sliders allow the displacement of the scan and the number of steps in the scan to be adjusted, in units of the camera pixel size at the specimen, as calibrated by the mV/pixel that sets the piezo displacement corresponding to the pixel size. At the beginning of each step a TTL pulse (white spikes, Fig. 2B) triggers acquisition of a new camera frame, so the step duration slider controls both the duration at a step position and the frame acquisition time. During each frame acquisition time the dither galvanometer is driven through a single sinusoidal cycle (green trace, Fig. 2B), with peak-to-peak amplitude typically set to a displacement of about 3 μm at the specimen. At the end of the volume scan, the piezo position returns to the starting point, over a time set by the flyback duration slider. The piezo control signal is damped to minimize mechanical ringing following abrupt transitions (red trace, Fig. 2B), and in practice we find a minimum flyback duration of about 20 ms is needed to minimize ringing following a maximum displacement scan. A checkbox enables switching between the regular mode with flyback to the starting position between scans, and a high-speed bi-directional triangular scan mode. A further checkbox enables laser and emission wavelengths to be alternated between successive scans, with a TTL signal serving to shutter the lasers, alternate positions of the annular mask, and alternate emission filters. A set of buttons allow three configurations of all of these settings to be stored and recalled.
Fig. 2.
Microscope control software. (A) Dialog box of the light-sheet controller. From the top, the sliders control the step size of the piezo translator (which is set to match the pixel size of the camera); the maximum displacement of the piezo scan (in units of camera pixels); the number of steps per cycle; the duration of each step (which also sets the camera exposure time); the flyback duration; the total cycle period (used for timelapse imaging with intervals between scans); the amplitude of the signal applied to the dither galvanometer; and an offset of the starting scan position from the zero position of the piezo. As shown, the sliders are set to generate a volume image comprising 512 diagonal planes, each captured in 5 ms, giving a total time per volume of 2560 ms plus 200 ms for flyback. Checkboxes enable a fast bidirectional (triangle) scan mode to be activated that obviates the time otherwise required for flyback, an option to to switch laser excitation and emission filters between alternate volume scans. Buttons enable up to 3 sets of settings to be permanently stored and retrieved. (B) Window activated by the ‘View Waveforms’ button in the dialog box. This displays the waveforms (in V) generated to trigger camera acquisition (white spikes), the dither galvanometer signal (green sinusoid), and the piezo control signal (red stepped trace).
2.3 Cell preparation and imaging
SH-SY5Y neuroblastoma cells were cultured as described previously [7] and plated on 1 cm circular coverslips [24] that were mounted on the piezo stage of the LLS using vacuum grease to adhere it to the cantilever. Before imaging, cells were loaded by incubation with membrane-permeable esters of the Ca2+ indicator Cal-520; a caged precursor of a slowly metabolized IP3 analog, i-IP3 (SiChem; #cag-iso-2-145-10); and EGTA, a slow Ca2+ buffer introduced to inhibit propagation of cytosolic Ca2+ waves and sharpen the spatio-temporal profile of puffs [25]. Cells were further incubated for 10 min with 1/10,000 Cell Mask Deep Red membrane plasma membrane stain (ThermoFisher), and in some experiments with Nuclear-ID Red (Enzo Life Sciences) to label the nucleus. Cells were imaged at room temperature in a HEPES buffered salt solution containing 2 mM Ca2+. Images were first recorded at fast (250 or 500 fps) frame rates using 473 nm excitation and green bandpass (520 ± 20 nm) emission filters to record Ca2+ fluorescence signals reported by Cal520. Image frames were then acquired after switching to 562 nm excitation and a long-pass (>590 nm) emission filter to visualize the plasma membrane stained with Cell Mask Deep Red. Following sustained exposure to 562 nm light we found that the fluorescence of Nuclear-ID Red stain increased substantially, and acquired a final set of images after about 30s exposure to generate a composite image (e.g. Fig. 5A) with the plasma membrane depicted in red and nucleus pseudocolored in blue.
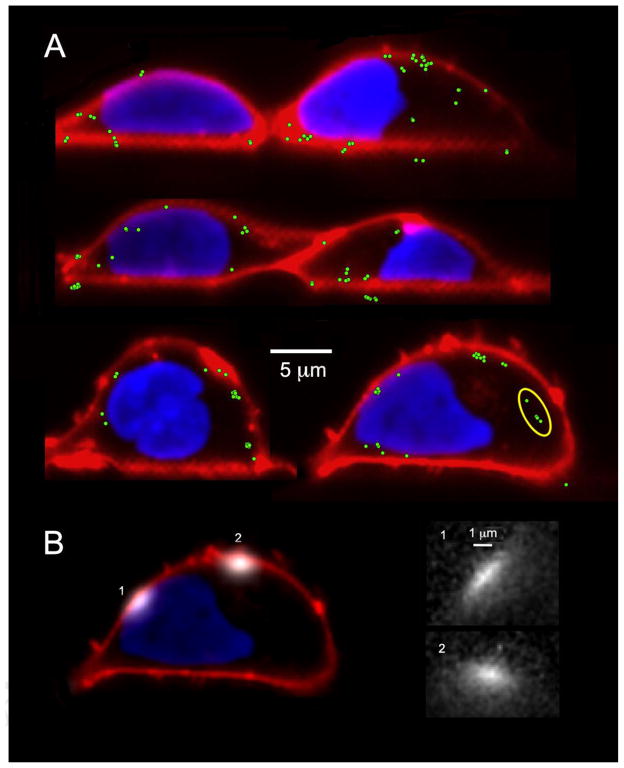
Fig. 5.
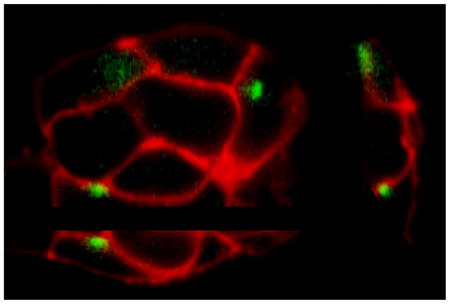
Localization of puffs with respect to the plasma membrane and nucleus. (A) Representative light-sheet sections of cells stained with Deep Red Membrane marker and Nuclear-ID Red to visualize the plasma membrane (depicted in red) and the nucleus (depicted blue). The green dots mark centroid locations of puff fluorescence signals evoked by photorelease of i-IP3. (B) The left panel shows superimposed images of two puffs (depicted in white), arising at different times following photorelease of i-IP3, at sites adjacent to (1) and distant from (2) the nucleus. The right panel shows enlarged views of these puffs, captured as single frames at the time of peak fluorescence.
2.4 Image processing and analysis
We process single-slice (x,y,t) image stacks acquired at a single position in the specimen using the custom flika image processing and analysis software [23]. Image stacks are imported as 16 bit multi-plane TIFF files. To detect puffs, each movie was processed to create two movies: the F/F0 movie and a spatially and temporally filtered movie. First, the camera black level was subtracted from the movie. Then, to produce the F/F0 movie, for every frame, each pixel’s value was divided by its average value before the UV flash. To create the spatially and temporally filtered movie, first the UV flash artifact was removed by setting all pixel values of the F/F0 movie during the flash to 1. Then a high pass Butterworth temporal filter was applied to remove low frequency signal fluctuations. To normalize the amplitude of the noise across pixels, each pixel in the movie was then divided by the standard deviation of the pre-flash baseline movie. Each frame was blurred with a Gaussian kernel to remove high spatial frequency noise. Finally, because the location of the IP3Rs underlying puffs is more correlated with the centroid of the Ca2+ signal from the initial frames than the later frames of each puff, we applied a difference filter which each frame by the prior frame. This filter emphasized the rising phase of each puff.
These two movies - the F/F0 movie and the filtered movie – were then passed into the custom detect_puffs plugin. The detect_puffs plugin applies a threshold to the filtered movie to detect pixels with activity significantly above the background noise. It then uses a novel clustering algorithm to determine the spatial-temporal extent of each discrete puff. Finally it fits a 2D Gaussian function to determine the subpixel centroid position of each signal, which in this case is the centroid of each puff during its rising phase.
Nucleus, membrane, and puff images were aligned manually and overlaid using a custom script. Distances from puffs to the plasma membrane were determined by manually tracing the membrane and, for each event, calculating the minimum distance from each puff to the membrane outline. The proportion of the cell membrane adjacent to the coverglass was determined by manually tracing the membrane perimeter from single-slice images.
For three-dimensional reconstruction, image stacks generated by piezo scanning of the specimen are processed by a plugin (‘light-sheet analyzer) for the custom flika image processing and analysis software. Image stacks are imported as 16 bit multi-plane TIFF files. After specifying the number of steps per volume, the program transforms the series of diagonal slices into a 4D (x, y, z, time) volume with orthogonal Cartesian coordinates. The volume can be viewed as selected slices or maximal intensity projections in x-y, x-z and y-z planes, and exported for viewing in software such as Imaris.
3. Results
3.1 Optical characterization of the lattice light-sheet microscope
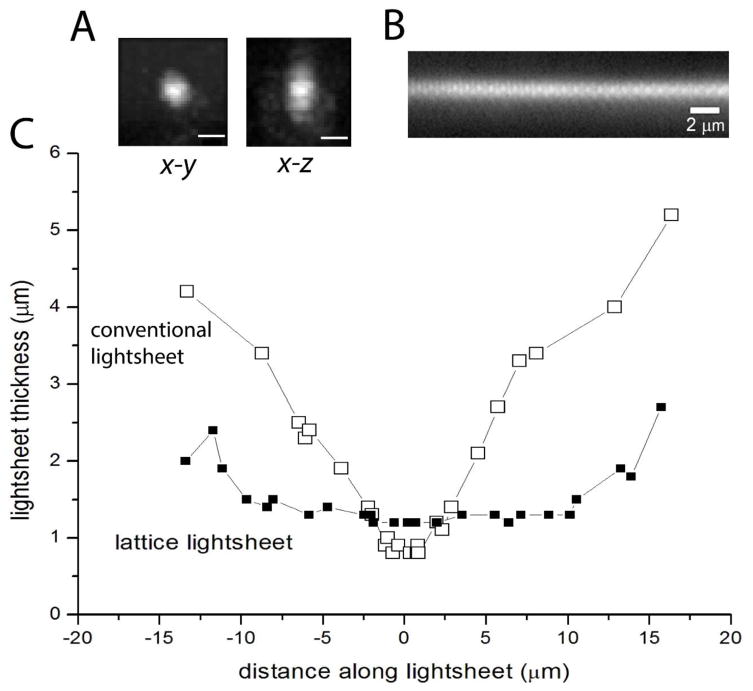
To assess the performance of the microscope, we determined the point-spread function (psf) by imaging 100 nm red FluoSpheres (ThermoFisher) deposited on a coverslip. Images were acquired stepping the coverslip in 100 nm increments, and Fig. 3A shows examples of the psf derived from a single bead after transforming to conventional x,y,z coordinates. To quantify this we fitted 3D Gaussian functions, obtaining mean widths (full width at half-maximal amplitude: FWHM) of 473 ± 8 nm in x, 464 ± 10 nm in y, and 780 ± 17 nm in z; n = 6 beads. To estimate the lateral extent over which the light-sheet remained acceptably thin we imaged the fluorescence excited when the light-sheet impinged on a coverglass coated with a film of DiI (Fig. 3B). The width of the fluorescence stripe provides a measure of the thickness of the light-sheet, and we determined the FWHM as the coverglass was axially translated (Fig. 3C). The width remained ~1.2 μm over a lateral extent (distance along the plane of the light-sheet) of about 20 μm, corresponding to an axial extent of ~14.5 μm; sufficient to encompass the height of most cultured cell types.
Fig. 3.
Optical characterization of the LLS microscope. (A) Point-spread function assessed by imaging 100 nm red (λem >600 nm) fluospheres with 100 nm steps in the x-dimension. Panels show images reconstructed in x-y and x-z planes, with 105 nm camera pixel resolution. Scale bars = 0.5 μm. (B) Cross-section of the light-sheet, imaged by projection onto a film of DiI deposited onto a coverglass. (C) Light-sheet thickness as a function of distance along the light-sheet. Points show light-sheet thickness measured as the FWHM intensity of fluorescence excited by the light-sheet impinging on a film of DiI deposited on a coverglass that was translated in the axial (z) dimension. Filled squares show measurements obtained with the lattice light-sheet. For comparison, open symbols show measurements obtained with conventional light-sheet excitation, after removing the lattice and annular aperture graticules from the light path.
3.2 Dynamic light-sheet imaging of subcellular Ca2+ signals
To explore the capability of lattice light-sheet microscopy for studying local subcellular Ca2+ signals we loaded SH-SY5Y neuroblastoma cells cultured on 1 cm coverslips with the Ca2+ indicator Cal520 together with caged i-IP3 and EGTA [26]. In some experiments cells were further incubated with Cell Mask Deep Red to stain the plasma membrane, and with Nuclear-ID Red to stain the nucleus. Ca2+ imaging was done using 473 nm laser excitation and a 510–560 nm bandpass emission filter, whereas plasma membrane and nuclear imaging used 563 nm laser excitation and a 590 nm long-pass emission filter. Mechanical interchange of the emission filters and annular aperture appropriate to each laser wavelength required about 0.5 s, so images of membrane and nuclei were obtained after capturing a sequence of Ca2+ images.
We describe two modes of imaging, representing different trade-offs between temporal and spatial resolution. In the first mode (‘single slice’) the piezo remained at a fixed position, so that sequential images were acquired at fast frame rates from a single diagonal plane through the cell. This enables excellent temporal resolution (500 fps or faster), but at the cost that only a small fraction of the cell is sampled, and that blurred fluorescence signals arising from Ca2+ diffusing from sites beyond the light-sheet cannot be unambiguously identified. In the second mode (‘volume imaging’) the sample was scanned by the piezo stage to encompass a part, or the whole of the cell volume. The temporal resolution was then determined by the dwell time per slice and the number of slices per volume; the latter, in turn, a trade-off between the maximum extent of the scan and the spatial resolution in terms of the spacing between slices.
3.3 Single-slice Ca2+ imaging
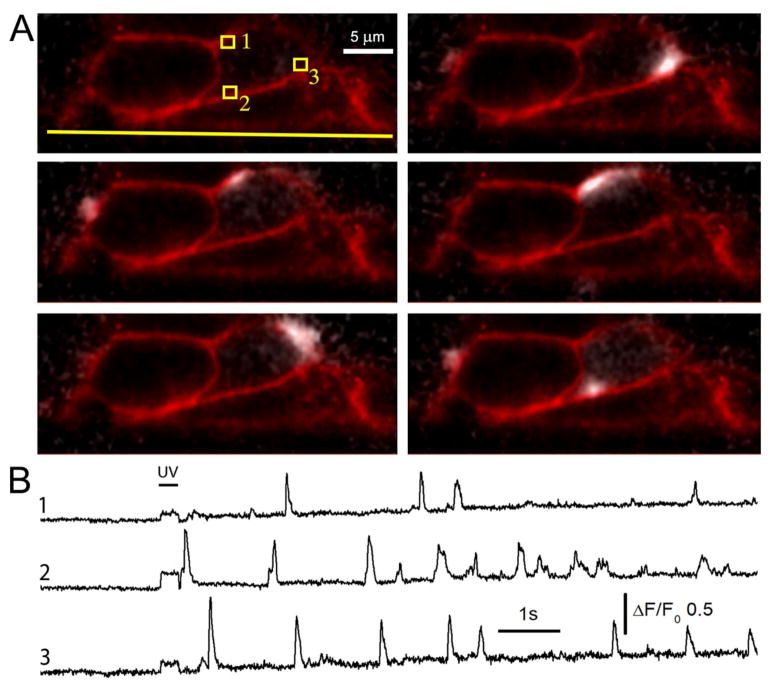
Fig. 4A illustrates selected frames from a record (online Movie 1) where Ca2+ puffs evoked by photorelease of i-IP3 were imaged in a single diagonal slice (frame rate 250 s−1) from a clump of SH-SY5Y cells loaded with Cal520. The laser and emission filter were then switched to image a deep red membrane stain, and the panels show the cross section of the plasma membranes in red, with puffs (ratio changes in Cal520 fluorescence relative to the baseline fluorescence before stimulation) overlaid in grey scale. The top left frame, showing only the membrane stain, was acquired before stimulation, and subsequent panels illustrate snapshots of stochastic puffs arising at different locations in two cells. The traces in Fig. 4B show fluorescence records of several repeated puffs arising at the sites numbered in the top left panel of Fig. 4A.
Fig. 4.
Single-slice imaging of near-membrane Ca2+ puffs. (A) Top left panel shows a diagonal cross section through a clump of SH-SY5Y cells imaging the plasma membrane with a deep red membrane marker, utilizing 562 nm excitation and a 590 nm long pass emission filter. This image was captured before imaging Ca2+ puffs with 473 nm excitation and 510–55 nm bandpass emission filter, and is superimposed on the following panels that show puffs (depicted in white) arising at different times following photorelease of iIP3. The yellow line in the top left panel indicates the location of the coverglass, and small squares mark regions of interest used to derive the fluorescence traces in B. (B) Traces show fluorescence ratio signals (ΔF/F0) measured from roughly 1 fl volumes (1 × 1 μm regions of interest) at numbered locations marked in A. The bar indicates the timing of the UV exposure used to photorelease i--IP3.
3.4 Ca2+ puffs originate around the cell periphery
We had previously reported that puffs can be recorded with high fidelity by TIRF microscopy [7,27], indicating that some sites of Ca2+ release must lie close to the plasma membrane. However, wide-field fluorescence imaging of the same cells revealed further puff that were not apparent with TIRF illumination, leaving open the question of whether those puff arose in the interior of the cell, or near the plasma membrane on the ‘far’ side of the cell. By diagonal slice LLS imaging we find that puffs arise predominantly, if not exclusively, around the cell periphery in proximity to the plasma membrane.
To locate puff sites we used the custom flika software [23] to localize the centroid positions of fluorescence signals during puffs recorded by single-slice LLS imaging. The green dots in Fig. 5A mark centroid locations of puffs arising within 6 cells, counterstained to show the plasma membrane (red) and nucleus (blue). The majority of these localizations were distributed around the plasma membrane. However, some fluorescence signals, which tended to be of lower amplitude and more diffuse spatial spread, gave localizations deeper in the cell or even slightly outside the cell. We interpret these signals as arising from puff sites located beyond the plane of the light-sheet, with fluorescence ‘bleeding through’ because of the finite point-spread function of the microscope and the diffusion of Ca2+ in the cytosol. For example, we believe the localizations circled in the lower right panel of Fig. 5A likely arose from puff sites located on the cell membrane where it curved around behind or in front of the light-sheet section.
The membrane-associated puff sites further appear to be distributed around the perimeter of the cell without marked preferential localization to the footprint of the cell contacting the coverglass. In 24 cells adherent to the coverglass we counted 49 puff sites (39% of total) adjacent to the coverglass, as compared to 76 (61%) around the remainder of the cell periphery; a ratio roughly comparable to the proportion (28%) of the membrane periphery in these cells that was in contact with the coverglass.
3.5 Puff sites in relation to the nucleus
The nucleus occupies a substantial fraction of the cell volume in SH-SY5Y cells. Thus, the apparent plasmalemmal localization of puff sites might arise if puffs originated from clusters IP3R channels in the nuclear membrane [28] where this lay close to the plasma membrane, or from regions of the ER constrained to a thin circumferential band between the nucleus and cell membrane. To address this issue we imaged Ca2+ puffs in cells counter-stained to visualize both the plasma membrane and nucleus (Fig. 5 and online Movie 2). As illustrated in Fig. 5A, we observed several puffs that localized to regions where the nucleus was closely apposed to the membrane. The fluorescence signals during these events were elongated in comparison to puffs arising at plasma membrane regions distant from the nucleus (Fig. 5B), suggesting that Ca2+ diffusion was confined to a narrow space between the nuclear and cell membranes.
Although the resolution of our images is insufficient to directly discern whether nuclear-associated puffs arose from IP3R channels located in the nuclear or plasma membranes, the latter explanation is the more likely. In recordings from 15 light-sheet slices we observed 45 plasma membrane-associated puff sites distant from nuclei, 38 sites at regions where the nucleus was closely apposed to the plasma membrane, but no sites where puffs clearly originated at regions of the nuclear envelope well separated from the plasma membrane.
3.6 Proximity of active IP3R clusters to the plasma membrane
To estimate the proximity of puff sites to the plasma membrane, we measured the distances of fluorescence localizations to the closest point on the plasma membrane as stained by the Deep Red marker. The histogram bars in Fig. 6A show the distribution of distances measured in the 6 cells illustrated in Fig. 5A. The centroids of most puffs lay within about 500 nm of the membrane, and almost all within 1 μm.
Fig. 6.
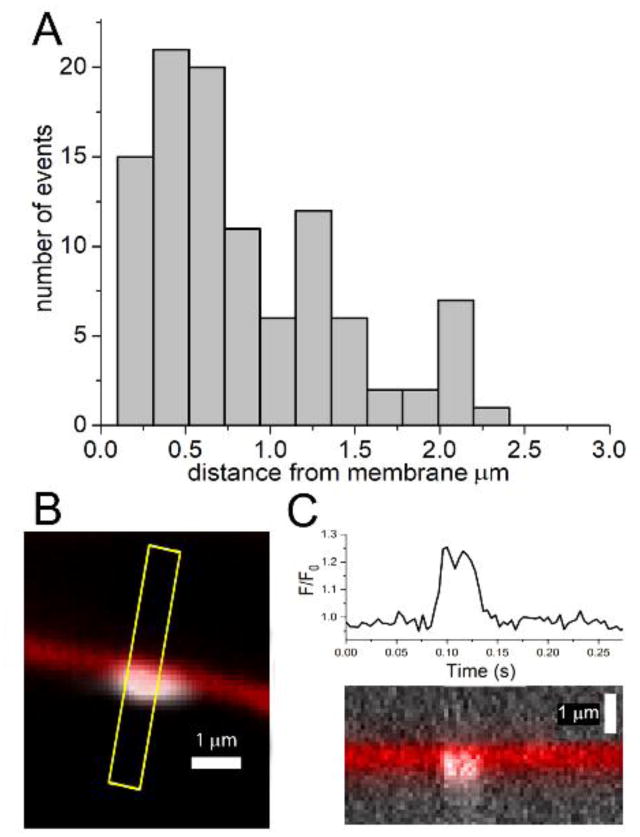
Proximity of puffs to the plasma membrane. (A) Distribution of distances of centroid locations of puff fluorescence ratio signals from the cell membrane. Data are from 100 events in the 6 cells illustrated in Fig. 5A. (B) Enlarged view illustrating a small Ca2+ event arising in immediate proximity to the plasma membrane. The membrane is depicted in red; the extent of the Ca2+ fluorescence signal averaged over its duration (40 ms, 10 frames) is depicted in white. (C) Upper panel shows the fluorescence ratio signal measured from a ~1 fl volume centered on the Ca2+ event, and the lower panel shows a kymograph image on the same timescale showing the position of the membrane and fluorescence signals (white) along the yellow line marked in (B).
The algorithm used to determine puff centroids works by fitting a two-dimensional Gaussian function to the distribution of the fluorescence signal. In the case of radially-symmetric diffusion of Ca2+-bound indicator in the imaging plane, such as puffs recorded by TIRF imaging, the centroid location is expected to map closely onto the source of the Ca2+ release; i.e. the location of the active IP3R channels [29]. However, this would not be the case for axial light-sheet images, where diffusion of Ca2+ from sites next to the plasma membrane would be constrained by the membrane. The measured distances of puff centroid localizations from the membrane in Fig. 6A are thus likely to overestimate the true separation of the Ca2+ release sites from the membrane. To better estimate how closely the IP3R channels generating puffs might be to the membrane we selected events with narrow spatial extent suggesting that they arose from sites in-focus with the plane of the light-sheet. Fig. 6B shows an example, with the extent of the fluorescence signal averaged over its duration depicted in red, the adjacent plasma membrane in white, and green dots marking the centroid positions of the fluorescence signal during individual frames. Fig. 6C further shows a kymograph image of this event, averaged along the line marked in yellow on panel B, with time running horizontally and distance along the line vertically. Ca2+ fluorescence is in white, and the location of the plasma membrane in red; the timescale is as marked on the trace plotting the fluorescence ratio signal (ΔF/F0) measured from a region of interest centered on the puff site. The mean centroid location of the Ca2+ fluorescence was displaced only about 300 nm from the centerline of the membrane image. In light of the expected asymmetrical, hemispheric diffusion of Ca2+ into the cytoplasm away from the membrane boundary, and the resolution limit imposed by the point-spread function of the microscope, it therefore seems the source of the Ca2+ signal must have been within <300 nm of the membrane.
3.7 Temporal resolution and signal-to-noise ratio
The fidelity with which local Ca2+ signals can be recorded utilizing soluble fluorescence indicator dyes involves a trade-off determined by the cytosolic volume from which fluorescence is recorded. Model simulations show that as the imaging volume centered on a release site is reduced the kinetics of the fluorescence signals improve and more closely track the underlying Ca2+ flux, whereas the signal-to-noise ratio diminishes because fewer indicator molecules are present within that volume [30]. We had previously described that measurements obtained by TIRF imaging, encompassing a sampling volume of about 1 × 1 × 0.2 μm (~0.2 fl), enabled a temporal resolution of a few ms. Moreover, the signal-to-noise ratio was sufficient to resolve Ca2+ flux through single channels, as well as stepwise changes in fluorescence during puffs thought to reflect the openings and closings of individual IP3R channels in a cluster [7].
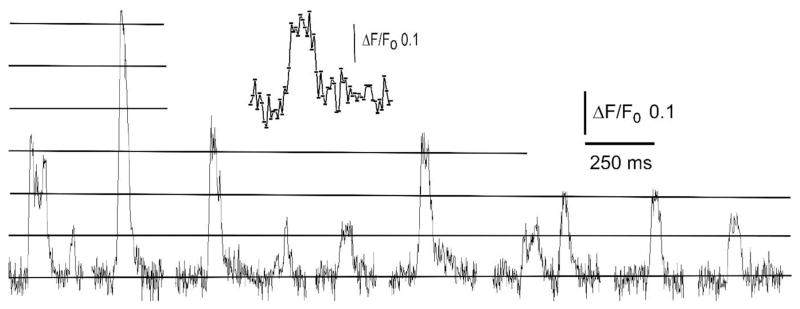
How then do lattice light-sheet recordings compare with TIRF recordings? The inset trace in Fig. 7 shows a puff recorded by the LLS at 500 fps from a 1 × 1μm region of interest centered on a site that was in sharp focus; the sampling volume would thus have been ~1 fl, taking into account the thickness of the light-sheet. Both the rise and fall of the fluorescence signal were complete within two frames (4 ms), providing an illustration of the temporal resolution of the recordings. Fig. 6 further shows representative examples of local Ca2+ signals recorded at a rate of 250 fps from a single puff site. The traces show both ‘square’ events (Ca2+ ‘blips’), resembling single channel recordings, and larger puffs with distinct stepwise transitions at levels corresponding roughly to multiples of the single-channel amplitude (ΔF/Fo ~0.095; marked by horizontal lines in Fig. 7). The standard deviation of the baseline noise was about 0.03 ΔF/Fo, representing a signal-to-noise ratio of about 3:1 for detection of elementary Ca2+ blips arising from openings of individual IP3Rs. This closely matches the sensitivity we typically achieve in TIRF recordings, with a noise standard deviation of about 0.03 ΔF/Fo for the equivalent frame rate (250 fps) and region of interest (1 μm2).
Fig. 7.
Stepwise changes in fluorescence signal during puffs. Traces show a compilation of puffs arising at a single site following photorelease of i-IP3. The recording was made from a 1 × 1 μm region of interest centered on a sharply focused puff site in a sequence of single-slice LLS images captured at 2 ms exposure time. Vertical axis depicts fluorescence ratio change (ΔF/F0) and horizontal lines indicate visually identified step levels of fluorescence at integer multiples of ΔF/F0 0.95. The inset shows a single event on an expanded timescale, with points marking measurements at successive 2 ms frame intervals.
3.7 Volume imaging
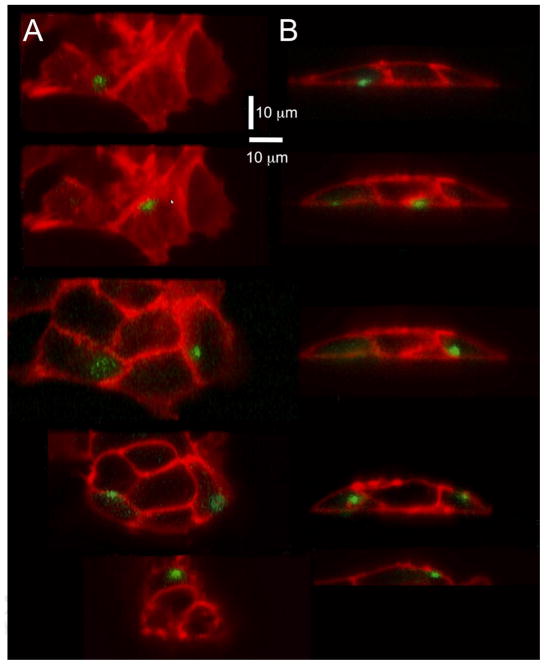
Single-slice imaging provides excellent temporal resolution of dynamic local Ca2+ signals, but samples from only a small fraction of the cell volume. By scanning through the sample puff sites can be mapped throughout the entire volume of cells, but with a sacrifice in temporal resolution. Fig. 8 shows x-y (A; ‘top view’) and x-z (B; ‘side view’) sections from 3D reconstructions of a clump of SH-SY5Y cells stained with Deep Red membrane marker, illustrating Ca2+ puffs arising at different locations and times. The reconstructions were formed from 64 slices, acquired at 4 ms intervals and 400 nm steps. The total acquisition time per volume, including 25 ms flyback time, was thus about 280 ms. Given that the typical duration of Ca2+ puffs is only about 100 ms, a puff would be captured, at best, only during a single scan; and as many as two-thirds of events may have been missed because they occurred while the scan progressed through a different region. Nevertheless, repeated scans over several seconds would serve to locate most sites given that multiple puffs generally recur at fixed locations (e.g. Fig. 4B).
Fig. 8.
(A,B) show, respectively, x-y and y-z sections through a 3D reconstruction formed by scanning the light-sheet through a clump of SH-SY5Y cells. Individual slices (~ 50 × 25 μm) were acquired with 4 ms exposure time, and 64 sections were acquired in 400 nm increments to encompass a trapezoidal volume of about 50 × 25 × 25 μm at a rate of 280 ms per volume. Cells were stimulated by photorelease of i-IP3, and the pairs of panels show, respectively, top- and side-view sections of puffs (fluorescence ratio change, ΔF/F0, depicted in green) arising at different times and locations in the cells. The upper two pairs of panels show puffs arising at the cell membrane adjacent to the coverglass, and the other panels illustrate puffs arising at increasing distances above the coverglass. The sections in the left panels were taken at planes that intersected the puff sites. The lower panel in B was cropped by the trapezoidal geometry of the reconstruction, and shows only the ‘top’ of the cell.
4. Discussion
4.1 A low-cost lattice light-sheet microscope
The microscope we describe is based on the design by Eric Betzig [22], with modifications to simplify construction and reduce cost. One simplification is the use of a fixed graticule to generate the lattice pattern, rather than a programmable spatial light modulator. This is not expected to result in degradation of optical performance, but the need to mechanically interchange the annular aperture to match the diffraction pattern for different laser wavelengths imposes a delay of a few hundred ms, so multi-color imaging can be done only on a volume by volume basis, rather than slice by slice. Another major difference is the use of an identical pair of inexpensive Nikon 40x NA 0.8 water-immersion objectives (costing about $5k) in place of a custom projection lens and 25x NA 1.1 imaging objective (together costing > $50k). Optically, there should be little compromise in terms of projection of the light-sheet; both projections lenses have similar NA, and the specialized feature of the custom lens is only the narrow angle of its snout, allowing it to fit orthogonal to the high-NA imaging lens. Because of the smaller NA of our imaging lens (0.8 vs 1.1) the light collection efficiency (which varies as the square of NA) will be lower by about 50%, with a theoretical loss of resolution from about 220 to 340 nm and a wider effective thickness of the light-sheet. For the purpose of Ca2+ imaging the degraded resolution and section effect may be largely moot, as diffusion blurs the fluorescence signal to a much greater extent than the microscope point-spread function.
We believe that LLS imaging represents a powerful adjunct to the available toolkit of Ca2+ imaging modalities. The system we described can be built for a cost little more than that of a home-built TIRF microscope, although would-be constructors should be warned that assembly and alignment are considerably more difficult. Major advantages are the ability to image axial slices with a temporal resolution limited only be the camera frame rate and photon budget; minimal photobleaching and phototoxicity, enabling long-term imaging or use of high excitation intensities to maximize signal-to-noise ratio; and capability of volumetric, 3D imaging at relatively fast rates. LLS and TIRF microscopy share the advantage that fluorescence excitation is limited to the focal plane that is imaged, and in both cases the temporal resolution is largely determined by the frame rate of the camera that is used. In practice, we obtain a similar signal-to-noise ratio (about 3:1) in terms of the elementary Ca2+ signals generated by openings of individual IP3R channels recorded by LLS and TIRF microscopy. However, the major limitation of TIRF microscopy is its restriction to imaging only a 2D plane immediately adjacent to the coverglass, leaving the bulk of the cell unexplored. Although the TIRF optical section is thinner than with LLS microscopy (respectively, <200 nm vs. ~1 μm; corresponding to diffraction-limited imaging volumes of ~0.01 fl vs. ~0.2 fl), that advantage would not be expected to be important for Ca2+ signals that diffuse over distances > 1 μm.
We illustrate here the application of LLS microscopy for high spatial and temporal resolution of local subcellular Ca2+ signals, and envisage that LLS imaging will further be advantageous for imaging in thin tissues; for example for studies of vascular myoendothelial Ca2+ coupling [31].
4.2 A sideways look at Ca2+ puffs
We had previously described that puffs can be recorded by TIRF microscopy [7,20], indicating that that these Ca2+ fluorescence signals are present in the thin evanescent field encompassing the cell membrane and cytosol immediately adjacent to the coverglass. However, additional puffs could be observed by widefield microscopy that might have arisen at sites within the cell interior, and the fluorescence signals observed in TIRF could result from Ca2+ diffusing from release sites located a micron or more from the cell membrane. The axial view provided by light-sheet microscopy directly resolves these questions, by demonstrating that Ca2+ puffs arise almost exclusively at peripheral sites around the plasma membrane, rather than being generated from the ER in the cell interior. Moreover, puff sites appear to be situated within no more than a few hundred nm of the membrane, a maximal estimate set by the resolution of the LLS microscope and the diffusional spread of the fluorescent Ca2+ indicator. This proximity may explain a surprising finding from TIRF imaging, namely that the fluorescence ratio (ΔF/Fo) signal corresponding to Ca2+ flux through individual IP3R channels is remarkably consistent (ΔF/Fo ~ 0.11) between different puff sites and across different cells [7,32]. Although the ratio is expected to normalize for factors including differences in indicator loading and how closely the cell adheres to the coverglass, it would vary if the clusters of IP3Rs that generate puffs were situated at differing distances from the cell membrane. Indeed, the close membrane localization identified by LLS imaging makes a case that, for many purposes, TIRF microscopy may actually be the preferred modality for studying Ca2+ puffs. The TIRF footprint of a cell encompasses a large fraction of the total membrane area, whereas the light-sheet samples a much smaller slice. And, all puffs arising in the TIRF footprint will be in focus, whereas interpretation of LLS images is confounded by Ca2+ diffusing from sites either side of the light-sheet; likely explaining why we find that magnitude the single-channel ΔF/Fo signal is less consistent than with TIRF microscopy.
In light-sheet slices through the center of cells we found that many puffs arose at sites located where the nuclear envelope lay close to the plasma membrane. In these cases the Ca2+ fluorescence signal appeared confined between the nuclear and cell membranes, spreading longitudinally, but without spreading into the nucleus. The resolution of the microscope is insufficient for us to discriminate whether Ca2+ was released from sites associated with the plasma or nuclear membranes, but the former possibility is the more likely, because we failed to detect any puffs that clearly arose from regions of the nucleus distant from the plasma membrane. That finding is surprising, because patch clamp recordings from isolated nuclei reveal a high density of functional IP3Rs [28]. As with IP3Rs in the bulk of the ER, it seems that the nuclear IP3Rs may have lower sensitivity to IP3 than those at puff sites.
Our observations reinforce the view that Ca2+ puffs are generated by clusters of IP3R channels that are located at immobile sites adjacent to the plasma membrane, and which constitute only a small fraction of the total number of IP3Rs in the cell [7,18,33–36]. Although the fluorescence signal during puffs extends over one or two microns this results largely from the diffusion of Ca2+-bound indicator, whereas the spread of free Ca2+ ions in the cytosol from a cluster of IP3R channels is predicted to be much narrower [30,37]. The close proximity of puff sites to the plasma membrane thus suggests that puffs – which are preferentially generated at low concentrations of IP3 – serve autonomous, spatially-localized roles to regulate plasmalemmal functions, in addition to their role in triggering propagating, global Ca2+ waves at higher [IP3] (5). Moreover, the location of puff sites adjacent to the plasma membrane would favor their activation by IP3 generated from endogenous cell surface G protein-coupled receptor signaling, even in the face of hindered cytoplasmic diffusion of IP3 [38,39]. The mechanisms by which clusters of IP3Rs in the ER are targeted to specific, stationary sites near the plasma membrane remain unknown. It will be interesting to determine whether these sites correspond to the ER/plasmalemmal junctions initially identified by electron microscopy [40], and how puff sites may relate to the punctae where STIM1 molecules in the ER membrane interact with Orai channels in the plasma membrane to mediate store-operated Ca2+ entry [36,41].
Supplementary Material
Highlights.
A simplified, inexpensive lattice light-sheet microscope is described.
The microscope images local Ca2+ puffs in 4D with high spatio-temporal resolution.
Ca2+ puffs arise in close (sub-micron) proximity to the plasma membrane.
Acknowledgments
We thank Dr. Jeff Lock for help with preparing cells. This work was supported by National Institutes of Health grants GM 048071, GM 065830 (I.P.), and F31 GM119330 (K.L.E.).
Footnotes
Disclosures
The authors declare they have no competing financial interests.
Author contributions
I.P. constructed the LLS microscope and directed the study. K.E. wrote software for microscope control and image processing and analysis. Both authors performed experiments, analyzed data and wrote the manuscript. Both authors have read and approve the published manuscript.
conflict of interest
The authors declare they have no competing financial interests.
Publisher's Disclaimer: This is a PDF file of an unedited manuscript that has been accepted for publication. As a service to our customers we are providing this early version of the manuscript. The manuscript will undergo copyediting, typesetting, and review of the resulting proof before it is published in its final citable form. Please note that during the production process errors may be discovered which could affect the content, and all legal disclaimers that apply to the journal pertain.
References
- 1.Berridge MJ. The Inositol Trisphosphate/Calcium Signaling Pathway in Health and Disease. Physiol Rev. 2016;96:1261–1296. doi: 10.1152/physrev.00006.2016. [DOI] [PubMed] [Google Scholar]
- 2.Taylor CW, Prole DL. Ca2+ Signalling by IP3 Receptors. Subcell Biochem. 2012:1–34. doi: 10.1007/978-94-007-3015-1_1. [DOI] [PubMed] [Google Scholar]
- 3.Berridge MJ. Calcium microdomains: Organization and function. Cell Calcium. 2006;40:405–412. doi: 10.1016/j.ceca.2006.09.002. [DOI] [PubMed] [Google Scholar]
- 4.McCarron JG, Chalmers S, Olson ML, Girkin JM. Subplasma membrane Ca2+ signals. IUBMB Life. 2012;64:573–585. doi: 10.1002/iub.1032. [DOI] [PMC free article] [PubMed] [Google Scholar]
- 5.Parker I, Yao Y. Ca2+ transients associated with openings of inositol trisphosphate-gated channels in Xenopus oocytes. J Physiol. 1996;491:663–668. doi: 10.1113/jphysiol.1996.sp021247. [DOI] [PMC free article] [PubMed] [Google Scholar]
- 6.Yao Y, Choi J, Parker I. Quantal puffs of intracellular Ca2+ evoked by inositol trisphosphate in Xenopus oocytes. J Physiol. 1995;482:533–553. doi: 10.1113/jphysiol.1995.sp020538. [DOI] [PMC free article] [PubMed] [Google Scholar]
- 7.Smith IF, Parker I. Imaging the quantal substructure of single IP3R channel activity during Ca2+ puffs in intact mammalian cells. Proc Natl Acad Sci U S A. 2009;106:6404–6409. doi: 10.1073/pnas.0810799106. [DOI] [PMC free article] [PubMed] [Google Scholar]
- 8.Sun XP, Callamaras N, Marchant JS, Parker I. A continuum of InsP3-mediated elementary Ca2+ signalling events in Xenopus oocytes. J Physiol. 1998;509:67–80. doi: 10.1111/j.1469-7793.1998.067bo.x. [DOI] [PMC free article] [PubMed] [Google Scholar]
- 9.Marchant JS, Parker I. Role of elementary Ca(2+) puffs in generating repetitive Ca(2+) oscillations. EMBO J. 2001;20:65–76. doi: 10.1093/emboj/20.1.65. [DOI] [PMC free article] [PubMed] [Google Scholar]
- 10.Grynkiewicz G, Poenie M, Tsien RY. A new generation of Ca2+ indicators with greatly improved fluorescence properties. J Biol Chem. 1985;260:3440–50. [PubMed] [Google Scholar]
- 11.Parker I, Ivorra I. Confocal microfluorimetry of Ca2+ signals evoked in Xenopus oocytes by photoreleased inositol trisphosphate. J Physiol. 1993;461:133–65. doi: 10.1113/jphysiol.1993.sp019506. [DOI] [PMC free article] [PubMed] [Google Scholar]
- 12.Sanderson MJ, Smith I, Parker I, Bootman MD. Fluorescence microscopy. Cold Spring Harb Protoc. 2014;2014 doi: 10.1101/pdb.top071795. pdb.top071795. [DOI] [PMC free article] [PubMed] [Google Scholar]
- 13.Parker I, Callamaras N, Gil Wier W. A high-resolution, confocal laser-scanning microscope and flash photolysis system for physiological studies. Cell Calcium. 1997;21:441–452. doi: 10.1016/S0143-4160(97)90055-5. [DOI] [PubMed] [Google Scholar]
- 14.Parker I, Zang WJ, Wier WG. Ca2+ sparks involving multiple Ca2+ release sites along Z-lines in rat heart cells. J Physiol. 1996;497(Pt 1):31–8. doi: 10.1113/jphysiol.1996.sp021747. [DOI] [PMC free article] [PubMed] [Google Scholar]
- 15.Callamaras N, Parker I. Construction of a confocal microscope for real-time x-y and x-z imaging. Cell Calcium. 1999;26:271–279. doi: 10.1054/ceca.1999.0085. [DOI] [PubMed] [Google Scholar]
- 16.Axelrod D. Total Internal Reflection Fluorescence Microscopy in Cell Biology. Traffic. 2001;2:764–774. doi: 10.1034/j.1600-0854.2001.21104.x. [DOI] [PubMed] [Google Scholar]
- 17.Toomre D, Manstein DJ. Lighting up the cell surface with evanescent wave microscopy. Trends Cell Biol. 2001;11:298–303. doi: 10.1016/s0962-8924(01)02027-x. [DOI] [PubMed] [Google Scholar]
- 18.Keebler MV, Taylor CW. Endogenous signalling pathways and caged-IP3 evoke Ca(2+) puffs at the same abundant immobile intracellular sites. J Cell Sci. 2017:jcs.208520. doi: 10.1242/jcs.208520. [DOI] [PMC free article] [PubMed] [Google Scholar]
- 19.Demuro A, Parker I. “Optical patch-clamping”: single-channel recording by imaging Ca2+ flux through individual muscle acetylcholine receptor channels. J Gen Physiol. 2005;126:179–192. doi: 10.1085/jgp.200509331. [DOI] [PMC free article] [PubMed] [Google Scholar]
- 20.Smith IF, Wiltgen SM, Parker I. Localization of puff sites adjacent to the plasma membrane: functional and spatial characterization of Ca2+ signaling in SH-SY5Y cells utilizing membrane-permeant caged IP3. Cell Calcium. 2009;45:65–76. doi: 10.1016/j.ceca.2008.06.001. [DOI] [PMC free article] [PubMed] [Google Scholar]
- 21.Tomer R, Khairy K, Keller PJ. Light sheet microscopy in cell biology. Methods Mol Biol. 2013;931:123–37. doi: 10.1007/978-1-62703-056-4_7. [DOI] [PubMed] [Google Scholar]
- 22.Chen B-C, Legant WR, Wang K, Shao L, Milkie DE, Davidson MW, Janetopoulos C, Wu XS, Hammer Ja, Liu Z, English BP, Mimori-Kiyosue Y, Romero DP, Ritter AT, Lippincott-Schwartz J, Fritz-Laylin L, Mullins RD, Mitchell DM, Reymann A-C, Bembenek JN, Bohme R, Grill SW, Wang JT, Seydoux G, Tulu US, Kiehart DP, Betzig E. Lattice light-sheet microscopy: Imaging molecules to embryos at high spatiotemporal resolution. Science (80- ) 2014;346 doi: 10.1126/science.1257998. [DOI] [PMC free article] [PubMed] [Google Scholar]
- 23.Ellefsen KL, Settle B, Parker I, Smith IF. An algorithm for automated detection, localization and measurement of local calcium signals from camera-based imaging. Cell Calcium. 2014;56:147–156. doi: 10.1016/j.ceca.2014.06.003. [DOI] [PMC free article] [PubMed] [Google Scholar]
- 24.Lock JT, Ellefsen KL, Settle B, Parker I, Smith IF. Imaging Local Ca2+ Signals in Cultured Mammalian Cells. J Vis Exp. 2015:1–8. doi: 10.3791/52516. [DOI] [PMC free article] [PubMed] [Google Scholar]
- 25.Dargan SL, Parker I. Buffer Kinetics Shape the Spatiotemporal Patterns of IP3-Evoked Ca2+ Signals. J Physiol. 2003;553:775–788. doi: 10.1113/jphysiol.2003.054247. [DOI] [PMC free article] [PubMed] [Google Scholar]
- 26.Lock JT, Parker I, Smith IF. Cell Calcium A comparison of fluorescent Ca 2 + indicators for imaging local Ca 2 + signals in cultured cells. Cell Calcium. 2015;58:638–648. doi: 10.1016/j.ceca.2015.10.003. [DOI] [PMC free article] [PubMed] [Google Scholar]
- 27.Ellefsen KL, Dynes JL, Parker I, Freites J, Tobias D. Spinning-Spot Shadowless TIRF Microscopy. PLoS One. 2015;10:e0136055. doi: 10.1371/journal.pone.0136055. [DOI] [PMC free article] [PubMed] [Google Scholar]
- 28.Mak D-OD, Foskett JK. Inositol 1,4,5-trisphosphate receptors in the endoplasmic reticulum: A single-channel point of view. Cell Calcium. 2015;58:67–78. doi: 10.1016/j.ceca.2014.12.008. [DOI] [PMC free article] [PubMed] [Google Scholar]
- 29.Wiltgen SM, Smith IF, Parker I. Superresolution localization of single functional IP3R channels utilizing Ca2+ flux as a readout. Biophys J. 2010;99:437–446. doi: 10.1016/j.bpj.2010.04.037. [DOI] [PMC free article] [PubMed] [Google Scholar]
- 30.Shuai J, Parker I. Optical single-channel recording by imaging Ca2+ flux through individual ion channels: Theoretical considerations and limits to resolution. Cell Calcium. 2005;37:283–299. doi: 10.1016/j.ceca.2004.10.008. [DOI] [PubMed] [Google Scholar]
- 31.Garland CJ, Bagher P, Powell C, Ye X, Lemmey HAL, Borysova L, Dora KA. Voltage-dependent Ca(2+) entry into smooth muscle during contraction promotes endothelium-mediated feedback vasodilation in arterioles. Sci Signal. 2017;10 doi: 10.1126/scisignal.aal3806. [DOI] [PubMed] [Google Scholar]
- 32.Wiltgen SM, Dickinson GD, Swaminathan D, Parker I. Termination of calcium puffs and coupled closings of inositol trisphosphate receptor channels. Cell Calcium. 2014 doi: 10.1016/j.ceca.2014.06.005. [DOI] [PMC free article] [PubMed] [Google Scholar]
- 33.Smith IF, Wiltgen SM, Shuai J, Parker I. Ca(2+) puffs originate from preestablished stable clusters of inositol trisphosphate receptors. Sci Signal. 2009;2:ra77. doi: 10.1126/scisignal.2000466. [DOI] [PMC free article] [PubMed] [Google Scholar]
- 34.Parker I, Smith IF. Recording single-channel activity of inositol trisphosphate receptors in intact cells with a microscope, not a patch clamp. J Gen Physiol. 2010;136:119–27. doi: 10.1085/jgp.200910390. [DOI] [PMC free article] [PubMed] [Google Scholar]
- 35.Smith IF, Swaminathan D, Dickinson GD, Parker I. Single-molecule tracking of inositol trisphosphate receptors reveals different motilities and distributions. Biophys J. 2014;107:834–45. doi: 10.1016/j.bpj.2014.05.051. [DOI] [PMC free article] [PubMed] [Google Scholar]
- 36.Thillaiappan NB, Chavda AP, Tovey SC, Prole DL, Taylor CW. Ca2+ signals initiate at immobile IP3 receptors adjacent to ER-plasma membrane junctions. Nat Commun. 2017;8:1505. doi: 10.1038/s41467-017-01644-8. [DOI] [PMC free article] [PubMed] [Google Scholar]
- 37.Wang SQ, Song LS, Lakatta EG, Cheng H. Ca2+ signalling between single L-type Ca2+ channels and ryanodine receptors in heart cells. Nature. 2001;410:592–596. doi: 10.1038/35069083. [DOI] [PubMed] [Google Scholar]
- 38.Dickinson GD, Ellefsen KL, Dawson SP, Pearson JE, Parker I. Hindered cytoplasmic diffusion of inositol trisphosphate restricts its cellular range of action. 2016 doi: 10.1126/scisignal.aag1625. [DOI] [PMC free article] [PubMed] [Google Scholar]
- 39.Taylor CW, Konieczny V. IP 3 receptors: Take four IP 3 to open. Sci Signal. 2016;9:2–6. doi: 10.1126/scisignal.aaf6029. [DOI] [PMC free article] [PubMed] [Google Scholar]
- 40.Okeke E, Dingsdale H, Parker T, Voronina S, Tepikin AV. Endoplasmic reticulum-plasma membrane junctions: structure, function and dynamics. J Physiol. 2016;594:2837–2847. doi: 10.1113/JP271142. [DOI] [PMC free article] [PubMed] [Google Scholar]
- 41.Amcheslavsky A, Wood ML, Yeromin AV, Parker I, Freites JA, Tobias DJ, Cahalan MD. Molecular biophysics of Orai store-operated Ca2+ channels. Biophys J. 2015;108:237–46. doi: 10.1016/j.bpj.2014.11.3473. [DOI] [PMC free article] [PubMed] [Google Scholar]
Associated Data
This section collects any data citations, data availability statements, or supplementary materials included in this article.


