Abstract
The US medical workforce is facing an impending physician shortage. This shortage holds special concern for pathologists, as many senior practitioners are set to retire in the coming years. Indeed, studies indicate a “pathologist gap” may grow through 2030. As such, it is important to understand current and future trends in US pathology. One key factor is graduate medical education. In this study, we analyzed data from the Accreditation Council of Graduate Medical Education, to determine the change in pathology graduate medical education programs and positions, from 2001 to 2017. We found that pathology programs and positions have increased since the 2001 to 2002 academic year, even after adjusting for population growth. However, this increase is much lower than that of total graduate medical education. Furthermore, many pathology subspecialties have declined in population-adjusted levels. Other subspecialties, such as selective pathology, have grown disproportionately. Our findings may be valuable for understanding the state of US pathology, now and in the future. They imply that more resources—or technological innovations—may be needed for specific pathology programs, in hopes of closing the pathologist gap for both this specialty and its subspecialties.
Keywords: fellowship, graduate medical education, pathology, physician trends, residency
A looming US physician shortage has special concern for those in pathology.1,2 With many senior pathologists expected to retire in the coming years, a “pathologist gap” is likely to increase through 2030.2 As such, attention must be paid to the graduate medical education (GME) of future pathologists. However, limited literature exists on recent changes in pathology GME programs and positions. The present study addresses this limitation by analyzing quantitative trends in pathology GME programs and filled positions between 2001 to 2002 and 2016 to 2017. The insights gathered may help evaluate current and past predictions and contextualize the current outlook for US pathologists.
In order to analyze recent trends in pathology GME programs, we accessed the Accreditation Council of Graduate Medical Education (ACGME) Data Resource Book.3 We recorded the yearly quantity of ACGME-accredited pathology specialty and subspecialty programs between academic years 2001 to 2002 and 2016 to 2017. The quantity of on-duty residents and fellows (labeled “filled positions” for simplicity) was also documented. Only the “Pathology—Anatomical and Clinical” (AP/CP) specialty and direct subspecialties (as categorized by the ACGME) were included. For labeling purposes, AP/CP includes the sum of AP + CP, AP-only, and CP-only programs and filled positions.
Population data from the US Census Bureau were used to adjust for population growth. When making such adjustments, we took the percent population growth between 2001 to 2017 and multiplied this by a given 2001 to 2002 GME quantity (eg, number of neuropathology programs). This product was then added to the original 2001 to 2002 quantity, giving the expected 2016 to 2017 quantity (in this case, expected number of neuropathology programs). The expected quantity was then subtracted from the corresponding actual 2016 to 2017 quantity (from ACGME). Finally, the actual–expected difference was divided by the actual quantity, and this quotient was multiplied by 100 to yield the population-adjusted percent change from 2001 to 2017. All data were organized and analyzed in Microsoft Excel (Microsoft Excel for Office 365, version 1711; Microsoft Corporation, Redmond, Washington). This study was not required for review by the Stanford University institutional review board.
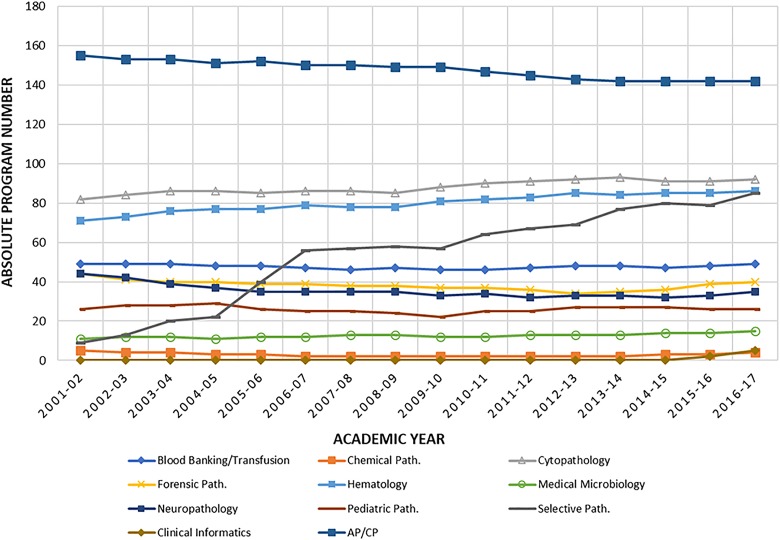
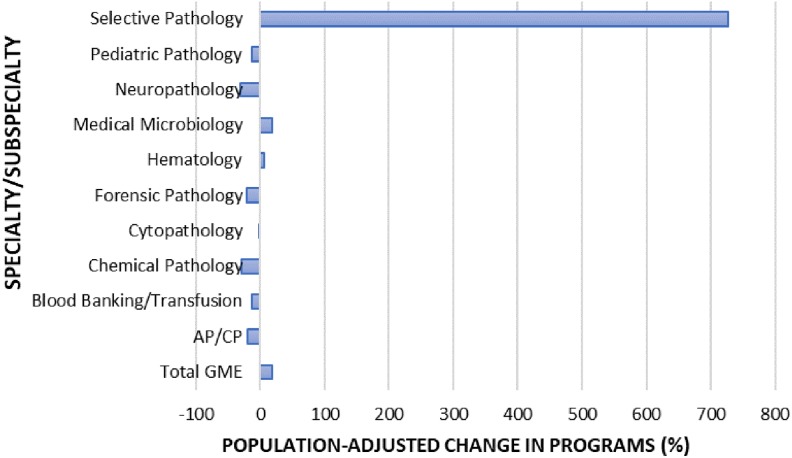
Between the 2001 to 2002 and 2016 to 2017 academic years, total GME rose from 7838 to 10 672 programs. Accounting for the 14% US population growth across the same period, this was an increase of approximately 19%. In contrast, 4 pathology specialties and subspecialties declined in absolute program number: AP/CP (−13), chemical pathology (−1), forensic pathology (−4), and neuropathology (−9; Figure 1). Among the 3 pathology subspecialties which increased in both absolute and population-adjusted programs, selective pathology saw the greatest growth, from 9 to 85 programs (population-adjusted change = 727%; Figures 1 and 2). Hematology (71-86, 6.1%) and medical microbiology (11-15, 19.4%) were the others to increase in both absolute and adjusted program availability.
Figure 1.
Absolute number of Accreditation Council of Graduate Medical Education (ACGME)-accredited pathology specialty and subspecialty programs, 2001 and 2002 to 2016 and 17. Anatomical and clinical pathology (AP/CP) category represents sum of AP + CP, AP-only, and CP-only residency programs. Data were sourced from the ACGME Data Resource Book. Data organization and analysis were done in Microsoft Excel, version 1711.
Figure 2.
Percentage change in Accreditation Council of Graduate Medical Education (ACGME)-accredited pathology specialty and subspecialty programs, 2001 and 2002 to 2016 and 2017. Anatomical and clinical pathology (AP/CP) category represents sum of AP + CP, AP-only, and CP-only residency programs. Data were sourced from the ACGME Data Resource Book. Data organization and analysis were done in Microsoft Excel, version 1711. Population-adjustment calculation is described in text.
In total, pathology GME programs grew by just 2.2% after population adjustment. In fact, 7 of 10 ACGME-accredited pathology specialties and subspecialties declined in their population-adjusted program numbers. These included AP/CP (−19.8%), blood banking/transfusion (−12.4%), chemical pathology (−29.9%), cytopathology (−1.72%), forensic pathology (−20.4%), neuropathology (−30.3%), and pediatric pathology (−12.4%; Figure 2).
Total filled GME positions between 2001 and 2017 mirrored the trend in total GME programs, rising from 96 416 to 129 720 filled positions (population-adjusted growth = 17.8%). However, pathology-specific filled positions increased by just 8.4% after population adjustment.
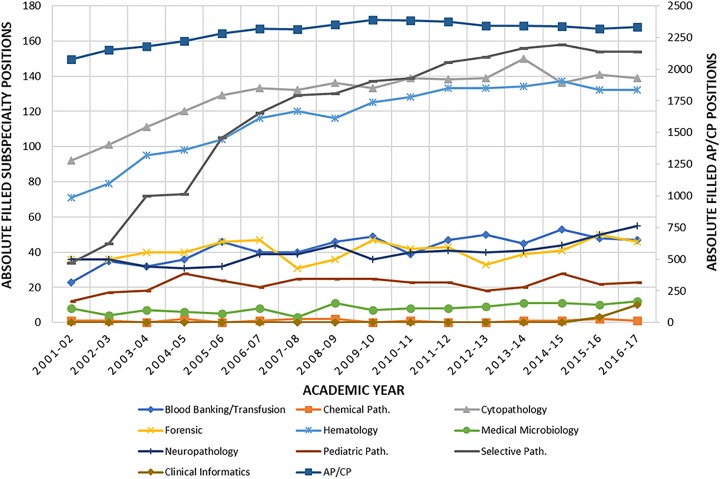
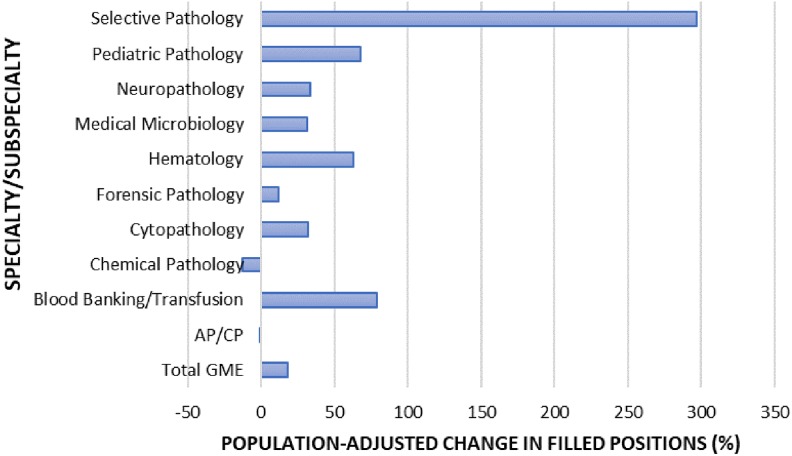
Within pathology, 8 of 9 subspecialties grew in their absolute number of filled positions (there were 3 clinical informatics positions in 2015 to 2016, increasing to 10 in 2016 to 2017; Figure 3). The core specialty (AP/CP) grew from 2075 to 2334 filled positions between 2001 to 2002 and 2016 to 2017, and chemical pathology remained at 1 filled position (range = 0-2). Among the subspecialties which grew in filled positions, all 7 which had been ACGME-accredited since 2001 to 2002 also grew by over 10% after population adjustment: blood banking/transfusion (79.0%), cytopathology (32.3%), forensic pathology (11.9%), hematology (62.8%), medical microbiology (33.8%), pediatric pathology (67.9%), and selective pathology (297%; Figures 3 and 4). Although AP/CP did increase in filled positions between 2001 to 2002 and 2016 to 2017, its population-adjusted levels remained similar (−1.7%). And while chemical pathology positions remained constant in absolute number, the subspecialty yielded a population-adjusted decrease of 12.4% (Figure 4).
Figure 3.
Absolute number of positions filled in Accreditation Council of Graduate Medical Education (ACGME)-accredited pathology specialty and subspecialty programs, 2001 and 2002 to 2016 and 2017. Anatomical and clinical pathology (AP/CP) category represents sum of AP + CP, AP-only, and CP-only residency positions. Right-hand side Y-axis values correspond solely to AP/CP positions; left-hand Y-axis corresponds to all subspecialties. Data were sourced from the ACGME Data Resource Book. Data organization and analysis were done in Microsoft Excel, version 1711.
Figure 4.
Percentage change in number of Accreditation Council of Graduate Medical Education (ACGME)-accredited pathology specialty and subspecialty positions filled, 2001 and 2002 to 2016 and 2017. Anatomical and clinical pathology (AP/CP) category represents sum of AP + CP, AP-only, and CP-only residency positions. Data were sourced from the ACGME Data Resource Book. Data organization and analysis were done in Microsoft Excel, version 1711. Population-adjustment calculation is described in manuscript text.
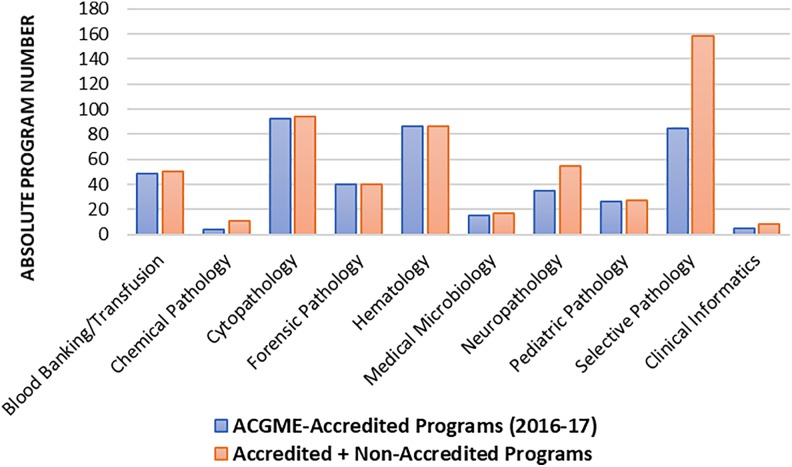
We compared our ACGME-based results with outside data to provide a more holistic view of pathology GME. The Intersociety Council for Pathology Information (ICPI) was the main outside source. The ICPI is a nonprofit organization which collects data pertaining to clinical and academic pathology careers. Its database includes a directory of US pathology subspecialty programs (but no position data), whether they are ACGME-accredited or not.4 According to the database, in 2017, there were 94 cytopathology programs (accredited plus nonaccredited), 50 blood banking/transfusion programs, 27 pediatric pathology programs, 40 forensic pathology programs, 17 microbiology programs, and 55 neuropathology programs. The ICPI database did not contain data regarding most branches of selective pathology and hematology. For these subspecialties, we accessed data from the Pathpedia directory, which indicated a total of 158 selective pathology programs and 86 hematology programs in 2017.5 We then compared the quantity of ACGME-accredited subspecialty programs with the total accredited plus nonaccredited numbers (Figure 5).
Figure 5.
Absolute number of Accreditation Council of Graduate Medical Education (ACGME)-accredited pathology subspecialty programs, compared with accredited plus nonaccredited programs, 2016 and 2017 academic year. Data were sourced from the ACGME Data Resource Book (Accredited), as well as the Intersociety Council for Pathology Information (ICPI) and Pathpedia (nonaccredited). Data organization and analysis were done in Microsoft Excel, version 1711.
These non-ACGME sources suggest that, for most pathology subspecialties, the majority of programs are ACGME accredited (Figure 5). Many subspecialties (such as those within selective pathology) do not have American Board of Pathology (ABP) certifications, so these high accreditation rates may be driven by greater funding opportunities and prestige.6 For selective pathology in particular, a noncomplete ABP/ACGME overlap may explain why, according to our results, 73 of 158 selective pathology programs remain unaccredited (Figure 5). Nonetheless, graduates from ACGME-accredited programs may be more competitive in their pathology careers.6 For example, though there is no ABP certificate for renal pathology, a fellow in this field may increase the probability of securing a future position at a major hospital by enrolling in an ACGME-accredited selective pathology program.
That said, one must note the resource disparity even among ACGME-accredited programs. In selective pathology, for instance, there were accredited 79 programs in 2015 to 2016, with an average (mean) of nearly 8 pathologists on faculty per program. However, the range in faculty per program (1-34) was remarkably wide. The causes and consequences of such disparities almost certainly involve access to funding. As such, we also compared the number of different pathology subspecialty programs offered among US institutions, with respect to research funding. The top 10 pathology departments in total NIH funding awards for 2016 offered an average of 11.3 different subspecialty programs, while those in the bottom 10 offered an average of 3.0 (P < .001).7 This suggests a large national disparity between individual subspecialty programs, in addition to institutional pathology departments in general.
The ACGME-accredited pathology programs have grown in number between 2001 to 2002 and 2016 to 2017, according to our analysis. However, growth is much smaller than that of total GME programs. This comparison holds true for filled GME positions, as the proportional increase in pathology was over 2 times lower than that of total GME. Therefore, while pathology programs and filled positions have increased proportionally to the US population since 2001 to 2002, pathology GME has been outpaced by other specialties.
Across pathology specialties and subspecialties, program and position trends have not paralleled one another. Rather, certain subspecialties (such as selective pathology) have grown tremendously, while others (such as chemical pathology) have not grown at all. These changes reflect prevalent attitudes among young pathologists. Chemical pathology, for example, is relatively unpopular according to surveys of pathology residents.8 On the other hand, surgical pathology and gastrointestinal pathology (which fall under selective pathology) are increasingly popular.9 According to recent studies, young pathologists value marketability and job connections as the highest priorities in choosing a subspecialty.9
Nonetheless, pathology GME positions are still subject to changes in program availability. For example, between 2004 to 2005 and 2005 to 2006, selective pathology nearly doubled from 22 to 40 ACGME-accredited programs. In the same period, selective pathology positions increased from 73 to 105 on-duty residents. This began a continual, significant increase in selective pathology, which had a total of 85 programs and 154 positions in 2016 to 2017. Because many surgical pathology programs are unaccredited, this growth may reflect accreditation of existing programs, as opposed to development of new programs. Of course, program development is itself influenced by multiple factors, including relative interest and available funding.
It is important to note that clinical informatics programs in nonpathology departments are often open to applicants who have completed a pathology residency. Additionally, the ABP is allowing candidates to sit for the Clinical Informatics subspecialty examination using a practice-based pathway (in lieu of training) through 2022.10 Therefore, the total number of pathology residents pursuing some form of training in Clinical Informatics may be greater than presented by the ACGME.11,12 Similarly, the ACGME categorizes dermatopathology as a dermatology subspecialty and molecular genetic pathology as a medical genetics and genomics subspecialty, but there are many fellows in both programs who have completed a pathology residency.
Although we accessed non-ACGME pathology program data using ICPI and Pathpedia, we were unable to quantify the number of accredited plus nonaccredited pathology fellowship positions. Even in databases such as ICPI, where data are available for individual programs, such details rarely include the number of GME positions.
In addition, it is difficult to comprehensively quantify the number of open versus filled ACGME-accredited positions. We have done so for a select group of pathology subspecialties, but a comprehensive list is beyond the scope of this study (future work may address this, by examining each individual program on the ACGME database, where data are presented for open vs filled positions). Chemical pathology programs, for instance, contained a total of 5 available positions in 2016 to 2017, but just 1 filled position. In medical microbiology, there was a similar lack of filled positions: 21 available positions, 10 filled. It is likely that more popular subspecialties, such as selective pathology, have a greater fill rate. Indeed, we accessed data from the National Residency Matching Program to assess fill rate in pathology PGY-1 residency matching.13 In the 2017 Match, there were 600 available US pathology PGY-1 residency positions, and 543 individuals were matched (90% fill rate). As such, it appears that any mention of a “pathologist gap,” if accurate and properly nuanced, must first examine the multifaceted distribution of filled versus vacant pathology GME positions. Certain subspecialties may face shortages, while others continue to grow.
With the Balanced Budget Act of 1997, US congress limited the number of Medicare-funded GME programs and positions. In order to keep up with US population growth and health-care demands, alternative funding sources will have to be utilized.14 This has already been occurring in many hospitals and GME programs.15 Special attention must also be paid to pathology: Over 75% of full-time pathologists are 45 years or older, making this one of the oldest specialties in the United States.2 At first glance, then, greater pathology career interest and funding for pathology GME will be needed to fill any impending pathologist gap.
One might think such a shortage would have to be filled by additional pathologists. But this may not necessarily be true. Considering the broader context, pathology is in the early stages of a paradigm shift—with the burgeoning fields of digital pathology and image analysis promising to improve histologic diagnostics. These technological advances may bolster not only capability but also efficiency for individual pathologists. For example, image analysis of digital pathology slides may obviate the need for human semiquantification of immunohistochemical stains, mitotic figure counts, and other time-consuming practices.16,17 As a result, individual pathologists would be able to address more cases in less time. The portable nature of digital pathology may also allow pathologists to distribute their workloads more evenly across a widespread contingent. For instance, if one clinical group felt overburdened by case volume, case overflow might be sent to pathologists working elsewhere in a low-volume setting. Such technologies and innovations are still in their early stages, but are rapidly evolving. They might greatly benefit this critical specialty, by the time any pathologist gap was felt in US health care. In short, pathology finds itself at an interesting crossroads—where workforce numbers may not be growing fast enough, but where technological and scientific advances may quell much of the resulting alarm. Time will tell if increased funding, career interest, and technological development will rise to meet a growing and aging US population in years to come.
Footnotes
Declaration of Conflicting Interests: The author(s) declared no potential conflicts of interest with respect to the research, authorship, and/or publication of this article.
Funding: The author(s) received no financial support for the research, authorship, and/or publication of this article.
ORCID iD: Aldis H. Petriceks, BA  http://orcid.org/0000-0001-5136-1023
References
- 1. AAMC. Physician supply and demand through 2025: key findings. 2015. https://www.aamc.org/download/426260/data/physiciansupplyanddemandthrough2025keyfindings.pdf. Accessed January 12, 2018
- 2. Robboy SJ, Weintraub S, Horvath AE, et al. Pathologist workforce in the United States: I. Development of a predictive model to examine factors influencing supply. Arch Pathol Lab Med. 2013;137:1723–1732. doi:10.5858/arpa.2013-0200-OA. [DOI] [PubMed] [Google Scholar]
- 3. ACGME Data Resource Book. http://www.acgme.org/About-Us/Publications-and-Resources/Graduate-Medical-Education-Data-Resource-Book. 2017. Accessed January 10, 2018.
- 4. Training Directory. Intersociety Council for Pathology Information, Inc. 2018. http://directory.pathologytraining.org/FellowshipSearch.php. Accessed February 13, 2018.
- 5. Pathology Programs. Pathpedia. 2018. http://www.pathpedia.com/PathTraining/programs.aspx. Accessed February 13, 2018.
- 6. Crawford JM, Hoffman RD, Black-Schaffer WS. Pathology subspecialty fellowship application reform 2007 to 2010. Hum Pathol. 2011;42:774–794. doi:10.1016/j.humpath.2010.08.002. [DOI] [PubMed] [Google Scholar]
- 7. NIH Awards by Location & Organization. National Insitutes of Health. 2016. https://report.nih.gov/award/index.cfm?ot=&fy=2016&state=&ic=&fm=&orgid=&distr=&rfa=&om=n&pid. Accessed February 13, 2018.
- 8. Haidari M, Yared M, Olano JP, Alexander CB, Powell SZ. Attitudes and beliefs of pathology residents regarding the subspecialty of clinical chemistry: results of a survey. Arch Pathol Lab Med. 2017;141:203–208. doi:10.5858/arpa.2015-0547-OA. [DOI] [PubMed] [Google Scholar]
- 9. Lagwinski N, Hunt JL. Fellowship trends of pathology residents. Arch Pathol Lab Med. 2009;133:1431–1436. doi:10.1043/1543-2165-133.9.1431. [DOI] [PubMed] [Google Scholar]
- 10. Clinical Informatics. American Board of Pathology. 2015. http://www.abpath.org/index.php/to-become-certified/requirements-for-certification?id=40. Accessed February 14, 2018.
- 11. Longhurst CA, Pageler NM, Palma JP, et al. Early experiences of accredited clinical informatics fellowships. J Am Med Inform Assoc. 2016;23:829–834. doi:10.1093/jamia/ocv209. [DOI] [PMC free article] [PubMed] [Google Scholar]
- 12. Gilbertson J, McClintock DS, Lee RE, et al. Clinical fellowship training in pathology informatics: a program description. J Pathol Inform. 2012;3:11 doi:10.4103/2153-3539.93893. [DOI] [PMC free article] [PubMed] [Google Scholar]
- 13. 2017 NRMP Main Residency Match®: Match Rates by Specialty and State 2017; 2017. http://www.nrmp.org/main-residency-match-data/. Accessed February 12, 2018.
- 14. Iglehart JK. The residency mismatch. N Engl J Med. 2013;369:297–299. doi:10.1056/NEJMp1306445. [DOI] [PubMed] [Google Scholar]
- 15. Mullan F, Salsberg E, Weider K. Why a GME squeeze is unlikely. N Engl J Med. 2015;373:2397–2399. doi:10.1056/NEJMp1511707. [DOI] [PubMed] [Google Scholar]
- 16. Robertson S, Azizpour H, Smith K, Hartman J. Digital image analysis in breast pathology—from image processing techniques to artificial intelligence [published online ahead of print November 17, 2017]. Transl Res. 2017. doi:10.1016/j.trsl.2017.10.010. [DOI] [PubMed] [Google Scholar]
- 17. Yoshida H, Yamashita Y, Shimazu T, et al. Automated histological classification of whole slide images of colorectal biopsy specimens. Oncotarget. 2017;8:90719–90729. doi:10.18632/oncotarget.21819. [DOI] [PMC free article] [PubMed] [Google Scholar]


