Abstract
Objectives
In this study, we present a fully-automated and robust self-navigated approach to obtain 4D motion-resolved images during free breathing.
Materials and Methods
The proposed method, Consistently-Acquired Projections for TUned and Robust Estimation (CAPTURE), is a variant of the stack-of-stars gradient-echo sequence. A 1D navigator was consistently acquired at a fixed azimuthal angle for all stacks of spokes in order to reduce non-physiological signal contamination due to system imperfections. The resulting projections were then ‘tuned’ using complex phase rotation in order to adapt to scan-to-scan variations, followed by the detection of the respiratory curve. 4D motion-corrected and uncorrected images were then reconstructed via respiratory and temporal binning, respectively.
This HIPAA-compliant study was performed with Institutional Review Board approval. A phantom experiment was performed using a custom-made deformable motion phantom with an adjustable frequency and amplitude. For in vivo experiments, ten healthy participants and twelve liver tumor patients provided informed consent and were imaged with the CAPTURE sequence.
Two radiologists, blinded to which images were motion-corrected and which were not, independently reviewed the images, and scored image quality using a 5-point Likert scale.
Results
In the respiratory motion phantom experiment, CAPTURE reversed the effects of motion blurring and restored edge sharpness from 36% to 78% of that observed in the images from the static scan.
Despite large intra- and inter-subject variability in respiration patterns, CAPTURE successfully detected the respiratory motion signal in all participants and significantly improved the image quality according to the subjective radiological assessments of two raters (p<0.05 for both raters) with a 1 to 2-point improvement in the median Likert scores across the whole set of participants. Small lesions (<1 cm in size) which might otherwise be missed on uncorrected images due to motion blurring were more clearly depicted on the CAPTURE images.
Conclusions
CAPTURE provides a robust and fully-automated solution for obtaining 4D motion-resolved images in a free-breathing setting. With its unique tuning feature, CAPTURE can adapt to large inter-subject and inter-scan variations. CAPTURE also enables better lesion delineation due to improved image sharpness, thereby increasing the visibility of small lesions.
Keywords: Self-navigated, Motion correction, Complex phase rotation, Gradient delay
Introduction
In the magnetic resonance imaging (MRI) of the body, respiratory motion has a negative impact on diagnosis, treatment planning and therapeutic monitoring. Breathholding is often used in clinical practice1. However, breathholds typically last only tens of seconds, limiting spatial coverage and image quality. Breathholding can also be extremely difficult for some patients. In this respect, free-breathing MRI is highly desirable.
All free-breathing methods require a means of tracking respiratory motion. External devices such as respiratory bellows2 and fiber optic sensors3 can be used. However, the performance of respiratory bellows can be negatively impacted by the location of the bellows as well as by respiratory drift and large diaphragmatic excursion4, while fiber optic sensors are fragile and expensive5. The issues with external devices can be circumvented by MR acquisition-based strategies.
Navigator echoes are additional scans interleaved with the actual imaging scans, and serve to track the position of the object being imaged6,7. Nevertheless, the additional radiofrequency (RF) excitation associated with the navigator echo degrades image quality as it disturbs the magnetization in the anatomic region of interest. Due to these limitations, inferring the respiratory state directly from the imaging data (i.e. self-navigation) would be more preferable.
Various self-navigated retrospective re-binning schemes have been previously proposed. Image-based self-navigation using low-resolution images8,9 requires manual delineation of a region-of-interest (ROI) passing through the lung-liver interface, whereas automated methods are generally more desirable. Radial acquisitions offer the option of self-navigation since they frequently sample the center of k-space, where the acquired signal can show motion-related fluctuations10–13. One-dimensional (1D) navigators extracted from the imaging k-space data have also been employed for the self-navigated tracking of respiratory motion14–16. However, the k-space trajectories can be shifted away from their presumed locations due to gradient system imperfections, such as gradient delays and eddy currents17. These gradient imperfections can thus severely contaminate the self-navigation signal. Therefore, an acquisition scheme that is less prone to the adverse effects of these imperfections is highly desirable.
Due to inter-subject variability as well as variations in physical scanning conditions, the usual ways of working with complex navigator data such as taking real parts or magnitudes do not result in a robust method that successfully detects respiratory motion in all cases18. A more generalized detection framework is needed.
In this study, we present a self-navigated, fully-automated, free-breathing approach, termed as Consistently-Acquired Projections for Tuned and Robust Estimation (CAPTURE). Our method is robust to gradient imperfections and can adapt to inter-subject and inter-scan variations. Deformable motion phantom experiments as well as in vivo experiments on healthy participants and liver tumor patients were performed to test if CAPTURE can detect respiratory motion reliably in all of these vastly different cases.
Materials and Methods
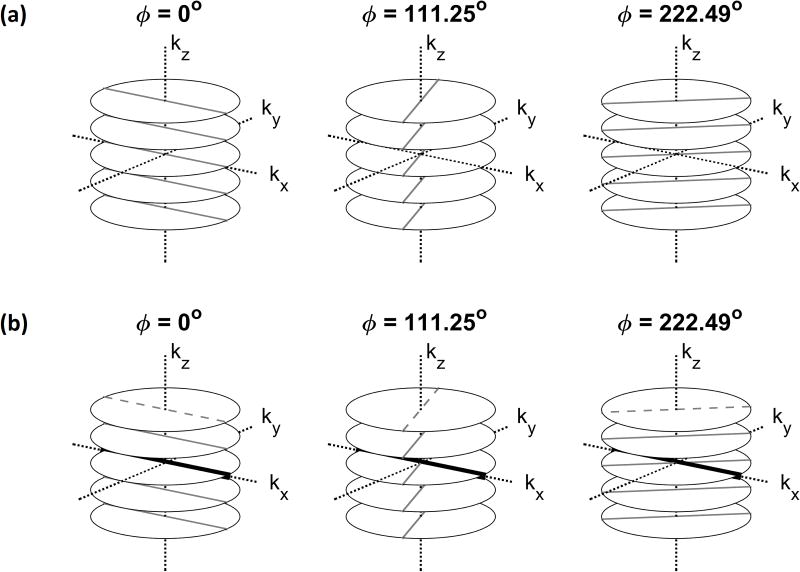
A T1-weighted stack-of-stars spoiled 3D gradient-echo sequence with fat suppression has been previously proposed for motion correction11,19. Figure 1a illustrates this sequence. The partition (kz) encoding is Cartesian, whereas the in-plane (kx−ky) acquisition is radial with a constant azimuthal increment of Δϕ =111.25°; this increment provides an almost uniform in-plane coverage during any arbitrary scan duration20,21. This in-plane acquisition scheme has also been referred to as “golden-angle radial sampling” in the literature15,22. At each azimuthal angle, a stack of spokes is acquired by applying different levels of partition encoding.
Figure 1.
Acquisition scheme for a conventional 3D Golden-angle stack-of-stars sequence (a) and CAPTURE (b). In CAPTURE, the dashed spokes were replaced with the navigators shown by thick black lines. In this example, the navigators are always acquired at the same azimuthal angle [0°] such that they experience similar gradient delays and eddy currents.
Difficulty with the original stack-of-stars sequence: Spectral contamination
As Figure 1a depicts, all stacks of spokes share a common point: the k-space center. In theory, this point is expected to show signal fluctuations exclusively due to respiratory motion, and hence can be used as a point navigator for deriving respiratory motion10,11,18. However, in practice, respiratory motion is not the only source of signal fluctuations at the k-space center, as gradient delays and eddy currents can significantly contaminate the spectrum of the point navigator23. Furthermore, this contamination is a function of the temporal order of the azimuthal angles in the acquisition24. Thus, golden-angle radial sampling contains numerous pseudo-periodicities, leading to physiologically irrelevant spectral peaks that can easily interfere with the respiratory spectral content.
Proposed solution: Consistency in navigator direction and a novel detection scheme
CAPTURE has two major components:
1. Consistently-Acquired Projections [CAP-]
As depicted in Figure 1b, CAPTURE is a variant of the stack-of-stars sequence, in which a navigator spoke along the kx-axis replaces the first spoke in each stack. Based on the projection-slice theorem, the inverse FT of this navigator yields a projection of all transverse magnetization onto the x-axis. In this study, the x-axis was chosen to be parallel to the superior-inferior (SI) axis, which is the axis of largest displacement for respiratory motion25. Since these navigators are always acquired at the same azimuthal angle, the gradient delays associated with them are expected to be the same26. In order to observe the spectral improvement achieved by this acquisition consistency, the spectrum of the CAPTURE-detected curve was compared with that of the point navigator signal11, which is contaminated by the angle-dependent variations described above.
2. Tuned and Robust Estimation [-TURE]
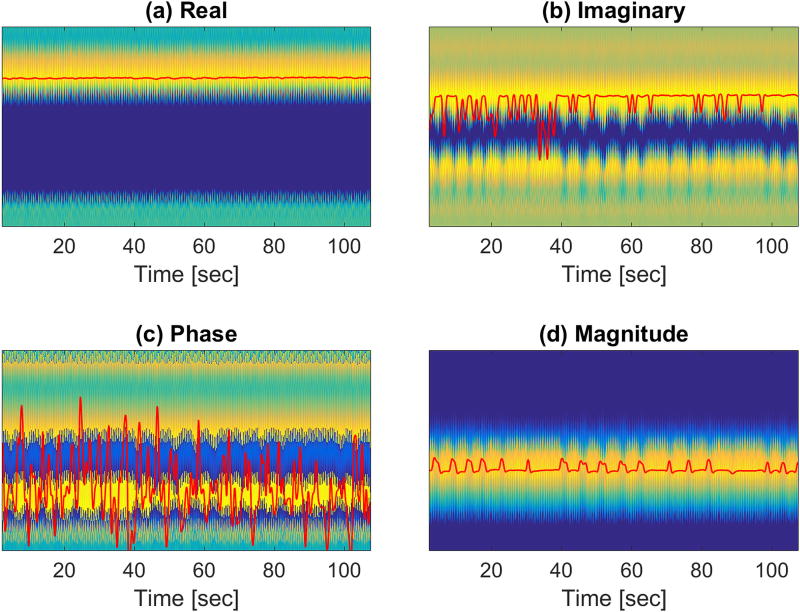
Magnetic field drift, background field inhomogeneity, and variations in receiver coil sensitivity profiles can lead to large inter-subject and inter-scan variability in the navigator signal. As a result, developing a fully-automated scheme that detects respiratory motion in all cases is challenging. It has been previously reported that the real parts, the imaginary parts, the magnitudes, and the phases of the projections, as well as the sum of the projection magnitudes, are not adequate to devise a detection scheme that works in all cases18. Our experience has confirmed this assertion. Figure 2 shows the detection results obtained by using various functions of the projections for one of the receiver coils. Possibly due to the aforementioned factors that change from scan to scan, none of these functions yielded a reasonable respiration curve. In order to overcome this difficulty, we devised the following detection scheme that can adapt to inter-subject and inter-scan variability by ‘tuning’ the phase of the projections. Figure 3 illustrates the process of signal ‘tuning’, which is detailed below:
Figure 2.
Maximum detection using (a) real and (b) imaginary parts, as well as (c) phase and (d) magnitude, of the complex projections. The red curves were obtained by filtering the maximum detection results with a low-pass filter with a 1 Hz cutoff frequency. None of these schemes could capture the underlying respiratory content.
Figure 3.
Complex signal tuning scheme. Four representative phase rotations for a chosen coil [Coil 3] are depicted. In (a), the x-axis, the y-axis and the color-axis represent time, navigator axis, and the signal intensity of , respectively. The derived unfiltered respiratory curves [overlaid curves in (a)] are also provided. The frequency spectra and their corresponding temporospectral quality metric values for the four representative phase rotations are shown in (b) and (c), respectively. In this example, the optimal phase rotation angle, which provided the highest temporospectral quality metric value, was found to be 259.2°.
The first 10 stacks of spokes were discarded to ensure steady-state conditions.
In order to reduce noise, the navigator k-space data were apodized using a Hamming window. After a 1D inverse FT, the resulting complex projections from all stacks of spokes received through Coil were placed as columns of a 2D matrix, , where is the index for the physical locations on the SI axis and is the stack-of-spokes index or, equivalently, the discrete time index.
A ‘tuning’ process was then performed by phase-rotating ’s over the full phase range, (0,360°], via 100 different complex scalar multiplications , where with . Four representative phase rotations are demonstrated in Figure 3. For each , a respiratory curve was obtained by detecting the location of the peak along each column of , where is the real part operator. The four illustrations of and corresponding to the four phase rotation angles and for Coil 3 are shown in Figure 3a.
The detected respiratory curves, , were Fourier-transformed, yielding . Examples of are shown in Figure 3b.
-
A temporospectral quality metric was then defined:
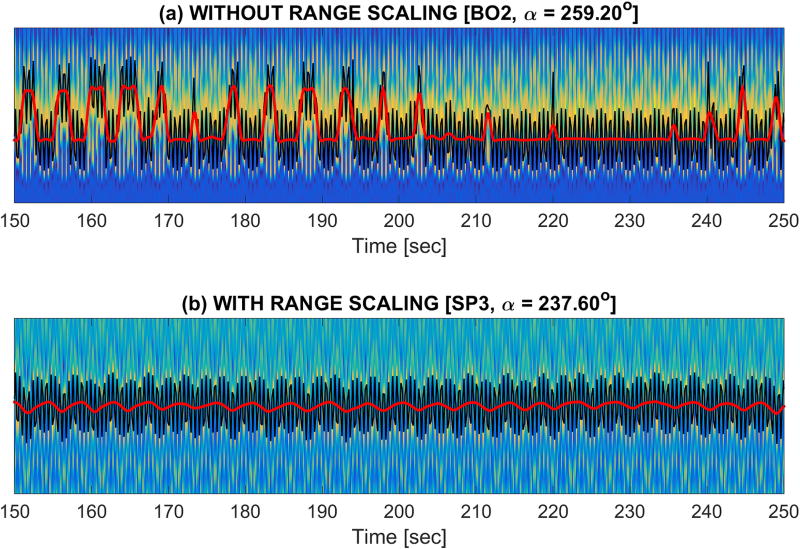
The first term in the product favors respiratory content over system-related spectral contamination, whereas the second term penalizes the peak-to-trough range of the detected curve. Figure 4 illustrates the importance of this second term, i.e. the range term. The motivation is as follows: For a number of tuning angles, parts of the respiratory curve can appear on spatially separated bands. The abrupt signal changes observed in these cases can lead to spectral leakage into the respiratory range of frequencies, misleading the detection procedure. The second term penalizes these problematic abrupt changes, promoting only truly respiratory curves.[Equation 1] Figure 3c shows values as a function of phase rotations.
- Finally, the best coil and phase-rotation were chosen according to:
[Equation 2]
Figure 4.
Importance of range scaling. If the range of the signal is not penalized (a), the detection algorithm may select a curve with non-physiological abrupt changes that can introduce a large amount of spectral leakage into the respiratory band. However, if the range is penalized (b), this spectral leakage is prevented, and the algorithm will instead favor curves reflecting the true respiratory content.
A low-pass filter with a cut-off frequency of 1 Hz was used for removing physiologically irrelevant contamination. In order to avoid filtering-related distortion, Savitzky-Golay filtering output was used for replacing the samples at the two ends. The resulting respiratory curve was used for sorting the data into 10 respiratory bins, each with an equal number of spokes.
Importance of phase tuning
In order to demonstrate the importance of phase tuning, respiratory curve detection was performed by using the real part of the complex projections without any tuning and the result was compared to the tuned detection of CAPTURE.
Experiments
All experiments were performed on a simultaneous PET/MRI scanner with 3T field strength (Siemens Biograph mMR [VB20P]; Siemens Healthcare, Erlangen, Germany).
1. Phantom experiments
A respiratory motion phantom (Chest-R) was built using a Harvard Apparatus Large Animal Respiration Pump (Model 607) with an adjustable frequency and amplitude. Chest-R contained a balloon immersed in sodium polyacrylate gel. The balloon was inflated and deflated by the pump. Three different motion frequencies [corresponding to 10, 20 and 30 rpm] and two air volumes [400 cc and 600 cc] were tested. Static imaging was also performed to obtain the ideal image sharpness at the air-gel interface.
The CAPTURE acquisition parameters were as follows: TE/TR = 1.99 ms/3.84 ms, matrix size = 320 × 320, field of view (FOV) = 240 mm × 240 mm, slab thickness = 163.2 mm, number of partitions = 48, partial Fourier factor = 6/8, reconstructed slices per slab = 96 (yielding a slice thickness of 1.7 mm). The resulting voxel size for the phantom study was 0.75 × 0.75 × 1.7 mm3.
2. Human experiments
This Health Insurance Portability and Accountability Act (HIPAA)-compliant study was performed after the approval of our Institutional Review Board. Both healthy volunteers and liver tumor patients were recruited between November 1, 2016 and May 24, 2017, and all participants provided written informed consent. No data were excluded in our analysis.
All participants were imaged in the head-first supine position. A flex body coil with two elements (BO1-2) was placed anteriorly over each participant, and a spine coil with multiple elements (SP1-8) was positioned posteriorly in the patient table. A total of 3 or 4 spine coil elements was automatically selected by the MR scanner to achieve sufficient coverage of the user-specified imaging volume.
2.a. Healthy volunteer experiments
Ten healthy volunteers (median age [interquartile range] in years: 29 [24, 33], all males) were scanned in coronal, sagittal and transversal orientations.
The CAPTURE acquisition parameters were as follows: TE/TR = 1.69 ms/3.54 ms, matrix size = 320 × 320, FOV = 360 mm × 360 mm, slab thickness = 288 mm, number of partitions = 48, partial Fourier factor = 6/8 (giving a temporal resolution of 153.52 ms for the navigator), reconstructed slices per slab = 96 (yielding a slice thickness of 3 mm). The resulting voxel size was 1.125 × 1.125 × 3 mm3. The number of azimuthal angles was 2000, resulting in a total acquisition time of 5 minutes and 7 seconds.
Moreover, in order to explain why phase tuning works, we performed two scans using single-slice gradient recalled echo (GRE) sequences on one healthy volunteer. The acquisitions were sagittal with the readout axis lying along the SI axis of the subject. The first GRE protocol was as follows: TE/TR = 3.1 ms/5.6 ms, slice thickness = 3 mm, matrix size = 192×126, in-plane resolution = 1.56×1.56 mm, number of sequence repetitions = 500, total scan time = 67 seconds. Generalized autocalibrating partially parallel acquisitions (GRAPPA)27 was used for accelerating the acquisition (acceleration factor R=2) so that each image could be acquired in 134.4 ms, making it possible to observe the liver’s motion during respiration. The second GRE protocol was the same as the first one except that the slice thickness was set to 250 mm. This thick excitation yielded the projection of the signals in a large spatial region onto the sagittal plane. The thick-slice acquisition was therefore useful for mimicking the projections used by CAPTURE, while the thin-slice acquisition provided a better visualization of the liver’s anatomical location along the SI axis. Both sets of GRE scans were reconstructed into complex images for each receiver channel and phase tuning was applied to observe the variations in the signal intensities. The SI projections that would mimic the projections of CAPTURE were obtained by taking the inverse FT of the central k-space lines of the thick-slice GRE data after apodization. Only the data from the middle spine coil element is going to be shown for brevity.
2.b. Liver tumor patient experiments
Twelve patients (median age [interquartile range] in years: 59.5 [56, 66.5], four females) with various liver tumors were recruited. Six patients had primary hepatic malignancies while the other six had metastatic disease from an extrahepatic primary (cf. Table 2).
Table 2.
Age, gender, CAPTURE-detected dominant respiratory frequency (i.e., the location of the peak within [0.1, 0.5] Hz in the spectrum of the detected curve), and measured end-inspiration to end-exhalation motion range of liver dome in motion-resolved images of CAPTURE for liver tumor patients. The median respiratory frequency was 0.26 Hz (interquartile range: 0.22–0.30 Hz).
| Age [y] | Gender | Diagnosis | Respiration Freq. [Hz] | Motion Range [mm] | |
|---|---|---|---|---|---|
| Patient 1 | 56 | M | Metastatic disease (colorectal cancer) | 0.35 | 23.6 |
| Patient 2 | 61 | M | Hepatocellular carcinoma | 0.21 | 19.1 |
| Patient 3 | 66 | M | Hepatocellular carcinoma | 0.26 | 12.4 |
| Patient 4 | 35 | F | Metastatic disease (colorectal cancer) | 0.19 | 10.1 |
| Patient 5 | 67 | F | Metastatic disease (colorectal cancer) | 0.34 | 10.4 |
| Patient 6 | 57 | M | Hepatocellular carcinoma | 0.27 | 11.2 |
| Patient 7 | 74 | M | Hepatocellular carcinoma | 0.14 | 34.9 |
| Patient 8 | 72 | M | Hepatocellular carcinoma | 0.26 | 12.4 |
| Patient 9 | 58 | M | Hepatocellular carcinoma | 0.46 | 24.8 |
| Patient 10 | 56 | F | Metastatic disease (breast cancer) | 0.26 | 10.1 |
| Patient 11 | 55 | F | Metastatic disease (neuroendocrine carcinoma) | 0.22 | 16.9 |
| Patient 12 | 61 | M | Metastatic disease (ocular melanoma) | 0.24 | 14.6 |
All images for the liver tumor patients were acquired in the sagittal plane with the same parameters used for the healthy volunteers, except for an increase in the number of slices (for greater spatial coverage) in several patients and a higher in-plane resolution (0.8 mm rather than 1.125 mm) in one patient. Depending on the acquisition parameters, the temporal resolution of the navigator ranged from 153.52 ms to 189.10 ms. The scan of one patient was terminated earlier than planned due to miscommunication, and hence only 82% of the data were acquired. Nevertheless, this partial dataset was still included in our analysis as the image quality was not substantially affected by the missing spokes.
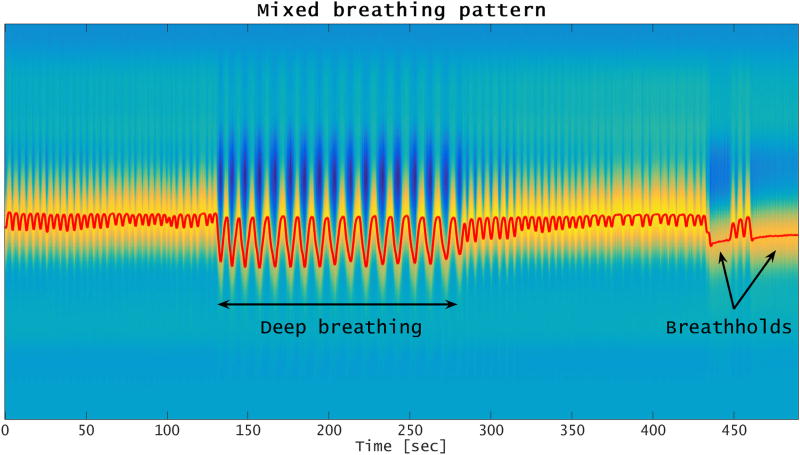
Since some patients may change their breathing patterns significantly during an MR imaging session, we also examined if CAPTURE can successfully detect respiratory motion in such cases. For this purpose, one of the ten healthy volunteers was asked, in a separate experiment, to intentionally change his breathing pattern (so as to include deep breathing and breathholding) during image acquisition. However, only the images from his normal breathing experiment were included in the radiological review.
Reconstruction
The imaging data were first inverse Fourier-transformed along the partition encoding direction in order to enable slice-by-slice processing. A reconstruction approach with a motion smoothness constraint similar to that of the XD-GRASP approach15 and a spatial smoothness constraint28,29, was then applied to each slice to reconstruct 10 respiratory phase images. By binning the same k-space data into 10 consecutive temporal (rather than physiological) bins, motion-uncorrected images having the same SNR as the CAPTURE-reconstructed images were also obtained for a direct comparison.
Performance evaluation in phantom
Line profiles across the air-gel interface were used to assess performance. Apparent slopes, which served as a metric for motion correction adequacy, were measured by using a line across the air-gel interface.
Performance evaluation in vivo
Motion-corrected and uncorrected images were placed side-by-side in a pairwise fashion with left-right randomization for each participant. Two radiologists, who were blinded to the corrected versus uncorrected datasets, reviewed the images independently using a Likert scale of 1–5 [1-Very blurry, 2-Blurry, 3-Intermediate, 4-Sharp, 5-Very sharp]. The radiologists assessed the largest liver finding (for liver tumor patients only), the largest portal vein (for both healthy volunteers and liver tumor patients), and the lung-liver interface (for both healthy volunteers and liver tumor patients). For each rater, changes in image quality were statistically assessed by using the signed rank test.
Results
Improvement in spectral quality
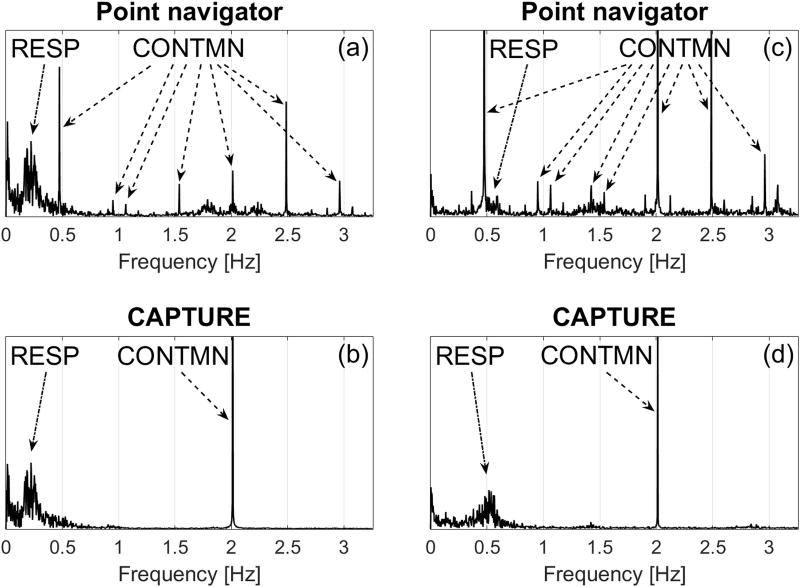
Figure 5 compares the spectra obtained by the k-space center point navigator versus CAPTURE for two different participants. The point navigator spectra are severely contaminated due to system imperfections such as gradient delays and eddy currents. This contamination generated numerous artificial signal peaks at frequencies ranging from 0.5 to 3 Hz (Figure 5a and 5c). Since the signal contamination located near 0.5 Hz is within or close to the physiological respiratory frequency range, it is extremely challenging to remove this contamination without distorting the true respiratory signal. If the participant has a low primary respiratory frequency (e.g., Healthy Volunteer 3), the signal contamination may be removed using a low-pass filter with a cutoff frequency between the primary respiratory frequency and 0.5 Hz (Figure 5a). However, if the primary respiratory frequency is high (e.g., Healthy Volunteer 1), the separation of respiratory content and signal contamination using conventional filtering techniques becomes impossible (Figure 5c). In contrast, contamination in the CAPTURE spectra is significantly reduced and mainly concentrated around 2 Hz (Figure 5b and 5d). This non-physiological peak is well-separated from the respiratory content and can be easily removed by low-pass filtering.
Figure 5.
Comparison of spectra of signals obtained by the point navigator and CAPTURE from two representative participants. (a) and (b) are from Healthy Volunteer 3, while (c) and (d) are from Healthy Volunteer 1. The non-physiological contamination (CONTMN) introduced by the two methods was indicated by dashed arrows, while the true respiratory content (RESP) was indicated by dash-dot arrows. The contamination in the case of the point navigator is clearly more widespread and leads to severe interference with the respiratory content, especially for Healthy Volunteer 1.
Importance of phase tuning
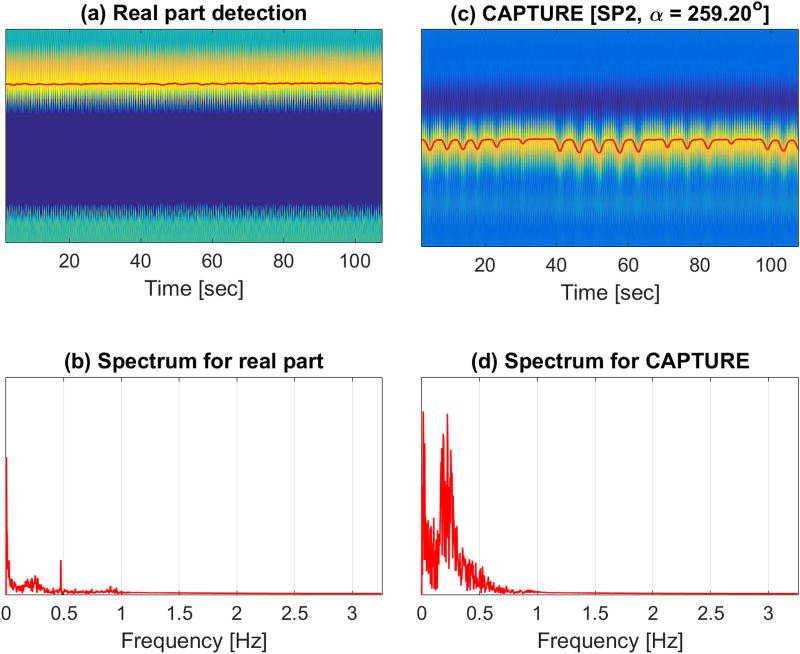
Figure 6 depicts the significance of phase tuning for one of the healthy volunteers. As shown in Figure 6a and 6b, the real part-based detection (prior to complex phase rotation) led to an almost flat curve with little respiratory content. In contrast, the optimal phase rotation resulting from CAPTURE tuning significantly enhanced the respiratory content buried in the data (Figure 6c and 6d).
Figure 6.
Importance of tuning complex projections prior to respiratory curve detection. (a) The result (red curve) obtained by maximum detection on the real part of the raw complex projections. (b) The corresponding spectrum. (c) The result (red curve) obtained by maximum detection on the real part of the phase-tuned complex projections. (d) The corresponding spectrum. Whereas the spectrum of the real part-based detection shown in (b) exhibits weak respiratory content, CAPTURE tuning clearly amplifies the respiration-related spectral content as shown in (d).
Phantom experiments
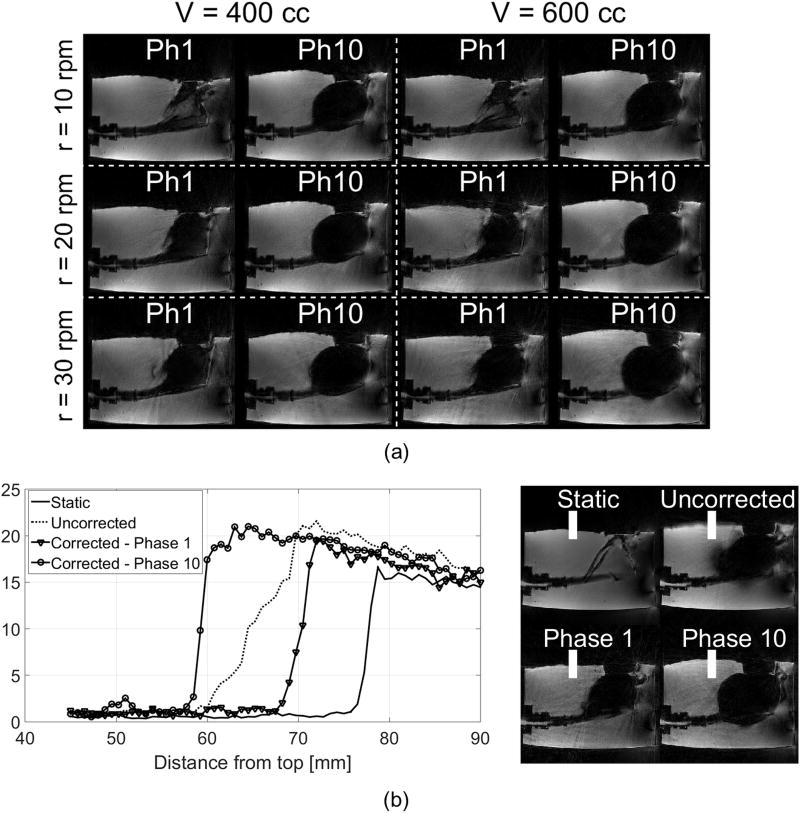
CAPTURE successfully resolved respiratory motion under all six different settings (Figure 7a). Figure 7b shows the line profile plots across the air-gel interface in static, motion-uncorrected and motion-corrected images. The slope across the air-gel interface, which was diminished to 36% of the static case in the motion-uncorrected image, was recovered to 78% of the static case in the motion-corrected images.
Figure 7.
(a) The first and last respiratory phases for the respiration phantom under six different motion settings. (b) Averaged intensity profiles from the same location of the air-gel interface for the largest-volume highest-speed setting [V = 600cc, r = 30rpm]. The averaging was performed across 15 adjacent profiles indicated by the white bands in the right-hand-side images. The slopes for the static experiment, the uncorrected image and Phases 1 and 10 of the motion-corrected dataset were found to be, respectively, 5.17, 1.86, 4.06 and 3.99 (arbitrary unit).
Human experiments
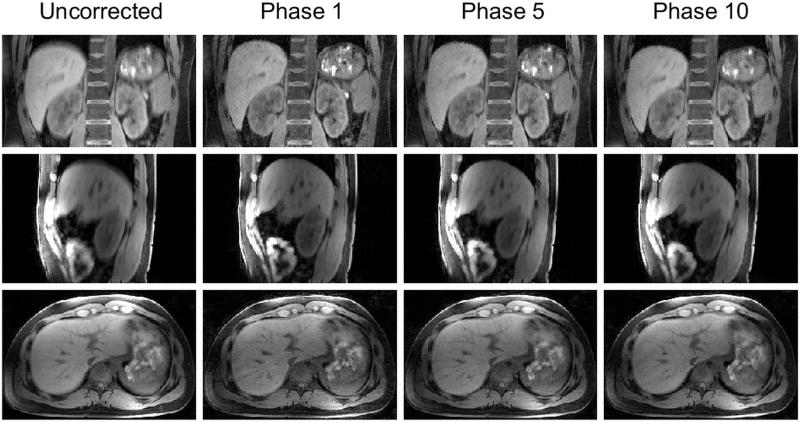
CAPTURE improved image sharpness in all three imaging orientations (Figure 8), implying that CAPTURE is able to resolve respiratory motion regardless of the imaging orientation.
Figure 8.
The uncorrected images and three representative respiratory phases from the CAPTURE-corrected dataset of one of the healthy volunteers.
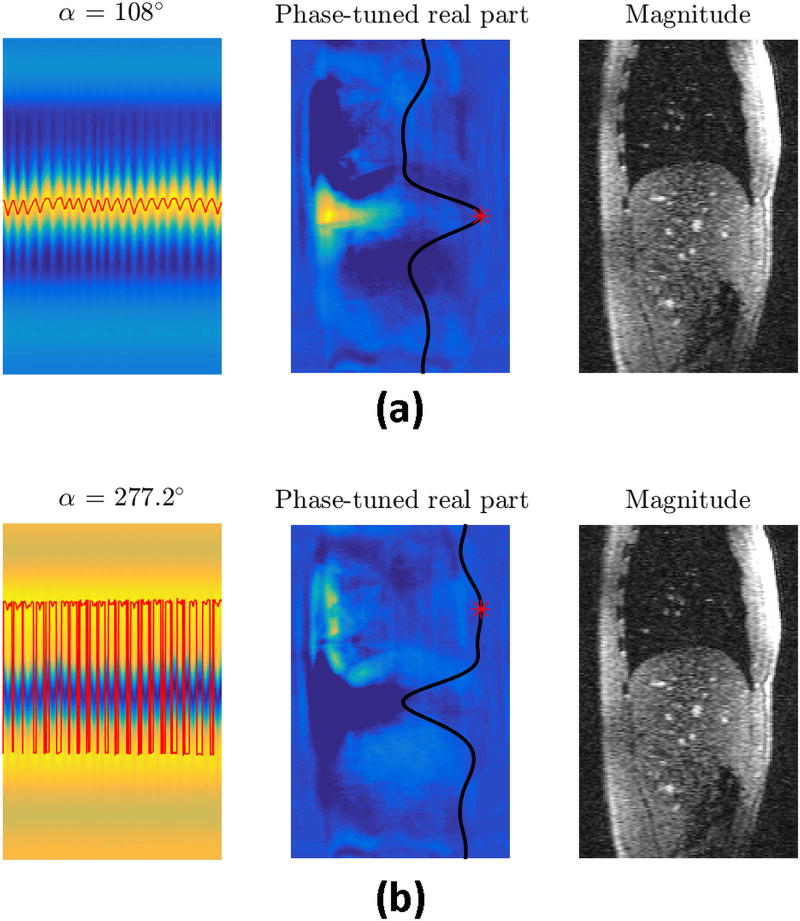
Figure 9 illustrates the effects of phase tuning on the thick-slice GRE data for two phase rotation angles. The red curves in the left column are the detected respiratory curves obtained by applying peak detection on phase-rotated projections. The images in the middle column depict the phase-rotated real parts for a sequence repetition of the thick-slice GRE acquisition, with the overlaid black curve being the projection computed from the same repetition and the red asterisk marking the peak of the projection. The images in the right column are from a sequence repetition of the thin-slice GRE acquisition, and provide a better anatomical reference. This figure shows that the phase-tuned real part operator selectively highlights different parts of the body for different phase rotation angles. If a suitable phase rotation is applied, this operation can highlight an anatomical region that moves significantly with respiration. Figure 9a illustrates an example for this phenomenon where the highlighted region forms a bright band on the liver area. In contrast, for some phase rotation angles, phase tuning highlights structures that do not move with respiration, in which case the detected curve will not represent respiration (Figure 9b). A quality metric similar to the one used in CAPTURE can be utilized here as well for selecting the angle providing the curve with the best respiratory characteristics. This figure also explains why the ordinary real part and imaginary part operators fail to work in some cases – due to large inter-subject and inter-scan phase variability, these operators might be highlighting anatomical regions that do not move much with respiration.
Figure 9.
The importance of CAPTURE’s phase tuning and how it helps respiratory motion detection are illustrated on the same data by using a suitable (Figure 9a) and a poor (Figure 9b) phase tuning angle. The images in the left column exhibit the phase-tuned real parts of the projections. The overlaid red curves are the detected respiratory motion curves obtained by peak detection. The images in the middle column are the phase-tuned real part images from a single sequence repetition of the thick-slice GRE acquisition. The overlaid black curves are the corresponding projections for that particular sequence repetition with the red asterisk indicating the peak of the projection. The images in the right column are thin-slice GRE images that provide a better anatomical reference.
Video, Supplemental Digital Content 1 demonstrates how the phase-tuned real part operator highlights different anatomical structures as the tuning angle sweeps through (0°, 360°]. On the other hand, Video, Supplemental Digital Content 2, demonstrates how the abdominal region highlighted by the phase rotation of 54° in the thick-slice GRE image moves with respiration. The corresponding magnitude image was also provided for the visualization of anatomical structures.
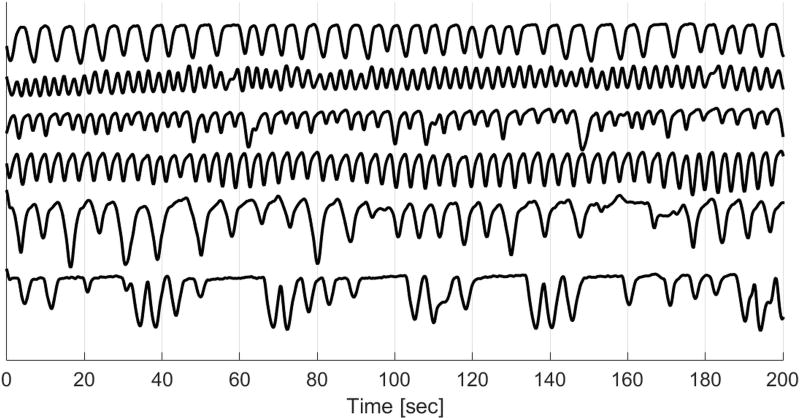
Large variations were observed in primary respiratory frequencies and liver dome motion ranges (Tables 1 and 2). Moreover, the respiratory patterns varied greatly not only across participants, but also for a given participant within the same imaging session (Figure 10). Despite this high variability, CAPTURE was able to extract the respiratory content from all datasets in a fully-automated manner by adapting to the unique characteristics of the participant’s respiratory pattern. This adaptability is demonstrated by the wide range of optimal rotation angles and coil elements listed in Tables 3 and 4. It is worth noting that the automated tuning process usually favored a coil element that provided a good spatial coverage of the lung-liver interface. The robustness of CAPTURE is also demonstrated by the results of our experiment involving a participant instructed to intentionally alter his breathing pattern (Figure 11).
Table 1.
Age, gender, CAPTURE-detected dominant respiratory frequency (i.e., the location of the peak within [0.1, 0.5] Hz in the spectrum of the detected curve), and measured end-inspiration to end-exhalation motion range of liver dome in motion-resolved images of CAPTURE for healthy volunteers. The median respiratory frequency was 0.30 Hz (interquartile range: 0.22–0.37 Hz).
| Age [y] | Gender | Respiration Freq. [Hz] | Motion Range [mm] | |
|---|---|---|---|---|
| Healthy Volunteer 1 | 22 | M | 0.52 | 16.9 |
| Healthy Volunteer 2 | 46 | M | 0.35 | 18.0 |
| Healthy Volunteer 3 | 31 | M | 0.22 | 20.2 |
| Healthy Volunteer 4 | 32 | M | 0.16 | 27.0 |
| Healthy Volunteer 5 | 24 | M | 0.36 | 18.0 |
| Healthy Volunteer 6 | 30 | M | 0.15 | 23.6 |
| Healthy Volunteer 7 | 28 | M | 0.37 | 16.9 |
| Healthy Volunteer 8 | 28 | M | 0.24 | 15.8 |
| Healthy Volunteer 9 | 62 | M | 0.24 | 16.9 |
| Healthy Volunteer 10 | 23 | M | 0.37 | 23.6 |
Figure 10.
From top to bottom: detected respiratory curves from three healthy volunteers and three liver tumor patients. The breathing patterns vary greatly not only across subjects, but also for a given participant within the same imaging session.
Table 3.
Optimal coils and phase rotation angles given by CAPTURE for healthy participants. BO[i]: Elements of the flex body coil placed on the chest of the participant, SP[i]: Elements of the spine coil placed in the scanner table that are next to the spine of the participant
| Sagittal | Coronal | Transversal | ||||
|---|---|---|---|---|---|---|
| Coil | Angle | Coil | Angle | Coil | Angle | |
| Healthy Volunteer 1 | SP2 | 144.0° | SP2 | 126.0° | SP2 | 122.4° |
| Healthy Volunteer 2 | SP2 | 162.0° | SP2 | 183.6° | SP2 | 324.0° |
| Healthy Volunteer 3 | SP2 | 259.2° | SP2 | 223.2° | BO1 | 18.0° |
| Healthy Volunteer 4 | SP2 | 144.0° | BO2 | 147.6° | SP2 | 259.2° |
| Healthy Volunteer 5 | SP2 | 136.8° | SP4 | 79.2° | SP2 | 169.2° |
| Healthy Volunteer 6 | SP1 | 349.2° | BO2 | 306.0° | SP2 | 306.0° |
| Healthy Volunteer 7 | SP2 | 144.0° | SP2 | 306.0° | SP2 | 205.2° |
| Healthy Volunteer 8 | SP2 | 324.0° | SP2 | 93.6° | SP2 | 327.6° |
| Healthy Volunteer 9 | SP1 | 126.0° | SP2 | 180.0° | SP1 | 100.8° |
| Healthy Volunteer 10 | BO1 | 172.8° | BO2 | 82.8° | SP3 | 54.0° |
Table 4.
Optimal coils and phase rotation angles given by CAPTURE for patient participants. BO[i]: Elements of the flex body coil placed on the chest of the participant, SP[i]: Elements of the spine coil placed in the scanner table that are next to the spine of the participant
| Sagittal | ||
|---|---|---|
| Coil | Angle | |
| Patient 1 | SP2 | 334.8° |
| Patient 2 | SP3 | 237.6° |
| Patient 3 | SP3 | 241.2° |
| Patient 4 | SP4 | 356.4° |
| Patient 5 | BO2 | 190.8° |
| Patient 6 | SP2 | 72.0° |
| Patient 7 | SP3 | 280.8° |
| Patient 8 | SP3 | 32.4° |
| Patient 9 | SP3 | 338.4° |
| Patient 10 | SP1 | 133.2° |
| Patient 11 | BO2 | 180.0° |
| Patient 12 | SP5 | 39.6° |
Figure 11.
Detected respiratory curve for one of the healthy participants who was asked to take a deep breath and also do breathholding.
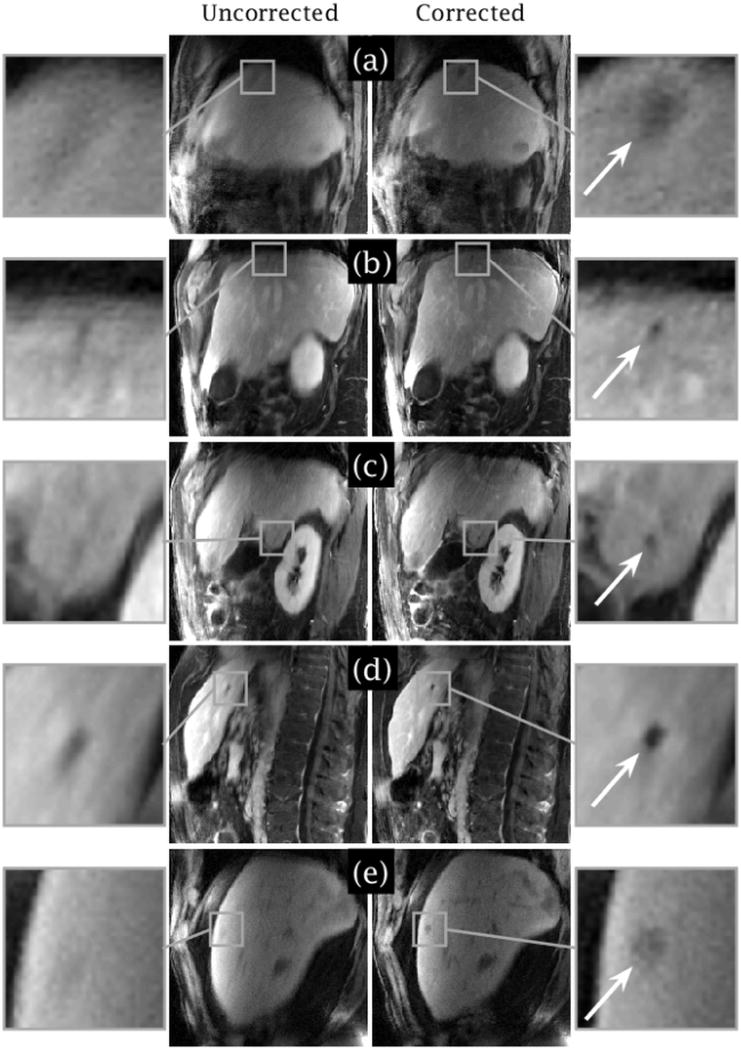
In the study of liver tumor patients, the lesions became more conspicuous in CAPTURE-corrected images (Figure 12). Some small lesions (<1 cm in size) that may have been missed on the uncorrected images due to motion blurring were depicted clearly in the CAPTURE images.
Figure 12.
Five representative slices from three liver tumor patients [(a) Slice 28 from Patient 2, (b–d) Slices 27, 37 and 58 from Patient 3, (e) Slice 25 from Patient 12]. Respiratory motion can blur small lesions, but the conspicuity of the lesions was substantially improved by CAPTURE as marked by the white arrows in the magnified inlet images. The major axis lengths of the lesions in the motion-corrected images are roughly (a) 15 mm, (b) 6 mm, (c) 7 mm, (d) 7 mm, and (e) 9 mm.
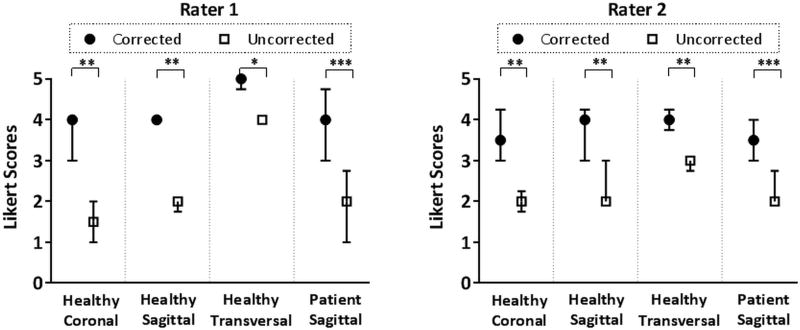
For the healthy volunteers, Rater 1 scored CAPTURE images higher for all coronal and sagittal image sets, and for 7 of 10 transverse image sets (for the remaining 3 cases, corrected and uncorrected images were scored equally). Rater 2 reported improvement in all cases in all three orientations. For the liver tumor patients, Rater 1 scored CAPTURE images higher in 11 out of 12 cases (for the remaining case, the corrected and uncorrected images were scored equally). Rater 2 reported improvement in all cases. It is worth noting that the Likert scores of the four cases rated equally were, respectively, 4, 4, 5 and 5; which are already close to or equal to the maximum Likert score that can be given. When assessed statistically, CAPTURE had significantly higher image quality scores for both readers in both the healthy volunteers and the liver tumor patients (Figure 13). The improvement in the median Likert scores ranged from 1 to 2 points across the whole set of participants.
Figure 13.
Medians and interquartile ranges of the Likert scores given by the two raters. According to the Wilcoxon signed-rank test, CAPTURE motion correction results in significantly improved image quality.* p≤0.05, ** p≤0.01, *** p≤0.001
Discussion
CAPTURE has two unique features: 1) the consistent acquisition of projections [CAP-] that substantially alleviates the effects of gradient system imperfections and hence provides ‘cleaner’ signals, removing the need for heavy filtering or complicated pattern recognition methods; and 2) the tuned and robust estimation [-TURE] process that adjusts the phase of the complex projections to allow for a fully-automated respiratory signal detection, even in the presence of large inter-subject and inter-scan variations.
In this study, CAPTURE was able to resolve respiratory motion both in a phantom and in human participants, the latter of which can exhibit a wide variety of respiration patterns. Moreover, in liver tumor patients, some focal lesions were more clearly depicted by CAPTURE images.
Azimuthal angle-dependent spectral contamination is significantly reduced for CAPTURE since the projections are always acquired at the same azimuthal angle across all stacks of spokes. In addition, CAPTURE uses the position of the peak along each of the 1D projections, rather than the signal intensity itself. Therefore, the factors that can cause signal contamination become less problematic. Furthermore, CAPTURE makes no assumptions about the MRI signal except that respiration frequencies are below 1 Hz. Therefore, baseline correction, detrending, PCA, or other pre-processing steps that may distort the true physiological response are not necessary. In contrast, the point navigator approach introduced by Grimm et al.11 uses the signal intensity variations at the center of the k-space to track respiratory motion. Many factors including gradient delays, eddy currents and off-resonance effects can therefore confound respiratory tracking in this approach30. As a result, angle-based signal detrending and heavy filtering have to be applied to remove azimuthal angle-dependent contamination, but these processes may distort the actual physiological signal. On the other hand, the XD-GRASP method15 uses the kx=ky=0 points along the kz-axis to form a 1D navigator. A principal component analysis (PCA) is then performed on the corresponding projections. The principle component with the highest spectral peak within the 0.1–0.5 Hz range is finally chosen for deriving respiratory motion. We have found that this principle component can still have a high amount of non-physiological signal contamination, due to the same confounding factors mentioned above for the point navigator method.
The navigators of CAPTURE can be flexibly placed along the direction most sensitive to motion regardless of the imaging orientation. Nonetheless, the direction of the 1D navigators of XD-GRASP is fixed by the imaging orientation, which may reduce sensitivity for motion detection if the navigator direction (i.e., the z direction), does not coincide with the axis of largest displacement, i.e. the SI axis.
In this study, the navigator resolution of CAPTURE was 1.125 mm because the navigators were acquired using the readout gradient. The spatial resolution of the XD-GRASP navigators, however, is limited by the slice thickness of the experiment, which was 3 mm both in this study and in the XD-GRASP study. Hence, CAPTURE may enable higher navigator spatial resolution than XD-GRASP, increasing the accuracy of detection.
CAPTURE tunes the signal through complex phase rotation and finds the optimal phase rotation angle that works best for the data at hand. The respiratory curve detection in CAPTURE is fully-automated and takes less than 4 seconds on a 64-bit Windows7 PC with 32 GB memory and an Intel Xeon CPU [3.50 GHz]. The signal tuning process makes it possible to adapt to large inter-subject variations. Ordinary real part and imaginary part-based detection schemes are already included in CAPTURE since they correspond to 2 of the 100 phase rotations that are applied (Real part detection visited for , imaginary part detection visited for ). It is also worth noting that, although CAPTURE uses the phase rotation yielding the highest quality metric, usually a number of neighboring phase rotations yield similar quality metric values and these angles can also provide reasonable respiration curves. Video, Supplemental Digital Content 1 demonstrates that, as the tuning angle changes, the highlighting in the image changes smoothly. This smoothness translates into plateaus in temporospectral quality metric plots, implying that not a single angle, but a multitude of them should work well for binning purposes, as long as the bright band falls onto a region that moves significantly with respiration.
It can be argued that phase tuning might highlight static structures or regions with irrelevant motion, which might distort the detected respiratory curve. It is true that a large range of tissues can be highlighted as the tuning operation sweeps through the entire set of angles within (0°, 360°]. However, the temporospectral quality metric has a stringent criterion for automatically selecting the tuning angle that yields the curve most representative of the underlying respiration.
More than one navigator along different directions can also be used for detecting two or more different types of motion. For instance, one navigator can be used for respiratory motion, while another can be used for cardiac motion. It is also possible to acquire multiple instances of the same navigator within the same stack of spokes in order to achieve a higher sampling rate. The navigation scheme of CAPTURE can also be easily adapted to other Cartesian and non-Cartesian sequences.
CAPTURE has a number of limitations. For instance, one imaging partition is replaced by a 1D navigator, leading to a 2–3% loss in imaging efficiency, whereas both the point navigator scheme11 and the XD-GRASP scheme15 estimate respiratory motion based solely on the imaging data without a loss in imaging efficiency. Additionally, neither these two methods nor CAPTURE corrects for gradient delays. A gradient delay correction scheme similar to that proposed by Moussavi et al.31 can be used for a further reduction of non-physiological signal contamination at the expense of performing an additional calibration.
CAPTURE is a retrospective motion correction scheme that bins k-space data into multiple respiratory phases. Therefore, like all other methods in this category, the sharpness of the images at any given respiratory phase depends on the motion range covered by the corresponding bin. The motion ranges can be reduced by increasing the number of respiratory bins but this approach may be applied at the expense of a higher amount of streaking artifacts attributable to greater levels of undersampling.
Finally, the deformable motion fields derived from the 4D motion-resolved images of CAPTURE might be utilized for improving radiotherapy planning, which helps protect patients from receiving excessive radiation dose32. The motion fields can also be used for applying motion correction to the PET data acquired simultaneously as part of a PET/MRI study.
In conclusion, CAPTURE provides a robust and fully-automated solution for obtaining 4D motion-resolved images in a free-breathing setting. With its unique tuning feature, CAPTURE can adapt to large inter-subject and inter-scan variations. CAPTURE also enables better lesion delineation due to improved image sharpness, thereby increasing the visibility of small lesions.
Supplementary Material
Supplemental Digital Content 1. Video that demonstrates how the phase-tuned real part operator highlights different anatomical structures as the tuning angle sweeps through (0°, 360°]. wmv
Supplemental Digital Content 2. Video that demonstrates how the abdominal region highlighted by the phase rotation of 54° in the thick-slice GRE image moves with respiration. The corresponding magnitude image was also provided for the visualization of anatomical structures. wmv
Acknowledgments
Source of Funding
This research is partially supported by two grants from National Institute of Health National Cancer Institute: R01 CA159471 (H. Michael Gach) and National Institute of Health P30 NS098577 (Hongyu An).
Footnotes
Conflicts of Interest
No conflicts of interest to be declared.
Contributor Information
Cihat Eldeniz, Postdoctoral Research Associate, Washington University in St. Louis.
Tyler Fraum, Clinical Fellow in Radiology, Washington University in St. Louis.
Amber Salter, Assistant Professor of Biostatistics, Washington University in St. Louis.
Yasheng Chen, Assistant Professor of Neurology, Washington University in St. Louis.
H. Michael Gach, Associate Professor of Radiation Oncology, Radiology, and Biomedical Engineering, Washington University in St. Louis.
Parag J. Parikh, Associate Professor of Radiation Oncology and Biomedical Engineering, Washington University in St. Louis.
Kathryn J. Fowler, Associate Professor of Radiology, Washington University in St. Louis.
Hongyu An, Associate Professor of Radiology, Washington University in St. Louis.
References
- 1.Paling MR, Brookeman JR. Respiration artifacts in MR imaging: reduction by breath holding. J Comput Assist Tomogr. 1986;10(6):1080–1082. doi: 10.1097/00004728-198611000-00046. [DOI] [PubMed] [Google Scholar]
- 2.Ehman RL, McNamara MT, Pallack M, et al. Magnetic resonance imaging with respiratory gating: techniques and advantages. AJR Am J Roentgenol. 1984;143(6):1175–1182. doi: 10.2214/ajr.143.6.1175. [DOI] [PubMed] [Google Scholar]
- 3.Lau D, Chen Z, Teo JT, et al. Intensity-Modulated Microbend Fiber Optic Sensor for Respiratory Monitoring and Gating During MRI. IEEE Trans Biomed Eng. 2013;60(9):2655–2662. doi: 10.1109/TBME.2013.2262150. [DOI] [PubMed] [Google Scholar]
- 4.Santelli C, Nezafat R, Goddu B, et al. Respiratory bellows revisited for motion compensation: preliminary experience for cardiovascular MR. Magn Reson Med. 2011;65(4):1097–1102. doi: 10.1002/mrm.22687. [DOI] [PMC free article] [PubMed] [Google Scholar]
- 5.Chen B, Webber N, Odille F, et al. Design and Validation of a Novel MR-Compatible Sensor for Respiratory Motion Modelling and Correction. IEEE Trans Biomed Eng. 2016;(99):1–1. doi: 10.1109/TBME.2016.2549272. PP. [DOI] [PubMed] [Google Scholar]
- 6.Ehman RL, Felmlee JP. Adaptive technique for high-definition MR imaging of moving structures. Radiology. 1989;173(1):255–263. doi: 10.1148/radiology.173.1.2781017. [DOI] [PubMed] [Google Scholar]
- 7.Song H, Ruan D, Liu W, et al. Respiratory motion prediction and prospective correction for free-breathing arterial spin-labeled perfusion MRI of the kidneys. Med Phys. 2017;44(3):962–973. doi: 10.1002/mp.12099. [DOI] [PMC free article] [PubMed] [Google Scholar]
- 8.Tibiletti M, Paul J, Bianchi A, et al. Multistage three-dimensional UTE lung imaging by image-based self-gating. Magn Reson Med. 2016;75(3):1324–1332. doi: 10.1002/mrm.25673. [DOI] [PubMed] [Google Scholar]
- 9.Jiang W, Ong F, Johnson KM, et al. Motion robust high resolution 3D free-breathing pulmonary MRI using dynamic 3D image self-navigator. Magn Reson Med. 2017 doi: 10.1002/mrm.26958. [DOI] [PMC free article] [PubMed] [Google Scholar]
- 10.Lin W, Guo J, Rosen MA, et al. Respiratory motion-compensated radial dynamic contrast-enhanced (DCE)-MRI of chest and abdominal lesions. Magn Reson Med. 2008;60(5):1135–1146. doi: 10.1002/mrm.21740. [DOI] [PMC free article] [PubMed] [Google Scholar]
- 11.Grimm R, Fürst S, Souvatzoglou M, et al. Self-gated MRI motion modeling for respiratory motion compensation in integrated PET/MRI. Med Image Anal. 2015;19(1):110–120. doi: 10.1016/j.media.2014.08.003. [DOI] [PubMed] [Google Scholar]
- 12.Piccini D, Feng L, Bonanno G, et al. Four-dimensional respiratory motion-resolved whole heart coronary MR angiography. Magn Reson Med. 2017;77(4):1473–1484. doi: 10.1002/mrm.26221. [DOI] [PMC free article] [PubMed] [Google Scholar]
- 13.Higano NS, Hahn AD, Tkach JA, et al. Retrospective respiratory self-gating and removal of bulk motion in pulmonary UTE MRI of neonates and adults. Magn Reson Med. 2017;77(3):1284–1295. doi: 10.1002/mrm.26212. [DOI] [PMC free article] [PubMed] [Google Scholar]
- 14.Buerger C, Clough RE, King AP, et al. Nonrigid Motion Modeling of the Liver From 3-D Undersampled Self-Gated Golden-Radial Phase Encoded MRI. IEEE Trans Med Imaging. 2012;31(3):805–815. doi: 10.1109/TMI.2011.2181997. [DOI] [PubMed] [Google Scholar]
- 15.Feng L, Axel L, Chandarana H, et al. XD-GRASP: Golden-angle radial MRI with reconstruction of extra motion-state dimensions using compressed sensing. Magn Reson Med. 2016;75(2):775–788. doi: 10.1002/mrm.25665. [DOI] [PMC free article] [PubMed] [Google Scholar]
- 16.Chandarana H, Feng L, Ream J, et al. Respiratory Motion-Resolved Compressed Sensing Reconstruction of Free-Breathing Radial Acquisition for Dynamic Liver Magnetic Resonance Imaging. Invest Radiol. 2015;50(11):749–756. doi: 10.1097/RLI.0000000000000179. [DOI] [PMC free article] [PubMed] [Google Scholar]
- 17.Campbell-Washburn AE, Xue H, Lederman RJ, et al. Real-time distortion correction of spiral and echo planar images using the gradient system impulse response function. Magn Reson Med. 2016;75(6):2278–2285. doi: 10.1002/mrm.25788. [DOI] [PMC free article] [PubMed] [Google Scholar]
- 18.Paul J, Divkovic E, Wundrak S, et al. High-resolution respiratory self-gated golden angle cardiac MRI: Comparison of self-gating methods in combination with k-t SPARSE SENSE. Magn Reson Med. 2015;73(1):292–298. doi: 10.1002/mrm.25102. [DOI] [PubMed] [Google Scholar]
- 19.Chandarana H, Block TK, Rosenkrantz AB, et al. Free-breathing radial 3D fat-suppressed T1-weighted gradient echo sequence: a viable alternative for contrast-enhanced liver imaging in patients unable to suspend respiration. Invest Radiol. 2011;46(10):648–653. doi: 10.1097/RLI.0b013e31821eea45. [DOI] [PubMed] [Google Scholar]
- 20.Kohler T. A projection access scheme for iterative reconstruction based on the golden section. IEEE Symposium Conference Record Nuclear Science 2004. 2004;6:3961–3965. Vol. 6. [Google Scholar]
- 21.Kazantsev IG, Matej S, Lewitt RM. Optimal Ordering of Projections using Permutation Matrices and Angles between Projection Subspaces. Electron Notes Discrete Math. 2005;20:205–216. [Google Scholar]
- 22.Feng L, Grimm R, Block KT, et al. Golden-angle radial sparse parallel MRI: combination of compressed sensing, parallel imaging, and golden-angle radial sampling for fast and flexible dynamic volumetric MRI. Magn Reson Med. 2014;72(3):707–717. doi: 10.1002/mrm.24980. [DOI] [PMC free article] [PubMed] [Google Scholar]
- 23.Rasche V, Holz D, Proksa R. MR fluoroscopy using projection reconstruction multi-gradient-echo (prMGE) MRI. Magn Reson Med. 1999;42(2):324–334. doi: 10.1002/(sici)1522-2594(199908)42:2<324::aid-mrm15>3.0.co;2-r. [DOI] [PubMed] [Google Scholar]
- 24.Eldeniz C, Chen Y, An H. Cosine-modulated acquisition cleans spectra for better respiratory cine; Proceedings of the 24th Annual Meeting of ISMRM; Singapore. 2016. Abstract #519. [Google Scholar]
- 25.Davies SC, Hill AL, Holmes RB, et al. Ultrasound quantitation of respiratory organ motion in the upper abdomen. Br J Radiol. 1994;67(803):1096–1102. doi: 10.1259/0007-1285-67-803-1096. [DOI] [PubMed] [Google Scholar]
- 26.Peters DC, Derbyshire JA, McVeigh ER. Centering the projection reconstruction trajectory: Reducing gradient delay errors. Magn Reson Med. 2003;50(1):1–6. doi: 10.1002/mrm.10501. [DOI] [PMC free article] [PubMed] [Google Scholar]
- 27.Griswold MA, Jakob PM, Heidemann RM, et al. Generalized autocalibrating partially parallel acquisitions (GRAPPA) Magn Reson Med. 2002;47(6):1202–1210. doi: 10.1002/mrm.10171. [DOI] [PubMed] [Google Scholar]
- 28.Knoll F, Bredies K, Pock T, et al. Second order total generalized variation (TGV) for MRI. Magn Reson Med. 2011;65(2):480–491. doi: 10.1002/mrm.22595. [DOI] [PMC free article] [PubMed] [Google Scholar]
- 29.Lustig M, Donoho D, Pauly JM. Sparse MRI: The application of compressed sensing for rapid MR imaging. Magn Reson Med. 2007;58(6):1182–1195. doi: 10.1002/mrm.21391. [DOI] [PubMed] [Google Scholar]
- 30.Grimm R, Bauer S, Kiefer B, et al. Optimal channel selection for respiratory self-gating signals; Proceedings of the 21st Annual Meeting of ISMRM; Salt Lake City, Utah, USA. 2013. p. 3749. [Google Scholar]
- 31.Moussavi A, Untenberger M, Uecker M, et al. Correction of gradient-induced phase errors in radial MRI. Magn Reson Med. 2014;71(1):308–312. doi: 10.1002/mrm.24643. [DOI] [PubMed] [Google Scholar]
- 32.Li G, Citrin D, Camphausen K, et al. Advances in 4D Medical Imaging and 4D Radiation Therapy. Technol Cancer Res Treat. 2008;7(1):67–81. doi: 10.1177/153303460800700109. [DOI] [PubMed] [Google Scholar]
Associated Data
This section collects any data citations, data availability statements, or supplementary materials included in this article.
Supplementary Materials
Supplemental Digital Content 1. Video that demonstrates how the phase-tuned real part operator highlights different anatomical structures as the tuning angle sweeps through (0°, 360°]. wmv
Supplemental Digital Content 2. Video that demonstrates how the abdominal region highlighted by the phase rotation of 54° in the thick-slice GRE image moves with respiration. The corresponding magnitude image was also provided for the visualization of anatomical structures. wmv


