

Abstract
Several groups recently coupled CRISPR perturbations and single-cell RNA-seq (scRNA-seq) for pooled genetic screens. We demonstrate that vector designs of these studies are susceptible to ~50% swapping of guide RNA-barcode associations due to lentiviral template switching. We optimize a published alternative, CROP-seq, in which the guide RNA also serves as the barcode, confirming this strategy performs robustly and doubling the rate at which guides are assigned to cells to 94%.
Pooled genetic screens based on RNAi or CRISPR enable thousands of programmed perturbations per experiment1,2. However, assays for such screens are limited to coarse phenotypes (e.g. cell viability) and are uninformative with respect to the mechanism by which perturbations mediate their effects.
To circumvent these limitations, several groups recently reported using scRNA-seq as a readout for CRISPR-based pooled genetic screens. The guide RNA (sgRNA) in each cell is identified together with its transcriptome, either via a Pol II transcribed barcode (CRISP-seq, Perturb-seq, Mosaic-seq3–6) (Figure 1a), or by capturing the sgRNA itself within a Pol II transcript (CROP-seq7) (Figure 1b). Towards similar goals, we pursued a lentiviral strategy similar to the former methods3–6 in which each sgRNA was linked to a barcode located several kilobases away (Figure 1a). In our vector (pLGB-scKO), the barcode was positioned in the 3′ UTR of a blasticidin resistance transgene, enabling its recovery by scRNA-seq methods that capture poly(A) transcripts (Supplementary Figure 1a-b). Guides and barcodes were paired during DNA synthesis, which facilitated pooled cloning and lentiviral delivery (Supplementary Figure 1c).
Figure 1.
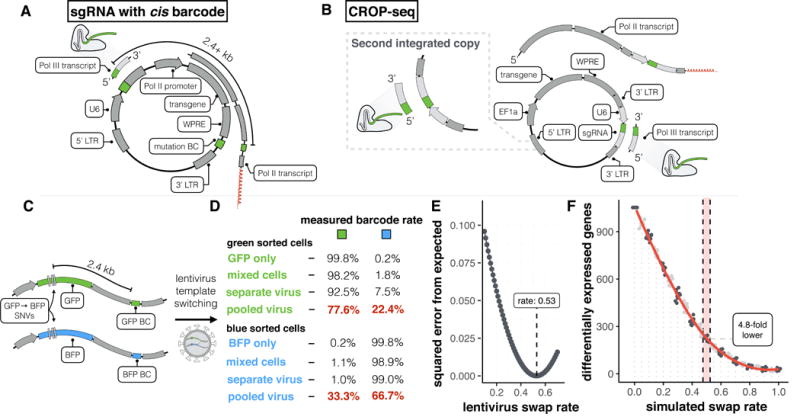
Template switching during lentiviral packaging decreases the sensitivity of designs relying on cis-pairing of sgRNAs and distal barcodes. A) Generalized schematic of vectors that rely on cis pairing of sgRNAs and barcodes such as Peturb-seq, CRISP-seq, and MOSAIC-seq. A barcode is linked to an sgRNA separated by a distance of 2.4 kb or more depending on the specific design. This barcode is expressed as part of the Pol II transcript and sequenced as a proxy for the guide sequence. B) Generalized schematic of CROP-seq approach. One copy of the guide is cloned into the 3′ LTR of the vector. The guide sequence itself is therefore transcribed as part of both the Pol II transcript and can therefore be sequenced directly. A second copy of the guide expression cassette is produced in the 5′ LTR during lentivirus positive strand synthesis prior to integration. C) Schematic of experiment performed to quantify template switching rate at 2.4 kb separation between sequences. Distinguishing bases (3 bp differences) in GFP and BFP are separated from their respective barcodes by 2.4 kb. D) Cells were transduced with GFP or BFP virus separately or a virus generated from a mix of GFP/BFP produced from individual or combined lentiviral packaging. As an additional control, cells transduced with GFP or BFP only virus were mixed prior to sorting. Cells were sorted on GFP and BFP and the percent GFP and BFP barcodes in each sample is shown as a table. Note that in a mix of two plasmids only approximately half of all chimeric products are detectable due to homozygous virions (see Online Methods). E) Plot of sum of squared errors of observed data vs. expected values at various swap rates using the collected fraction GFP and BFP barcodes in the green and blue sorted samples (n = 4 measurements), assuming a relative proportion of 61.7% GFP+ cells as determined from FACS (see Supplementary Figure 4 for and methods for details). F) Transcription factor pilot screen from the arrayed screen of Adamson et al. (used here as a gold standard performed with arrayed lentivirus production) subjected to simulation of progressively higher fractions of target assignment swapping. Number of differentially expressed genes across the target label at FDR of 5% is plotted at each swap rate for 10 samplings per swap rate (n = 5321 cells used in tests). 0.5 corresponds to the 50% swap rate determined via FACS.
With this design, we sought to ask how loss-of-function (LoF) of tumor suppressors altered gene expression in immortalized, non-transformed breast epithelial cells. We targeted TP53 and other tumor suppressors in MCF10A cells, with or without exposure to the DNA damaging agent, doxorubicin. Cloning and lentiviral packaging was either performed individually for each targeted gene (‘arrayed’), or in a pooled fashion. In addition to scRNA-seq, we performed targeted amplification4,5 to more efficiently recover the barcodes present in each cell (Supplementary Figure 1b; Supplementary Figure 2).
With arrayed lentiviral production, a substantial proportion of cells in which TP53 was targeted had a gene expression signature consistent with failure to activate a cell cycle checkpoint response after DNA damage (e.g., lower expression of CDKN1A and TP53I3; Supplementary Figure 3a). However, these effects were greatly reduced when we performed a similar experiment with pooled lentiviral production (Supplementary Figure 3b). Furthermore, markedly fewer genes were differentially expressed in the pooled than in the arrayed experiment (Supplementary Figure 3c). t-SNE embedding revealed that both experiments contained a cluster of cells characterized by expression of the mitotic marker CCNB2 and low levels of TP53I3, consistent with a TP53-null phenotype. In the arrayed experiment, this cluster was almost entirely composed of cells with sgRNAs targeting TP53 (99.4%). However, in the pooled experiment, only 41% of assigned cells from the corresponding cluster contained TP53 sgRNAs (Supplementary Figure 3d-i).
We reasoned that lentiviral template switching may explain this difference. Lentiviral virions are pseudodiploid, i.e. two viral transcripts are co-packaged during their production8,9. The reverse transcriptase that acts prior to integration has a rate of template switching10 estimated as 1 event per kilobase (kb)11. In pooled lentiviral production, template switching should result in the integration of chimeric products at a rate proportional to the distance between paired sequences (Supplementary Figure 4). This risk was noted by Adamson et al.4 and Dixit et al.5. It was altogether avoided by Adamson et al.4 through arrayed lentiviral production, but pooled lentiviral production was performed in some or all experiments of the other reports3,5,6. Although Sacket al. recently quantified this phenomenon at distances up to 720 bp in vectors designed for bulk selection screens12, the implications of template switching at longer distances (e.g. the 2.5 kb+ separation between sgRNAs and barcodes in the pLGB-scKO, CRISP-seq, Perturb-seq, and Mosaic-seq vectors3–6), as well as for scRNA-seq study designs specifically, remain unexplored.
To test this hypothesis, we cloned BFP and GFP transgenes, which differ by three base-pairs, into separate lentiviral vectors, pairing each with a unique barcode, separated from the nearest unique bases in BFP/GFP by 2.4 kb (Figure 1c). We transduced MCF10A cells with lentivirus generated either individually or as a pool of the two plasmids, FACS-sorted GFP+ or BFP+ fractions and quantified the rate of barcode swapping (Figure 1d; Supplementary Figure 5). At this distance, swapping occurred at the theoretical maximum rate of 50% (Figure 1e; Supplementary Figure 6).
To simulate the impact of template switching, we obtained data from Adamson et al.4 generated using the Perturb-seq vector with arrayed lentiviral production. We swapped target labels in silico at varying rates, and evaluated power to detect differentially expressed genes (DEG). With 50% swapping, we observe a 4.8-fold decrease in the number of DEG (Figure 1f). This loss in power results from an effective twofold reduction in number of useful cells per target, coupled with noise from swapped associations.
CROP-seq7 differs from the other methods3–6 in not relying on pairing of sgRNAs and barcodes. Instead, the sgRNA itself serves as a barcode, as part of an overlapping Pol II transcript. Furthermore, the sgRNA cassette is copied from the 3′ to 5′ LTR during positive strand synthesis (Figure 1b) via an intramolecular priming step that does not result in appreciable intermolecular swapping13. A limitation of CROP-seq is that sgRNAs are recovered from scRNA-seq data with limited sensitivity (~40-60%)7, such that half the single cell transcriptomes are discarded. We modified CROP-seq to include targeted amplification of the sgRNA region from mRNA libraries already tagged with cellular barcodes, similar to our pLGB-scKO design (Supplementary Figure 7a-b).
To evaluate this approach, we performed a CRISPR-mediated LoF screen of 32 tumor suppressors (6 guides per target) and 6 non-targeting control (NTC) guides in MCF10A cells with or without doxorubicin. While sgRNA(s) would be identified at a rate of 42-47% from scRNA-seq data alone, this rate was increased to 94% with targeted amplification (Figure 2a). In contrast with our original pooled experiment, tSNE embedding of doxorubicin-exposed cells from this experiment yielded a cluster almost entirely composed of cells containing TP53-targeting sgRNAs (Figure 2b). Specifically, the 262 cells in this cluster include 90.5% with TP53-targeting guides, 7.6% with guides targeting other genes, 0% with NTC guides, and 1.9% unassigned cells. In contrast, the remaining 5,617 cells include 3.2% with TP53-targeting guides (presumably cells in which LoF editing failed to occur), 84.2% with guides targeting other genes, 7.5% with NTC guides, and 5.2% unassigned cells. Expression levels of the p53 targets CDKN1A and TP53I314,15 were markedly lower in the TP53-targeted cluster (Figure 2c), and 4,277 and 2,186 differentially expressed genes (FDR 5%) were identified relative to cells with NTC guides in the doxorubicin-treated and untreated (mock) conditions, respectively. Thus, our improved CROP-seq protocol achieves the power and negligible sgRNA swap rate of the arrayed format without sacrificing the scalability of a pooled cloning and lentiviral production workflow.
Figure 2.
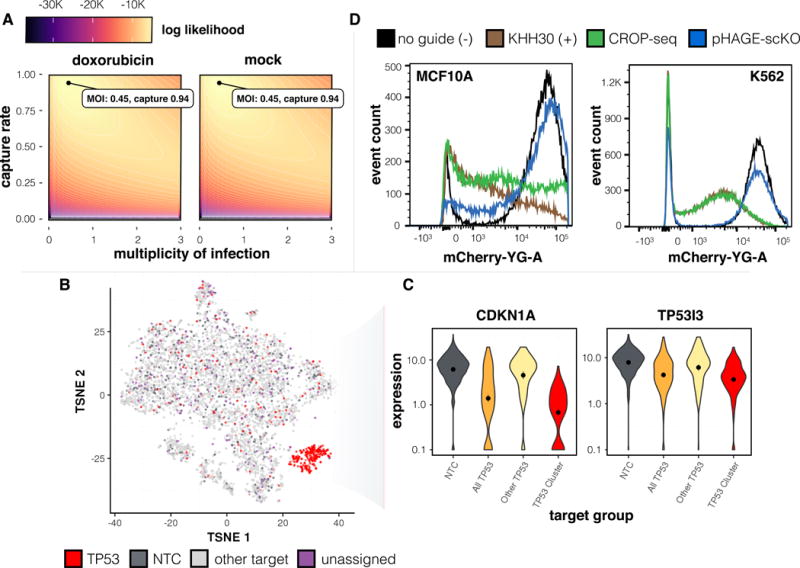
CROP-Seq screen of tumor suppressors with high capture rate by PCR enrichment, and assessment of alternate sgRNA placement within a pol II 3′UTR. A) Determination of the most likely multiplicity of infection and capture rate of barcoded transcripts in CROP-seq screen based on a generative model. B) tSNE embedding of a doxorubicin treated sample with colors corresponding to cells with guides to TP53, cells that contain non-targeting controls (NTC), cells containing guides to non-TP53 targets, and cells that are unassigned (n = 5879 cells). All vectors have been modified to contain a CRISPRi-optimized backbone. pHAGE-scKO places the sgRNA within a Pol II 3′ UTR and fails to knockdown mCherry.C) CDKN1A and TP53I3 expression in cells expressing either non-targeting controls or guides to TP53. Cells with TP53 guides are further stratified into cells inside and outside of the TP53 enriched cluster from panel 2B. Values capped at a minimum value of 0.1 to facilitate plotting. D) CRISPRi knock-down of mCherry in MCF10A and K562 cells not expressing a guide (- control), KHH30 (+ control), CROP-seq, and pHAGE-scKO design. All vectors have been modified to contain a CRISPRi optimized backbone. pHAGE-scKO places the sgRNA within a Pol II 3'UTR and performs poorly.
Upon tSNE analysis of both mock and doxorubicin treated cells (Supplementary Figure 8a-b), we find several tumor suppressors whose distribution across clusters is significantly different compared to NTCs (FDR 5%), with more changes after doxorubicin exposure (13 and 14 targets with significant changes in the mock and doxorubicin conditions, respectively; Supplementary Fig. 8c–f). We tested for target enrichment within clusters and generated average expression profiles for each enriched target-cluster pair. Gene set enrichment analysis (GSEA) of the most highly loaded genes in the principal components of these average expression profiles show many targets to be associated with increased proliferation and a decreased TP53/DNA damage response, most prominently with targeting of TP53 (Supplementary Figure 9).
To further assess the impact of template switching on sensitivity, we permuted target labels within our own CROP-seq tumor suppressor screen, observing a 2.9-fold reduction in the number of DEGs across targets at a swap rate of 50%. The number of significant targets was also reduced, to just 4/13 (TP53, STK11, CHEK1 and NCOR1) and 3/14 (TP53, RB1, and ARID1B) in the mock and doxorubicin conditions, respectively. Additionally, simulations of 50% swapping on the larger (50,000 cells) unfolded protein response screen from Adamson et al. with arrayed lentiviral production resulted in a 1.9- and 2.8-fold reduction in the number of DEGs when using 25,000 and 6,000 cells, respectively (Supplementary Figure 10). Altogether, these simulations demonstrate that the reduction in power consequent to swapping is dependent on the number of cells captured, the number of targets, and the effect size of those targets.
Although CROP-seq is not subject to sgRNA-barcode swapping, it is limited by its placement of the sgRNA in the lentiviral LTR, as larger intervening sequences such as dual sgRNA designs16 might render the LTR non-functional7. To enable incorporation of longer cassettes, we placed the sgRNA cassette between the WPRE and LTR. In this design (pHAGE-scKO), copying of the sgRNA between LTRs would not occur, but the guide sequence would still contribute to overlapping Pol II and Pol III transcripts (Supplementary Figure 11).
To evaluate this design, we compared the ability of pHAGE- scKO, CROP-seq, and a standard lentiviral sgRNA expression vector, pKHH03017, all containing a CRISPRi-optimized backbone, to inhibit transcription via CRISPRi, targeting the promoter of an mCherry transgene. Whereas pKHH030 and CROP-seq exhibited efficient inhibition, pHAGE-scKO had poor efficacy (Figure 2d). Consistent with this, we observed low editing rates with pHAGE-scKO (88% with pLGB control vs. 29% with pHAGE-scKO). Recent studies suggest interference when Pol II and Pol III transcripts overlap18,19. We hypothesize that the poor efficacy of pHAGE-scKO is due to the blasticidin resistance gene inhibiting sgRNA expression. In contrast, CROP-seq likely maintains efficacy because the second integrated copy of the sgRNA (copied to the 5′ LTR) does not overlap a Pol II transcript.
CRISPR-based pooled genetic screens coupled to scRNA-seq phenotyping have the potential to be extremely powerful. However, several published designs, and our own initial design, are susceptible to high rates of sgRNA-barcode swapping (diagrams of all relevant vectors are shown in Supplementary Figure 12). Importantly, we do not expect that positive conclusions drawn by published studies utilizing such designs in conjunction with pooled lentivirus production3,5,6 are incorrect. Each of these studies examined few targets and collected large datasets, raising their baseline sensitivity. However, given the high cost of scRNA-seq and impetus to expand the number of targets in such screens, our observations are highly relevant for future studies. Reductions in power may be partly overcome by filtering cells that appear inconsistent with their assigned target5, or completely overcome with arrayed lentiviral production (as in Adamson et al.)4. However, computational filtering has the potential to introduce biases, and itself reduces power by discarding collected data, while arrayed lentiviral production dramatically limits scalability.
A viable alternative is the recently published CROP-seq method7. By coupling targeted sgRNA amplification and CROP-seq, we doubled the proportion of cells in which guides are assigned to 94%. The attractive features of this approach include the simplicity of the cloning protocol, its compatibility with lentiviral delivery, the high rate of recovery of sgRNA-cell associations, and minimized risk of template switching.
Online Methods
Cell Culture
MCF10A immortalized breast epithelial cells20 were purchased from ATCC and cultured in DMEM/F12 (Invitrogen) supplemented with 10% FBS, 1% pen-strep, 10ng/mL EGF, 1μg/mL hydrocortisone, 5μg/mL insulin and 100ng/mL cholera toxin. K562 cells were cultured in RPMI 1640+L-Glutamine (Gibco), supplemented with 10% fetal bovine serum (Rocky Mountain Biologicals) and 1% pen-strep (Gibco).
Generating Inducible Cas9 Expressing MCF10A Cell Lines
Lentivirus containing either a doxycycline inducible or constitutively expressed Cas9 construct were produced by transfecting 293T cells with either pCW-Cas9 (Addgene #50661) or lentiCas9-Blast (Addgene #52962) using the ViraPower Lentiviral Expression System (Thermo) according to manufacturer’s instructions. 48h post-transfection, supernatant was collected and debris removed using a 40μm syringe filter. MCF10A were transduced with viral supernatant for 48 hours and selected with 1μg/mL puromycin (pCW-Cas9) or 10μg/mL blasticidin (lentiCas9-Blast) for 96h. For cells expressing a doxycycline inducible Cas9, single-cell clones of MCF10A-Cas9 cells were generated by dilution, clones expanded, and Cas9 expression confirmed by immunoblotting 96h following addition of doxycycline at 1ug/mL. lentiCas9-Blast cells were maintained as a polyclonal line.
pCW-Cas9 cells were used for initial arrayed and pooled screens, as well as quantification of editing rates in pHAGE-scKO vector. lentiCas9-Blast cells were used for all CROP-seq experiments.
Initial Tagged Transcript Cloning Method
Due to high rates of barcode/sgRNA swapping when using this design, we do not recommend use of this protocol.
LentiGuide-puro (Addgene #52963) was modified to confer blasticidin resistance. Puro and its EF-1A promoter were removed via double digest with NEB SmaI (8h at 25°C) and MLU1-HF (8h 25°C). This product was gel purified using QiaQuick Gel Extraction kit (Qiagen). EF-1A promoter and Blasticidin, each with 20bp homology on both ends were prepared via PCR from lentiCas9-Blast and gel purified. Fragments were assembled into digested lentiGuide-puro vector using the NEBuilder HiFi DNA Assembly kit with inserts in 2-fold molar excess and transformed into NEB C3040H E. Coli and allowed to incubate overnight at 30°C. Clones were picked from plate, allowed to grow in LB+amp overnight at 30°C, and were purified using Qiagen Miniprep kit. Individual clones were validated via Sanger sequencing.
Lentiguide-blast was linearized using a digest with BsmB1 (Thermo) at 37°C for five hours followed by digestion with SalI HF (NEB) overnight and gel purification. Oligos containing guide sequences and their corresponding barcodes were designed according to the following: tGTGGAAAGGACGAAACACC[G][guide]gttttagagctaGAAAtagcagagacgCGTCTCAgatctccctttgggccgcctccccgcg[barcode]tcgactttaagaccaatgacttaca
Where [guide] is a 20bp guide sequence and [barcode] is an 8bp barcode sequence uniquely paired to an sgRNA. The [G] included prior to guide is required for expression from Pol III promoters. Guides/barcodes that generate an extra BsmB1 restriction site when used in this design were excluded. RUNX1 only included 4 guides because of this filter.
A library of these oligos was ordered as Ultramers from IDT. All oligos were resuspended in water, pooled at equimolar concentrations, and amplified using a 50ul KAPA HiFi HotStart Ready Mix PCR reaction with 1ng of input DNA. The resulting product was cleaned with a Zymo DNA Clean and Concentrator kit. The purified inserts were assembled into linearized lentiGuide-blast using the NEBuilder HiFi DNA Assembly kit and a molar excess of 1:5 vector to insert. Assembled products were transformed into NEB C3040H E. Coli and grown overnight at 30°C in LB+amp. Product was prepared using a plasmid Miniprep kit (Qiagen).
To prepare the insert for the final reaction, a region from the backbone sequence for the CRISPR sgRNA to a region towards the end of the WPRE element was amplified using the KAPA HiFi Hotstart Master Mix and purified using the Zymo Clean and Concentrator kit. The primers used in this reaction add BsmB1 cut sites that generate complementary ends in the final cloning step following digestion. This amplified fragment was ligated into PGEM-T using the PGEM-T kit a clone selected and validation of individual clones by Sanger sequencing. The validated construct was digested with BsmB1 (Thermo) and gel purified.
The fragment isolated from PGEM-T was then ligated into the linearized vector using a 3:1 molar excess of insert to vector using T4 DNA Ligase (New England Biolabs) and overnight incubation at 16°C. Ligation products were transformed into NEB C3040H (stable) competent cells and grown overnight at 30°C in LB+amp. Plasmids were recovered using a Plasmid Miniprep kit (Qiagen).
pHAGE and CROP-seq Vector Cloning
The pHAGE_dsRed_IRES_zsGreen vector was modified to contain a multiple cloning site as described in Quantification of Template Switching in Lentivirus Packaging Using FACS. The U6-sgRNA cassette containing a 500bp filler removable by Bsmb1 digest was ordered as an IDT gblock. Using the multiple cloning site, the U6-sgRNA cassette was added in the three-prime UTR of the zsGreen/dsRed transgene via Gibson assembly. This vector was modified to remove the zsGreen/IRES/dsRed cassette and replace the CMV promoter with an EF1a promoter.
To clone libraries for this vector or CROP-seq vectors, the starting vector was digested following the protocol outlined in21. Oligos corresponding to individual guides with homology for gibson assembly were ordered as standard DNA oligos from IDT with the following design:
[GCCTTATTTTAACTTGCTATTTCTAGCTCTAAAAC][GUIDERC][C][GGTGTTTCGTCCTTTCCACAAGAT]
GUIDERC refers to the reverse complement of the guide sequence. The entire construct may also be reverse complemented, allowing the guide sequence itself to be used rather than the reverse complement.
All oligos were resuspended in water, pooled at equimolar concentrations, and amplified using a 50ul KAPA HiFi HotStart Ready Mix PCR reaction with 1ng of input DNA. The following primers were used for amplification:
Forward: 5-GCCTTATTTTAACTTGCTATTTCTAGCT-3
Reverse: 5-ATCTTGTGGAAAGGACGAAACA-3
These reactions were cleaned with a Zymo DNA Clean and Concentrator kit and cloned into the Bsmb1 digested pHAGE vector backbone using the Clontech Infusion HD Cloning Kit. Ligations were performed using 10fmols of vector and 200fmols of double stranded oligo (1:20 molar ratio of vector to insert). Ligation products were transformed into NEB C3040H (stable) cells according to manufacturer recommendations. Transformations were diluted with 250μL of LB and spread onto 6 LB-AMP plates and incubated at 30°C for 24h. Colonies were then scraped into LB, bacterial pellet collected and plasmids recovered using a Plasmid Midiprep kit (Qiagen).
The CROP-seq vector with optimized backbone (CROP-seq-opti was cloned in a manner similar to the standard CROP-seq vector but with different homology.
Oligos were ordered with the following 3′ homology:
5-gtttAagagctaTGCTGGAAACAGCAtagcaagt-3
If ordering in the same format as above (where the oligo is the reverse complement), GCCTTATTTTAACTTGCTATTTCTAGCTCTAAAAC, would be replaced by the reverse complement of the above sequence.
And amplified with primers:
Forward: 5-atcttGTGGAAAGGACGAAACA-3
Reverse: 5-acttgctaTGCTGTTTCCAGC-3
Each of these vectors are also compatible with alternative cloning protocols for lentiGuide-Puro vectors (as long as any homology is adjusted as needed).
Quantification of Template Switching in Lentivirus Packaging Using FACS
A multiple cloning site was cloned into pHAGE_dsRed_IRES_zsGreen lentiviral vector between the WPRE and 3′LTR. The multiple cloning site was assembled from annealing and extension of WPRE_MCS_insert_W and WPRE_MCS_insert_R:
WPRE_MCS_insert_W:
5-ctttgggccgcctccccgcctgggcgcgccATAACAgctagcTGATGGctcgagcc-3
WPRE_MCS_insert_R:
5-cagctgccttgtaagtcattggtcttaaaggctcgagCCATCAgctagcTGTTATgg-3
The plasmid was amplified by inverse PCR with pHAGE_WPRE_MCS_GIBS_F and R:
pHAGE_WPRE_MCS_GIBS_F
5-TGGctcgagcctttaagaccaatgacttacaaggcagctg-3
pHAGE_WPRE_MCS_GIBS_R
5-ctagcTGTTATggcgcgcccaggcggggaggcggcccaaag-3
The fragments were cloned by Gibson Assembly. Clones of pHAGE_dsRed_IRES_zsGreen_WPRE_MCS were chosen by Sanger sequencing and expression of the fluorescent proteins after transfection and lentiviral packaging.
To make pHAGE EBFP or EGFP_IRES_dsRed_WPRE_MCS, pHAGE_dsRed_IRES_zsGreen_WPRE_MCS was cut with BamHI and ClaI to remove the zsGreen and IRES. The ends were blunted and re-ligated to make pHAGE_dsRed _WPRE_MCS. EGFP or EBFP (amplified with eGFP_gibsF and eGFP_IRES_GibsR) and an IRES (IRES_GibsF, IRES_GibsR) were cloned into the NotI site 5′ of the dsRed, by Gibson Assembly. EBFP was ordered as a gblock from IDT with 3 nucleotide changes from EGFP. Correct clones were identified by sequencing. The dsRed is not expressed in this construct.
eGFP_gibsF:
5-gccatccacgctgttttgacctccatagaagacaccggcATGGTGAGCAAGGGCGAGGAG-3
eGFP_IRES_GibsR:
5-ggatccCTACTTGTACAGCTCGTCCATGCCG-3
IRES_GibsF:
5-ATCACTCTCGGCATGGACGAGCTGTACAAGTAGggatccctcccccccccctaacgttac-3
IRES_GibsR:
5-ctccttgatgacgtcctcggaggaggccatggcggccatgtgtggccatattatcatcgtgtttttcaaagg-3
EBFP
5-ATGGTGAGCAAGGGCGAGGAGCTGTTCACCGGGGTGGTGCCCATCCTGGTCGAGCTGGACGGCGACGTAAACGGCCACAAGTTCAGCGTGTCCGGCGAGGGCGAGGGCGATGCCACCTACGGCAAGCTGACCCTGAAGTTCATCTGCACCACCGGCAAGCTGCCCGTGCCCTGGCCCACCCTCGTGACCACCCTGACCCACGGCGTGCAGTGCTTCAGCCGCTACCCCGACCACATGAAGCAGCACGACTTCTTCAAGTCCGCCATGCCCGAAGGCTACGTCCAGGAGCGCACCATCTTCTTCAAGGACGACGGCAACTACAAGACCCGCGCCGAGGTGAAGTTCGAGGGCGACACCCTGGTGAACCGCATCGAGCTGAAGGGCATCGACTTCAAGGAGGACGGCAACATCCTGGGGCACAAGCTGGAGTACAACTTtAACAGCCACAACGTCTATATCATGGCCGACAAGCAGAAGAACGGCATCAAGGTGAACTTCAAGATCCGCCACAACATCGAGGACGGCAGCGTGCAGCTCGCCGACCACTACCAGCAGAACACCCCCATCGGCGACGGCCCCGTGCTGCTGCCCGACAACCACTACCTGAGCACCCAGTCCGCCCTGAGCAAAGACCCCAACGAGAAGCGCGATCACATGGTCCTGCTGGAGTTCGTGACCGCCGCCGGGATCACTCTCGGCATGGACGAGCTGTACAAG-3
15bp barcodes (lenti-barcode and lenti-barcode-r) were cloned into the multiple cloning site between the WPRE and 3′LTR for both the EBFP and EGFP constructs by Gibson Assembly. Single clones were prepared and the barcode identified by Sanger sequencing.
lenti-barcode:
5-atctccctttgggccgcctccccgcctgggGGATCCAGNNNNNNNNNNNNNNNtcgagcctttaagaccaatgacttacaagg-3
lenti-barcode-r:
5- CCTTGTAAGTCATTGGTCTTAAAGGCTCGA-3
Lentivirus was packaged by transfection of barcoded EGFP or EBFP constructs either alone or in an equimolar mix along with helper plasmids (pHDM-Hgpm2, pHDM-Tatlb, pRC-CMVRev1b and pHDM-VSV-G) into HEK293T cells using Lipofectamine 2000 (Invitrogen). Viral supernatant was collected after 48h, spun to remove debris, snap frozen in liquid nitrogen and stored at −80°C. To titer the packaged lentiviruses, they were thawed on ice and added to MCF10A cells with media containing 8ug/ml polybrene, and the frequency of transduced cells 48h post-transduction was determined by flow cytometry.
To sort blue+ and green+ populations, 400,000 of MCF10A ∆TP53 cells (Horizon Discovery) in 5 ml media plus 8ug/ml polybrene were transduced at a MOI ~0.1, with either of the EGFP or EBFP expressing viruses that had been packaged singly, a mix of the EGFP and EBFP expressing viruses that had been packaged singly or the EGFP and EBFP expressing viruses that had been packaged together. The cells were cultured for four weeks to avoid residual plasmid contamination following transduction. An equal number of cells transduced with EGFP and EBFP virus were mixed to determine the rate of contamination resulting from FACS error. The mixed cells along with others were sorted for blue+ or green+ populations using a FACS Aria II (Becton Dickinson) that had been compensated for the overlap between the EBFP and EGFP emission spectra. Genomic DNA was harvested from each population using the Qiagen DNeasy kit and barcodes amplified from 2-36 ng of genomic DNA in 50ul Robust polymerase (Kapa) reactions with primers bwds_p5_WPRE_BC_F and bwds_next_WPRE_BC_R.
bwds_next_WPRE_BC_R:
GGCTCGGAGATGTGTATAAGAGACAG
5-gaaatcatcgtcctttccttggct-3
bwds__p5_WPRE_BC_F:
5-AATGATACGGCGACCACCGAGAgcgccgatgccttgtaagtcattggtcttaaaggctc-3
PCR products were purified with Ampure (Agilent) and P7 index sequences added by an additional six cycles of PCR. PCR products were purified, quantified, pooled and single-end sequenced on an Illumina Nextseq500 with Read1 primer bwds_WPRE_bc_seqF and standard Illumina i7 primers.
bwds_WPRE_bc_seqF:
5-GCGCCGATGCCTTGTAAGTCATTGGTCTTAAAGGCTCGA-3
Analysis of FACS Data from pHAGE-GFP and pHAGE-BFP Experiments
Background percentage of contaminating barcodes in the BFP/GFP sorted cells from the mixed cells control was subtracted from numbers obtained for the pooled virus samples. Fraction of GFP cells, determined from FACS gating, was fixed and the expected fraction of barcode contamination in the BFP and GFP was simulated. Note that the expected contamination of green barcodes in the BFP sorted cells is the template switching rate multiplied by the fraction of green cells. The expected rate of contamination of BFP barcodes in the GFP sorted cells is the template switching rate multiplied by the BFP fraction (1 – GFP fraction). Sum of the squared error between observed and expected values for rates of contamination was calculated for a range of different lentivirus swap rates and minimal value was taken to be the most likely swap rate.
Note that, unlike a library of plasmids, in a mix of two plasmids, only half of all chimeric products will be detectable as many virions will be homozygous (i.e., contain the same construct, and thus chimeric products are identical to the original). To give an analogous example, in a barnyard experiment for a single-cell assay, mouse–mouse or human–human multiplets cannot be detected and thus estimated rates of ‘doublets’ have to be adjusted accordingly. When the plasmids are equimolar and the swap rate is 50%, for example, one would expect to observe a 75% rate of the intended barcode and a 25% rate of the unintended barcode. This ratio will change according to the molar concentration of the two plasmids. In Figure 1e, we assume the pool was composed of 61.7% GFP plasmid, corresponding to the fraction of GFP+ cells relative to the total number of GFP+ and BFP+ cells 4.59/(4.59+2.85) or 61.7% as explained in Supplementary Figure 5. This analysis was also performed without fixing the fraction of GFP+ cells to the value measured by FACS to ensure results were concordant (Supplementary Figure 6). The minimum sum of squared error over the grid of simulated lentivirus swap rate and fraction of GFP cells were taken to be the most likely set of parameter values.
CRISPRi Experiment
K562 expressing dCas9-BFP-KRAB (gift of the Bassik lab, Addgene 46911) and MCF10A expressing dCas9- BFP-KRAB (made by transduction with lenti_UCOE_EF1-dCas9-BFP-KRAB, plasmid, a gift of the Weissman lab (available on Addgene soon; see https://weissmanlab.ucsf.edu/CRISPR/CRISPRiacelllineprimer.pdf) were transduced with lenti-mCherry under control of a CAG promoter (pCAG_mCherry pKH143, gift of the Bassik lab, unpublished), and sorted such that the resulting population is enriched for mCherry expression.
A spacer targeting the CAG-promoter was cloned into the KHH030 (Addgene #89358), CROP-seq, and pHAGE sgRNA expression vectors. The CROP and pHAGE were modified by Q5-Site Directed Mutagenesis (NEB) to use the previously described sgRNA-(F+E)-combined optimized backbone22 (we refer to this as CROP-seq-opti). The CRISPRi mCherry+ K562 and MCF10A cells were transduced with the CAG-targeting sgRNA, and assayed for mCherry.
All virus for the CRISPRi experiments were made by the Co-operative Center for Excellence in Hematology Vector Production core. All sorting was performed on a FACS Aria II (Becton Dickinson).
Editing Rate Experiment for pHAGE-scKO
To confirm that our pHAGE-scKO vector exhibited reduced editing efficiency, we performed editing with a guide to TP53 from our screen (GAGCGCTGCTCAGATAGCGA) in both lentiGuide-Blast and pHAGE-scKO using our pCW-Cas9 MCF10A cells. Cells were passaged for 18 days post-induction of Cas9 expression with dox and gDNA was harvested using Qiagen DNeasy kit and amplified using primers CTAAATGGCTGTGAGAGAGCTCAGCCACACGCAAATTTCCTTCC and ACTTTATCAATCTCGCTCCAAACCCCCTGCCCTCAACAAGATGT. These were then amplified using KAPA HiFi Hotstart Ready Mix (KAPA) using the following indexed primers: AATGATACGGCGACCACCGAGATCTACACacgtaggcCTAAATGGCTGTGAGAGAGCTCAG
CAAGCAGAAGACGGCATACGAGAT[INDEX]gaccgtcggcACTTTATCAATCTCGCTCCAAACC
Libraries were sequenced on MiSeq and reads then processed using the method described in McKenna and Findlay et al.23
Briefly, reads are trimmed of low quality bases using Trimmomatic, merged using Flash, aligned to the reference of the locus surrounding the guide using needle, and unique genotypes are quantified. The wild-type genotype fraction was taken to be the proportion of non-wildtype alleles. We did not use UMIs in this experiment and thus it may overestimate editing rate.
KO Experiments
For all screens, each plasmid library was transfected along with plasmids provided with the ViraPower Lentiviral Expression into 293T cells. At 48 and 72h post transfection, supernatant were collected, filtered using a 40 μm steriflip filtration system (EMD Millipore). For arrayed experiments, individual plasmids were transfected and viruses produced as described above. For pHAGE-scKO and arrayed/pooled pLGB-scKO vector experiments, virus was concentrated using Peg-it virus concentration solution (SBI). Viral titer of the concentrated lentiviral library was determined by transduction of MCF10A-Cas9 cells for 48h at several viral dilutions, splitting cells into replica plates, and subjecting replica plate to blasticidin. Percent control growth was used to assess MOI. MCF10A-Cas9 cells with estimated MOIs of 0.3 carried forward.
For pHAGE-scKO and arrayed/pooled pLGB-scKO vector experiments, media was switched to 1ug/mL doxycycline to induce expression of Cas9 in pCW-Cas9 cells. LentiCas9-Blast cells were used for CROP-seq experiments. Editing was allowed take place for 14d for arrayed and pooled pLGB-scKO and 21d for pHAGE-scKO and CROP-seq experiments. Media was changed every 48h and cells were cultured every 96h. For the first half of editing, cells were cultured in the presence of 5μg/mL blasticidin and 0.5μg/mL puromycin to ensure high sgRNA and Cas9 expression.
Doxorubicin Treatment
After editing, MCF10a cells were seeded in 10cm plates plates at 1×10⁶ cells per well, allowed to attach overnight and media replaced with MCF10A media alone (mock) or MCF10A media containing 500 (arrayed and pooled pLGB-scKO experiments) or 100nM (pHAGE-scKO and CROP-seq experiments doxorubicin prepared from a 500μM stock of doxorubicin (Sigma) in water. 24h after drug exposure untreated and doxorubicin treated cells were harvested by trypsinization, washed with PBS and used for downstream assays.
Single-Cell RNA-sequencing
Cells were captured using one lane of a 10X Chromium device per sample using 10X V1 Single Cell 3′-Solution reagents (10X Genomics). Approximately 4000-7000 cells were captured per lane for each condition. Protocols were performed according to protocol, holding 10-30 ng of full length cDNA out of downstream shearing and library prep steps in order to provide material for barcode enrichment PCR.
Final libraries were sequenced on NextSeq500. 10X V1 samples were sequenced using the following read configuration:
R1: 64, R2: 5, I1: 14, I2: 8
Our initial arrayed and pooled doxorubicin treated samples using pLGB-scKO were aggregated using cellranger aggregate to normalize the average number of mapped reads per cell. This yields an average of 37,732 reads per cell, 2263 median genes per cell, and a median of 8279 UMIs per cell.
Our CROP-seq mock sample was sequenced to an average depth of 120,797 raw reads per cell in 6598 cells. A median of 4619 genes per cell were detected and a median UMI count of 22,495 per cell. Our CROP-seq doxorubicin treated sample was sequenced to an average depth of 123,445 raw reads per cell in 6283 cells. A median of 3500 genes per cell were detected and we observed a median UMI count of 15,324 per cell. At this depth the average duplication rate is approximately 78%.
Enrichment PCR
For all experiments a hemi-nested PCR starting from 5 ng of full length cDNA was used to enrich for barcodes that assign a target to each cell. PCR reactions were performed with a P7 reverse primer (as introduced by the 10X Chromium V1 oligo DT RT primer). For pHAGE-scKO and pLGB-scKO, the first PCR was performed with:
5-TCCTGGGATCAAAGCCATAGT-3
and for CROP-seq:
5-TTTCCCATGATTCCTTCATATTTGC-3
as the forward primer, priming to the blasticidin transcript with no non-templated sequence. For pLGB-scKO the second PCR was performed with:
5- TCGTCGGCAGCGTCAGATGTGTATAAGAGACAGGACGAGTCGGATCTCCCTT-3
for pHAGE-scKO with:
5-TCGTCGGCAGCGTCAGATGTGTATAAGAGACAGAACGGACTAGCCTTATTTTAACTTG-3
and for CROP-seq with:
5-TCGTCGGCAGCGTCAGATGTGTATAAGAGACAGcTTGTGGAAAGGACGAAACAC-3
as the forward primer, priming on the guide-RNA backbone in the Pol II transcript adjacent to the guide sequence and adding the standard Nextera R1 primer. Samples were indexed in a final PCR using standard Nextera P5 index primers of the form:
5-AATGATACGGCGACCACCGAGATCTACAC[10bp Index]TCGTCGGCAGCGTC-3
PCRs were cleaned with a 1.0X AmpureXP cleanup and one microliter of a 1:5 dilution of the first PCR, and 1:25 dilution of the second PCR were carried in each reaction respectively.
Digital Gene Expression Quantification
Sequencing data from each sample was processed using cellranger 1.3.1. Each lane of cells was processed independently using cellranger count, aggregating data from multiple sequencing runs. For the comparison between arrayed and pooled screens, cellranger aggregate was used to downsample data from each screen to an equal average number of mapped reads.
Assigning Cell Genotypes
Barcode enrichment libraries were separately indexed and sequenced as spike-ins alongside the whole transcriptome scRNA-seq libraries. Final UMI and cell barcode assignments were made for each read by processing these samples with cellranger 1.3.1 as was done for the whole transcriptome libraries.
A whitelist of guide or target barcode sequences was constructed using all guides or target barcodes in the library. For each read in the position-sorted BAM file output by cellranger 1.3.1, the final cell barcode and UMI are extracted. If either of these fields is not populated, indicating a problem with the sequence, the read is ignored. Using the cDNA read, we attempt to find a perfect match for the sequence preceding the guide or barcode (GTGGAAAGGACGAAACACCG for CROP-seq and CGCCTCCCGCG for pLGB-scKO). If a perfect match is not found, we attempt to locate the sequence using a striped Smith-Watterman alignment. If a match or alignment is found, the guide or barcode sequence is extracted. If the extracted sequence does not perfectly match a whitelist sequence, we search for a matching whitelist sequence within an edit distance of half the minimum edit distance between any pair of guides or barcodes in the library (rounded down). If no match is found, the molecule is ultimately discarded. Matches to the whitelist are tracked for each cell.
We also remove likely chimeric sequences using the approach outlined in Dixit24. Briefly, within each cell, we calculate the number of times a given UMI is observed with each observed guide assignment. We then divide these counts by the total instances of the respective UMI across all observed guide assignments within that cell. For UMI-guide assignment combinations where this fraction is less than 20%, we do not count the UMI towards the final observed guide assignment counts. While this has some impact on the raw data, we find the benefits to be modest.
To make a set of final assignments, we take all whitelist sequences with over 10 reads and that account for over 7.5% of the whitelist reads assigned to a given cell, where multiple sequences can be assigned to each cell. This set of assignments is merged with the filtered gene expression matrices output by cellranger such that only assignments to the filtered cells appear in the final dataset.
Note that when processing CROP-seq data without PCR enrichment, we lowered the requirement for reads supporting a given guide to 3 to account for the decreased coverage of these transcripts.
Estimation of MOI and Capture Rate
The most likely multiplicity of infection and capture rate given the distribution of guide counts per cell were estimated using the generative model described in5. Briefly, a log likelihood is calculated using a zero-truncated poisson (MOI post-selection) convolved with a binomial (incomplete capture of barcoded transcripts). This model is used to estimate the most likely set of MOI and capture rate values.
Monocle2 Usage
PCA + tSNE, density peak clustering, differential expression testing, and size factor estimation were performed using the monocle225 functions reduceDimension, clusterCells, differentialGeneTest, and estimateSizeFactors unless otherwise noted.
Removing Low Quality Cells
We consistently observed a cluster of cells with much lower UMI counts on average than the rest of the dataset when performing dimensionality reduction. To avoid including these cells in downstream analysis, we perform a simple procedure to remove any cluster with low average UMI counts. We perform PCA followed by TSNE on genes expressed in at least 50 cells for each condition, perform density peak clustering on two dimensional tSNE space, calculate the average size factor over each cluster, and filter out clusters of cells with an average size factor of 2ˆ−0.85 or lower prior to downstream analysis.
Simulating Loss in Power from Barcode Swapping
Assignments were permuted for a fraction of cells ranging from 0 to 100% and kept fixed for the remaining fraction of cells. We tested for genes differentially expressed across the target assigned to each cell (testing genes detectably expressed in at least 50 cells; full model ~target_gene). Differentially-expressed genes at FDR of 5% were counted. 10 samplings were performed for each swap rate.
For the simulation performed on our own data, cells with a single target assignment from 100nM doxorubicin treated cells in our CROP-seq experiment were taken as the starting set of cells.
For the simulation on data from Adamson et al., processed data was obtained from GEO (GSE90546). Assignment of cells to targets were used as provided on GEO and only cells noted as having high quality assignment to a single target were used. Due to the large number of cells (50,000+) in the UPR experiment from this study and the large number of differential tests required for these simulations, the number of cells assigned to each target was downsampled 2-fold to reduce runtime. We also performed tests on a dataset further downsampled to approximately 6,000 cells to illustrate the impact of initial power.
tSNE Embedding Demonstrating TP53 Enriched Cluster
20 dimensions from PCA were carried into tSNE to two dimensions. All cells including cells with guides to multiple targets and no assigned target were included in dimensionality reduction for this plot. Percentages of cells with guides to TP53 and ARID1B were calculated including cells that contain guides to multiple targets. All cells with TP53 guides were counted as TP53 cells only.
Enrichment of Tumor Suppressors in Specific Molecular States
Only cells containing a guide to a single target were considered in enrichment testing. A Chi-squared test was used to determine whether the distribution of individual sgRNAs and targets in tSNE space was significantly different from non-targeting controls at 5% FDR. Targets which did not pass this test and did not have an individual sgRNA pass the test were excluded from the subsequent enrichment tests. For each sgRNA of the remaining targets, we sought to estimate the functional editing rate (probability of a cell having a true LoF given that it received that sgRNA). Such estimates would be confounded if accounting for the possibility of edits that cause LoF for the target gene but have incomplete penetrance on the cellular phenotype. Therefore, we used an expectation maximization approach to estimate the functional edit rate of each sgRNA relative to the unknown functional edit rate of the most efficient sgRNA for a given target.
The t-SNE cluster distribution of all cells in which a given sgRNA was detected was modeled as a mixture of the t-SNE cluster distribution of cells with a functional edit for the sgRNA’s target gene and the t-SNE cluster distribution of non-targeting controls, where the mixing parameter is the relative functional edit rate for that sgRNA. In the expectation step, the t-SNE cluster distribution of cells with a functional edit for the target is estimated as the weighted average of the empirical t-SNE cluster distributions of each sgRNA for the target, weighted by the current estimates of the relative functional edit rate of the sgRNAs. In the maximization step, the relative functional edit rate of each sgRNA for the target is chosen to maximize the likelihood of the observed t-SNE cluster distribution for cells receiving that sgRNA under the multinomial mixture model.
After estimating the relative functional edit rate for each sgRNA, a weighted contingency table was constructed where the rows are targets, the columns are t-SNE clusters, and the values are weighted cell counts, where a cell’s weight is proportional to the relative functional edit rate for the sgRNA it received. Fractional values were rounded down. Fisher’s exact test was applied to this weighted contingency table to test for enrichment of targets amongst t-SNE clusters. Targets were defined as enriched at an FDR of 10%. Chi square and Fisher’s exact test were performed using R functions chisq.test and fisher.test, respectively.
Principal component and gene set enrichment analysis
Pairwise differential gene expression analysis was performed between enriched target cells and non-targeting controls for cells in all significant enriched target-cluster pairs from our enrichment testing. The union of all differentially expressed genes across targets (FDR 5%) was used to perform principal component analysis. Gene set enrichment analysis was performed on genes that had highest positive and negative loadings for principal component 1 (less than −0.02 or greater than 0.02). Gene set enrichment analysis was performed using the piano R package and the hallmarks gene set from MSigDB. Gene sets were defined as enriched at an FDR of 1%. PCA was performed using the prcomp function in R.
Data Availability
Data is available on GEO via accession GSE108699 and is also provided via the Github repository described in “Code availability.” pHAGE-GFP, pHAGE-BFP, and the CROP-seq vector with the CRISPRi-optimized backbone sequence described in the Online Methods are available on Addgene as 106281, 106282, and 106280. All CROP-seq experiments, except for the one presented in Figure 2d, were performed using the original CROP-seq vector described in reference 7. Figure 2d was performed using our own version of CROP-seq modified to contain a backbone optimized for CRISPRi available on Addgene as described above.
Code Availability
Code and information on how to access additional data files relevant for secondary analysis can be found on Github at: https://github.com/shendurelab/single-cell-ko-screens.
Plasmid Availability
pHAGE-GFP, pHAGE-BFP, and the CROP-seq vector with the CRISPRi optimized backbone sequence described in methods are available on Addgene as #106281, #106282, and #106280 respectively.
Life Sciences Reporting Summary
Further information regarding the experimental design may be found in the Life Sciences Reporting Summary.
Supplementary Material
Acknowledgments
We thank all members of the Shendure and Trapnell labs for feedback on our manuscript and helpful discussions, particularly Sanjay Srivatsan, Greg Findlay, Aaron McKenna, Riza Daza, Beth Martin, Martin Kircher, Darren Cusanovich, Xiaojie Qiu, and Vijay Ramani. We thank Professors Jesse Bloom and Douglas Fowler for discussions about lentivirus; Dr. Kyuho Han, James Ousey, and Professor Mike Bassik for experimental advice and reagents for CRISPRi experiments. AH thanks Stella the cat for support. This work was supported by the following funding: NIH DP1HG007811 and UM1HG009408 (to JS), DP2HD088158 (to CT), and the W. M. Keck Foundation (to CT and JS). AH and MG are funded by the National Science Foundation Graduate Research Fellowship. JLM is supported by the NIH Genome Training Grant (5T32HG000035) and the Cardiovascular Research Training Grant (4T32HL007828). CT is partly supported by an Alfred P. Sloan Foundation Research Fellowship. JS is an Investigator of the Howard Hughes Medical Institute.
Footnotes
Author Contributions
A.J.H., J.L.M., J.S. and C.T. devised the project. A.J.H., J.L.M., L.M.S., and M.J.G performed experiments. D.J. optimized cloning strategies and provided substantial technical support. A.J.H., J.L.M, and J.P. performed analysis. K.A.M. provided critical input on mechanisms of template switching in lentivirus. A.J.H., J.L.M., J.S. and C.T. wrote the manuscript with input from other authors.
Competing Financial Interests
The authors declare no competing financial interests.
References
- 1.Shalem O, Sanjana NE, Zhang F. High-throughput functional genomics using CRISPR–Cas9. Nat Rev Genet. 2015;16:299–311. doi: 10.1038/nrg3899. [DOI] [PMC free article] [PubMed] [Google Scholar]
- 2.Mohr SE, Smith JA, Shamu CE, Neumüller RA, Perrimon N. RNAi screening comes of age: improved techniques and complementary approaches. Nat Rev Mol Cell Biol. 2014;15:591–600. doi: 10.1038/nrm3860. [DOI] [PMC free article] [PubMed] [Google Scholar]
- 3.Xie S, Duan J, Li B, Zhou P, Hon GC. Multiplexed Engineering Analysis of Combinatorial Enhancer Activity in Single Cells. Mol Cell. 2017;66:285–299.e5. doi: 10.1016/j.molcel.2017.03.007. [DOI] [PubMed] [Google Scholar]
- 4.Adamson B, et al. A Multiplexed Single-Cell CRISPR Screening Platform Enables Systematic Dissection of the Unfolded Protein Response. Cell. 2016;167:1867–1882.e21. doi: 10.1016/j.cell.2016.11.048. [DOI] [PMC free article] [PubMed] [Google Scholar]
- 5.Dixit A, et al. Perturb-Seq: Dissecting Molecular Circuits with Scalable Single-Cell RNA Profiling of Pooled Genetic Screens. Cell. 2016;167:1853–1866.e17. doi: 10.1016/j.cell.2016.11.038. [DOI] [PMC free article] [PubMed] [Google Scholar]
- 6.Jaitin DA, et al. Dissecting Immune Circuits by Linking CRISPR-Pooled Screens with Single-Cell RNA-Seq. Cell. 2016;167:1883–1896.e15. doi: 10.1016/j.cell.2016.11.039. [DOI] [PubMed] [Google Scholar]
- 7.Datlinger P, et al. Pooled CRISPR screening with single-cell transcriptome readout. Nat Methods. 2017;14:297–301. doi: 10.1038/nmeth.4177. [DOI] [PMC free article] [PubMed] [Google Scholar]
- 8.Nikolaitchik OA, et al. Dimeric RNA recognition regulates HIV-1 genome packaging. PLoS Pathog. 2013;9:e1003249. doi: 10.1371/journal.ppat.1003249. [DOI] [PMC free article] [PubMed] [Google Scholar]
- 9.Tseng WC, Haselton FR, Giorgio TD. Transfection by cationic liposomes using simultaneous single cell measurements of plasmid delivery and transgene expression. J Biol Chem. 1997;272:25641–25647. doi: 10.1074/jbc.272.41.25641. [DOI] [PubMed] [Google Scholar]
- 10.Jetzt AE, et al. High rate of recombination throughout the human immunodeficiency virus type 1 genome. J Virol. 2000;74:1234–1240. doi: 10.1128/jvi.74.3.1234-1240.2000. [DOI] [PMC free article] [PubMed] [Google Scholar]
- 11.Schlub TE, Smyth RP, Grimm AJ, Mak J, Davenport MP. Accurately measuring recombination between closely related HIV-1 genomes. PLoS Comput Biol. 2010;6:e1000766. doi: 10.1371/journal.pcbi.1000766. [DOI] [PMC free article] [PubMed] [Google Scholar]
- 12.Sack LM, Davoli T, Xu Q, Li MZ, Elledge SJ. Sources of Error in Mammalian Genetic Screens. G3. 2016;6:2781–2790. doi: 10.1534/g3.116.030973. [DOI] [PMC free article] [PubMed] [Google Scholar]
- 13.Yu H, Jetzt AE, Ron Y, Preston BD, Dougherty JP. The nature of human immunodeficiency virus type 1 strand transfers. J Biol Chem. 1998;273:28384–28391. doi: 10.1074/jbc.273.43.28384. [DOI] [PubMed] [Google Scholar]
- 14.el-Deiry WS, et al. WAF1, a potential mediator of p53 tumor suppression. Cell. 1993;75:817–825. doi: 10.1016/0092-8674(93)90500-p. [DOI] [PubMed] [Google Scholar]
- 15.Contente A, Dittmer A, Koch MC, Roth J, Dobbelstein M. A polymorphic microsatellite that mediates induction of PIG3 by p53. Nat Genet. 2002;30:315–320. doi: 10.1038/ng836. [DOI] [PubMed] [Google Scholar]
- 16.Gasperini M, et al. CRISPR/Cas9-Mediated Scanning for Regulatory Elements Required for HPRT1 Expression via Thousands of Large, Programmed Genomic Deletions. Am J Hum Genet. 2017;101:192–205. doi: 10.1016/j.ajhg.2017.06.010. [DOI] [PMC free article] [PubMed] [Google Scholar]
- 17.Han K, et al. Synergistic drug combinations for cancer identified in a CRISPR screen for pairwise genetic interactions. Nat Biotechnol. 2017;35:463–474. doi: 10.1038/nbt.3834. [DOI] [PMC free article] [PubMed] [Google Scholar]
- 18.Lukoszek R, Mueller-Roeber B, Ignatova Z. Interplay between polymerase II- and polymerase III-assisted expression of overlapping genes. FEBS Lett. 2013;587:3692–3695. doi: 10.1016/j.febslet.2013.09.033. [DOI] [PubMed] [Google Scholar]
- 19.Yeganeh M, Praz V, Cousin P, Hernandez N. Transcriptional interference by RNA polymerase III affects expression of the Polr3e gene. Genes Dev. 2017;31:413–421. doi: 10.1101/gad.293324.116. [DOI] [PMC free article] [PubMed] [Google Scholar]
Online Methods References
- 20.Debnath J, Muthuswamy SK, Brugge JS. Morphogenesis and oncogenesis of MCF-10A mammary epithelial acini grown in three-dimensional basement membrane cultures. Methods. 2003;30:256–268. doi: 10.1016/s1046-2023(03)00032-x. [DOI] [PubMed] [Google Scholar]
- 21.Sanjana NE, Shalem O, Zhang F. Improved vectors and genome-wide libraries for CRISPR screening. Nat Methods. 2014;11:783–784. doi: 10.1038/nmeth.3047. [DOI] [PMC free article] [PubMed] [Google Scholar]
- 22.Chen B, et al. Dynamic imaging of genomic loci in living human cells by an optimized CRISPR/Cas system. Cell. 2013;155:1479–1491. doi: 10.1016/j.cell.2013.12.001. [DOI] [PMC free article] [PubMed] [Google Scholar]
- 23.McKenna A, et al. Whole-organism lineage tracing by combinatorial and cumulative genome editing. Science. 2016;353:aaf7907. doi: 10.1126/science.aaf7907. [DOI] [PMC free article] [PubMed] [Google Scholar]
- 24.Dixit A. Correcting Chimeric Crosstalk in Single Cell RNA-seq Experiments. 2016 doi: 10.1101/093237. [DOI] [Google Scholar]
- 25.Qiu X, et al. Single-cell mRNA quantification and differential analysis with Census. Nat Methods. 2017;14:309–315. doi: 10.1038/nmeth.4150. [DOI] [PMC free article] [PubMed] [Google Scholar]
Associated Data
This section collects any data citations, data availability statements, or supplementary materials included in this article.
Supplementary Materials
Data Availability Statement
Data is available on GEO via accession GSE108699 and is also provided via the Github repository described in “Code availability.” pHAGE-GFP, pHAGE-BFP, and the CROP-seq vector with the CRISPRi-optimized backbone sequence described in the Online Methods are available on Addgene as 106281, 106282, and 106280. All CROP-seq experiments, except for the one presented in Figure 2d, were performed using the original CROP-seq vector described in reference 7. Figure 2d was performed using our own version of CROP-seq modified to contain a backbone optimized for CRISPRi available on Addgene as described above.