

Abstract
Chronic lymphocytic leukemia (CLL) is an indolent B-cell malignancy in which cells reside in bone marrow, lymph nodes, and peripheral blood, each of which provides a unique microenvironment. Although the levels of certain proteins are reported to induce, changes in the CLL cell proteome in the presence of bone marrow stromal cells have not been elucidated. Reverse-phase protein array analysis of CLL cells before and 24 h after stromal cell interaction revealed changed levels of proteins that regulate cell cycle, gene transcription, and protein translation. The most hit with respect to both the extent of change in expression level and statistical significance was caveolin-1, which was confirmed with immunoblotting. Caveolin-1 mRNA levels were also upregulated in CLL cells after stromal cell interaction. The induction of caveolin-1 levels was rapid and occurred as early as 1 h. Studies to determine the significance of upregulated caveolin-1 levels in CLL lymphocytes are warranted.
Keywords: Caveolin-1, CLL, microenvironment, proteomics, stroma, duvelisib
Introduction
Chronic lymphocytic leukemia (CLL), the most common leukemia of the western world, is caused by the accumulation of CD5+ and CD19+ cells. CLL lymphocytes are neoplastic B cells with high expression of the pro-survival proteins of the Bcl-2 family [1]. CLL is a compartmentalized disease; the cells reside primarily in the bone marrow, lymph nodes, and peripheral blood. In some niches, the cells are not only highly proliferative, but also have active mRNA transcription and protein translation. Each compartment provides a unique microenvironment for CLL lymphocytes [2].
The microenvironment plays a major role in protecting CLL cells from spontaneous and drug-induced apoptosis [3]. CLL cells interact with other supporting cells and secrete chemokines in the microenvironment [4,5]. Bone marrow stromal cells (BMSCs) confer a survival advantage to CLL cells [3] by several mechanisms, including the B-cell receptor (BCR) signaling pathway, which is pivotal for the survival, maintenance, proliferation, and migration of CLL lymphocytes [6].
A previous comparison of mRNA array results identified several genes differentially expressed among CLL cells from diverse resident tissues [7]. Whereas, lymph node niches activated genes involved in the cell cycle, those in bone marrow niches augmented survival factors [8]. In vitro studies revealed that in the presence of BMSCs, CLL cells have upregulated expression of various molecules, including MCL-1, BCL-2, BCLXL, and BIMEL [7,9,10], and have active signaling pathways that regulate survival, proliferation, and metabolism that can be assessed by measuring phosphoprotein levels of AKT, p-MAPK, and p-STAT3 [1,11]. Although mRNA arrays of CLL cells after coculture with stromal cells have been performed for gene expression profiling [10,12], changes in the CLL proteome have not yet been elucidated.
The NK.Tert cell line is a human bone marrow-derived cell line that has been used extensively in in vitro studies to characterize CLL-stroma interactions, as it mimics the bone marrow microenvironment. These in vitro culture conditions recapitulate in vivo observations regarding the induction of gene transcription. We performed reverse-phase protein array (RPPA) analysis of peripheral blood CLL B lymphocytes that were either maintained in suspension culture or cocultured with stromal cell lines to profile immediate changes in signaling pathways. The RPPA contained 210 proteins, including proteins involved in signaling pathways; transcription and translation; cell cycle and cell proliferation; and DNA damage response and repair.
Our findings suggest that stromal cells activate proteins that regulate the cell cycle, gene transcription, and protein translation in CLL cells. However, another protein that was the most hit among the proteins that were upregulated in the presence of stroma is caveolin-1. Caveolin-1 is an integral membrane protein, which is an essential component of caveolae. We sought to determine the mechanism of its upregulation and its role in CLL biology.
Materials and methods
Patient sample collection
We collected peripheral blood samples from 31 CLL patients treated at The University of Texas MD Anderson Cancer Center (Supplemental Table 1). All patients provided written informed consent in accordance with the Declaration of Helsinki and under a protocol approved by MD Anderson’s Institutional Review Board.
Drugs
The PI3K δ/γ inhibitor duvelisib (IPI-145) was obtained from Infinity Pharmaceuticals. In all experiments, cells were treated with 1 μM duvelisib in dimethyl sulfoxide.
Cell isolation and coculture
Peripheral blood mononuclear cells were separated by the Ficoll–Hypaque density gradient centrifugation (Atlanta Biologicals, Flowery Branch, GA) and cultured in RPMI-1640 medium with L-glutamine plus 10% of human serum. All experiments were performed using freshly isolated CLL cells from peripheral blood samples; the purity of this cell population was ≥95%. For coculturing, NK.Tert stromal cell line was used and the ratio was kept 100 CLL cells to 1 stromal cell and were generally cultured for 24 h except for time course studies when different time points were used. For some experiments, M210B4, murine stromal cells were used; again at a ratio of 1 stromal cell to 100 CLL cells.
Immunoblotting
Cells were washed and protein extracts were probed using an Odyssey Infrared Imaging System (LI-COR Biosciences, Lincoln, NE) as described previously [13]. Primary antibodies against caveolin-1 and glyceraldehyde-3-phosphate dehydrogenase (GAPDH) were obtained from Cell Signaling Technology (Danvers, MA).
RNA extraction and real-time reverse transcription polymerase chain reaction (RT-PCR)
CLL cells in suspension or cocultured with stromal cells were subjected to RT-PCR. RNA was extracted from CLL cells using the Qiagen RNA isolation kit according to the manufacturer’s instructions, and RNA quantity was measured using ultraviolet spectroscopy with a Nanodrop 2000 Spectrophotometer. Taqman gene expression probes (Hs00971716_m1) were used for caveolin-1 RT-PCR. The internal control was 18s ribosomal mRNA.
RPPA analysis
CLL cells in suspension and after 24-h coculture with NK.Tert cells (n = 10 for each condition) were washed with 1 × phosphate-buffered saline. The cells were lysed and denatured with 1 × lysis buffer with sodium dodecyl sulfate, and 40 μg of protein was sent to MD Anderson’s Functional Proteomics RPPA Core Facility for RPPA analysis. The sample lysates were serially diluted and arrayed on nitrocellulose-coated plates. The slides were stained with 217 antibodies; however, seven antibodies that had unusual reactivity with the tissue samples were removed. Of the remaining 210 antibodies, 60 were for detecting phosphoproteins (Supplemental Table 2). The slides were probed with different antibodies, and the signal was detected by diaminobenzidine colorimetric reaction. Spot density was measured using MiroVigene software (Vigene Tech Inc., Carlisle, MA), and protein concentrations were defined with the ‘Super Curve Fitting’ method. The data were then normalized for protein loading.
Sandwich enzyme-linked immunosorbent assay (ELISA)
Caveolin-1 protein levels in cell culture supernatant and cells were assessed using the PathScan sandwich ELISA kit (Cell Signaling Technology).
BCR knockout
CRISPR-Cas9 px330 plasmids with BCR target DNA sequence constructs were donated by Dr. Eric Davis (Department of Lymphoma/Myeloma, MD Anderson). JeKo-1 cells were transfected with 10 μg of plasmid DNA/1 million cells by electroporation with the Neon transfection system (Thermo Fisher Scientific, Sugar Land, TX) according to the manufacturer’s protocol. Seventy-two hours after transfection, the cells were stained and analyzed by flow cytometry for BCR heavy chain (IgM) and light chain (Igκ) expression. BCR knockout (KO) cells were stained and sorted by fluorescence-activated cell sorting on day 6. We generated three KO clones in which the Cas9 construct harbored DNA sequences complimentary to different regions of CH2 domain of BCR (TS4: CCCCCGCAAGTCCAAGCT CATC; TS5: CAGGTGTCCTGGCTGCGCGAGGG; TS6: ACCT GCCGCGTGGATCACAGGGG).
Anti-IgM treatment
CLL cells were cultured in RPMI-1640 medium and were either not treated or incubated with 10 μg of IgM for 24 h for BCR stimulation. Cells were then washed with 1 × PBS and pelleted. Protein lysates were made and used for immunoblot for caveolin-1 and GAPDH protein levels.
Statistical analysis
The raw RPPA data were normalized to the loading control and log2-transformed. A paired t-test was used to assess differences in protein expression between CLL cells in suspension and CLL cells cocultured with stromal cells. To account for multiple testing, we estimated the false discovery rates (FDRs) of the paired tests using the Benjamini–Hochberg method for data [14]. One-way analyses of variance were performed using Prism 6 software (GraphPad Software, San Diego, CA) with p < .05 as level of significance.
Differences in individual protein expression levels between cells cultured in suspension and those cocultured with BMSCs were assessed with a two-tailed paired t-test with the null hypothesis Ho: μstroma = μsuspension, where μ designates the mean RPPA readout of all samples. We used a volcano plot, which monitors the statistical significance (p values from the t-test) on the y-axis and log fold changes of readouts in stromal versus suspension cultures on the x-axis, to visualize and analyze the distribution of statistically significant versus high-amplitude responses.
Results
Proteomics profiling of CLL cells identifies modulation of several proteins
CLL cells obtained from the peripheral blood of 10 different patients were cocultured with NK.Tert cells for 24 h. An RPPA assay was used to assess the expression of 210 proteins in these samples (Figure 1(A)). The endogenous (in suspension culture) expression levels of each protein varied. After coculture, most proteins’ expression levels were unchanged, but several protein levels were significantly higher or lower (Figure 1(B)). The volcano plot clearly indicated that more protein levels were significantly increased than decreased. Furthermore, using a cutoff of a 20% increase or decrease in expression level, we identified only six proteins, all of which had increased expression.
Figure 1.
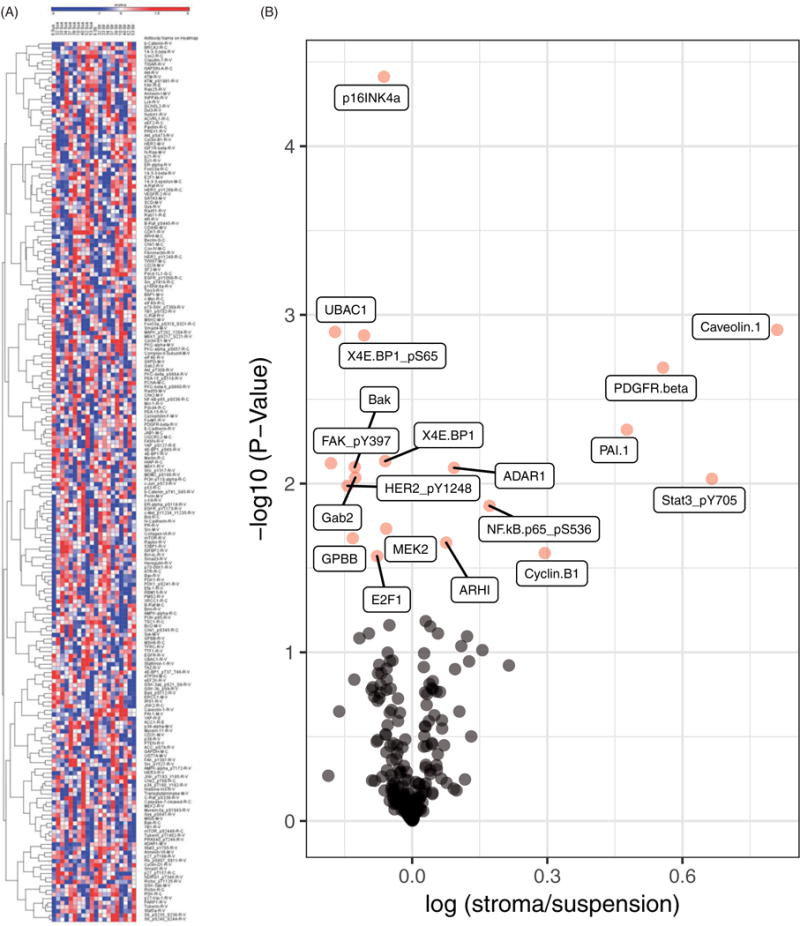
Stromal cells modulate protein levels in CLL cells. (A) Heat map generated based on RPPA data for 10 patients’ CLL cells in suspension or cocultured with stromal cells for 24 h. CLL cells were cocultured with NK.Tert cells for 24 h and CLL cell lysates were analyzed for RPPA. Unsupervised clustering of protein was generated using R software. Each column in the heatmap represents the protein expression profile of a single patient’s peripheral blood B cells either in suspension or cocultured with stromal cells. (B) Volcano plot showing the fold-increase or -decrease of protein levels in CLL cells cocultured with stromal cells and the respective p values. Proteins in pink are significantly modulated.
Changes in caveolin-1, PDGFRβ, PAI1, and cyclin B1 were statistically significant and had a more than 20% of increase (Figure 2(A–D)). Caveolin-1 protein levels were low in CLL cells and ranged between 0.05 and 0.07. After stromal interaction, the levels increased in all samples (p = .001) although the extent of increase varied (Figure 2(A)). Endogenous levels of PDGFRβ was heterogeneous and showed an increase in 8 of 10 samples when cocultured on stroma (p = .002) (Figure 2(B)). PAI1 protein expression was fairly similar in 10 samples that were evaluated. All showed upregulation in PAI1 levels after coculture (p = .005) (Figure 2(C)). Cell cycle protein cyclin B1 in CLL lymphocytes showed an upward trend after interaction with stroma (p = .026); however, there was a decline in one sample (Figure 2(D)). The phosphorylation levels (not the total protein levels) of STAT3-pY705 and pS563 of the p65 subunit of NF-κB were increased (Figure 2(E,F)). Except for one sample, all samples showed noticeable increase in phospho Stat-3 levels (p =.009) while the phospho p65 unit of NF-κB was only modestly changed (p = .014). A minor but statistically significant increase was observed in ADAR1 (p =008) and ARHI (p = .022), and cyclin D1 showed a trend (p =.065) (Supplemental Figure 1(A–C)). The expression of several proteins in CLL cells cocultured with stromal cells was decreased (Supplemental Figure 2(A–M)). The extents of decline in these proteins were minor; however, they were statistically significant or marginally significant (RAB11 and p27_pT157). The p values are included in each graph. These proteins included cell surface receptors and proteins related to the cell cycle, protein translation, and apoptosis (Supplemental Figure 2(A–M)).
Figure 2.
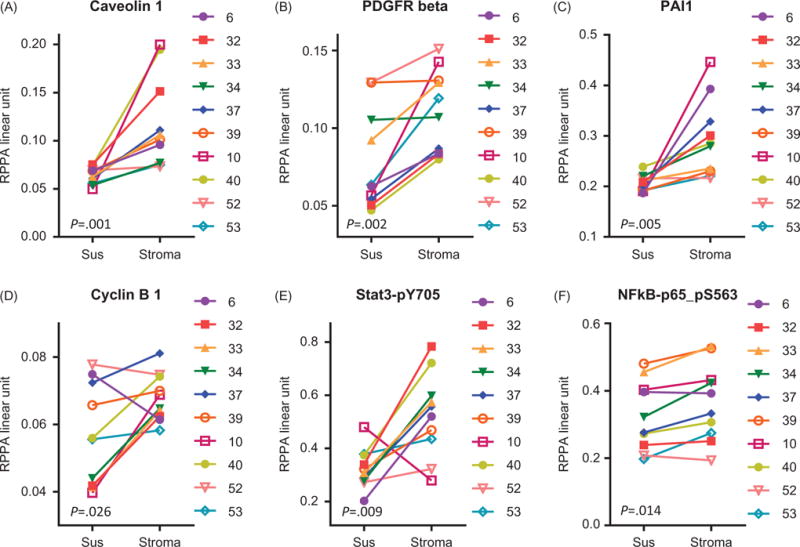
Top six modulated proteins after coculture with stromal cells. RPPA data showing top six proteins that were significantly increased and increased by more than 20% in CLL cells after interaction with stromal cells. Cells were cultured in suspension (Sus) or on stroma and protein amounts were analyzed by RPPA assay. The proteins were caveolin-1 (A), PDGFRβ (B), PAI1 (C), cyclin B1 (D), phospho-STAT3 at the Y705 site (E), and the phospho-p65 subunit of NF-κB-Ser 563 (F). Each symbol represents a different patient sample; corresponding patient numbers are indicated at the right of each graph.
Several findings led us to focus on caveolin-1 levels. First, endogenous caveolin-1 levels were very low (0.05–0.07) in all 10 samples. Second, these levels were increased in all samples cocultured with NK.Tert stromal cells, although the extent of increase was variable. Third, caveolin-1 was the top hit among the more than 200 proteins that were assessed by RPPA analysis. Fourth, increased caveolin-1 levels in CLL cells and their modulation by stromal cells has not been investigated.
Caveolin-1 levels in CLL cells are upregulated after coculture with stromal cells
In the RPPA analysis, caveolin-1 emerged as a top hit among the proteins whose levels in CLL cells were significantly upregulated after coculture. To validate this finding, we analyzed the lysates of four RPPA samples and two additional samples by Western blotting, which revealed a stark increase in caveolin-1 protein levels after 24 h of coculture in all samples (Figure 3(A)). We conducted time-course experiments to determine the minimum time needed for stromal cells to induce caveolin-1 expression in CLL cells. To decipher the time at which the changes in the levels of protein are noticeable and the duration for which they are maintained, we tested three samples at 6, 12, 18, 24, and 48 h after coculture with stromal cells. Caveolin-1 levels were increased at 6 h, and these levels were maintained or increased further for up to 48 h (Figure 3(B)). Furthermore, even as early as 1 h after the start of coculture, the induction in the protein levels was observed (Figure 3(C)).
Figure 3.
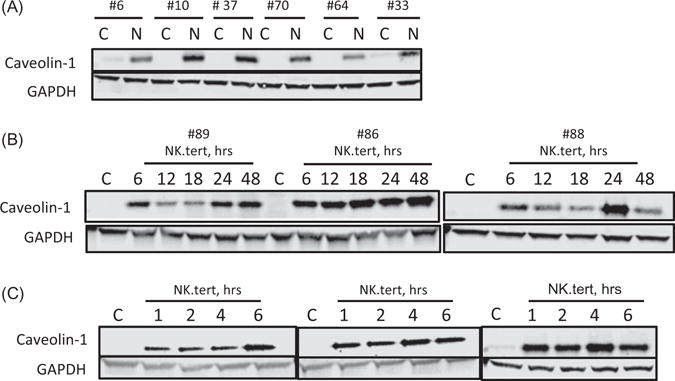
Caveolin-1 protein levels are upregulated in CLL cells interacting with NK.Tert stromal cells. The caveolin-1 expression levels of CLL cells cultured without (C) or with stromal cells for the indicated times were assessed. (A) Immunoblot analysis of six patients’ CLL cells in suspension culture (C) or in cocultures with NK.Tert stromal cells (N) for 24 h. (B and C) Time-dependent modulation of caveolin-1 protein levels in CLL cells in suspension (C) or in cocultures with stromal cells for the indicated times. The patient number is indicated above each immunoblot.
Caveolin-1 protein levels in CLL cells are upregulated with other stromal cell lines
To determine whether CLL cells’ interaction with other stromal cell lines results in similar increases in caveo-lin-1 levels in CLL cells, we conducted experiments with the murine bone marrow-derived stromal cell line M2-10B4. CLL caveolin-1 levels were upregulated after coculture with M2-10B4 cells (Figure 4(A)). Immunoblotting revealed that both NK.Tert and M2-10B4 cells have endogenous levels of caveolin-1 (Figure 4(B)).
Figure 4.
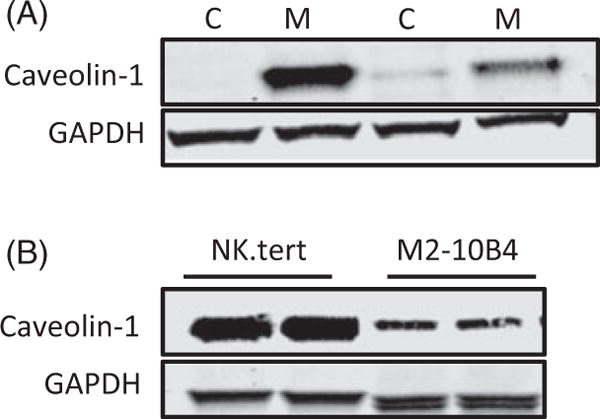
Caveolin-1 protein levels are upregulated in CLL cells with other stromal lines. (A) Immunoblot analysis of two patients’ CLL cells in suspension (C) or in cocultures with M2-10B4 (M) cells for 24 h. (B) Endogenous caveolin-1 levels were tested in two cultures of NK.Tert and M2-10B4 stromal cells. GAPDH was used as loading control.
Stromal cells upregulate caveolin-1 mRNA levels in CLL cells
To determine whether the increase in protein expression also occurred at the transcriptional level, we subjected cells from CLL samples (n = 8; p = .04) cocultured with NK.Tert cells for 24 h to real-time RT-PCR. Caveolin-1 transcript levels were significantly augmented in six of the eight samples (Figure 5(A)). Of these six samples, three displayed exceedingly high increases (20- to 60-fold) in caveolin-1 mRNA that did not necessarily translate into similar amplification of protein expression. The induction in the level also occurred as early as 1 h and increased further with prolonged culturing with stromal cells (Figure 5(B)); however, this was not statistically significant when analyzed as paired values for each time point. The cumulative effect over multiple time points is statistically significant (p = .014), but we do not have enough samples to explain the time resolution.
Figure 5.
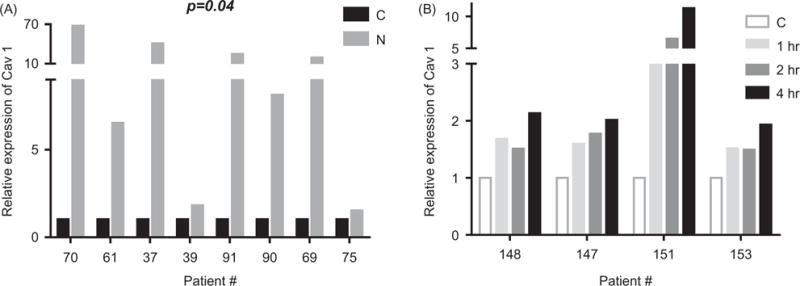
Caveolin-1 mRNA levels are upregulated in CLL cells interacting with NK.Tert stromal cells. (A) RT-PCR analysis for caveolin-1 levels in CLL cells in suspension (C) versus CLL cells 24 h after coculture with NK.Tert (N) cells. (B) RT-PCR analysis for caveolin-1 levels in CLL cells in suspension (C) versus CLL cells cocultured with NK.Tert cells for 1, 2, and 4 h. Patient number is listed on the abscissa.
Stromal cells induce caveolin-1 expression in CLL cells
Within minutes of coculture with stromal cells, CLL cells had significantly augmented caveolin-1 expression, indicating that caveolin-1 may be transferred from stromal cells to CLL cells. Therefore, we used ELISA to assess four patients’ CLL cells before and after cocultures, NK.Tert cells alone, and supernatants from the cocultures (Figure 6). Caveolin-1 protein levels in the coculture supernatant were minimal, whereas protein levels in CLL cells after coculture were relatively higher for the same amount of protein loaded. In contrast, caveolin-1 levels were 20–40 times higher in NK.Tert cells.
Figure 6.
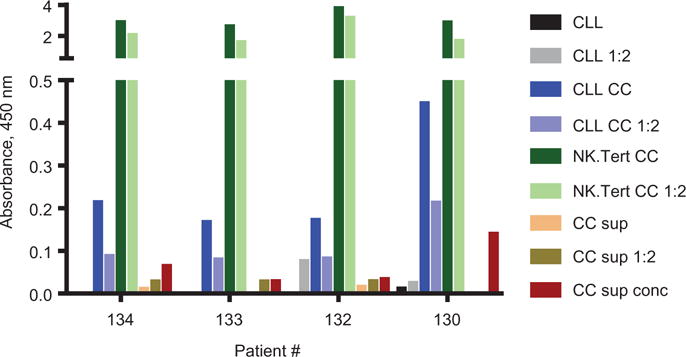
Upregulation of caveolin-1 protein levels in CLL cells and secretion of caveolin-1 in medium. Caveolin-1 levels in CLL cells after coculture with stromal cells were measured by ELISA. Protein lysates of CLL cells before (CLL) and after coculture (CLL CC) from four different patient samples and NK.Tert (NK.Tert CC) cells after coculture were loaded onto precoated 96-well plates along with coculture supernatants (CC Sup,100 μL), in one-fold dilution (1:2).
Role of BCR signaling in caveolin-1 biogenesis and turnover in malignant B cells
On the basis of existing evidence of caveolin-1’s interaction with BCR signaling downstream effectors [15], we investigated if the BCR pathway has a role in the stromal cell-mediated increase in CLL caveolin-1 levels. We first sought to determine whether the effect of coculture on caveolin-1 levels in CLL can be recapitulated in other B-cell malignancies and found that Jeko-1, a malignant B-cell line, cocultured with two different stromal cell lines showed a similar increase in caveolin-1 levels at different time points (Supplemental Figure 3). Therefore, we then generated BCR KO clones using the Jeko-1 cell line and cocultured them with NK.Tert cells for 24 h. In WT Jeko-1 cells, there was an increase in caveolin-1 protein level, in three BCR KO clones there was some heterogeneity, but in each case there was an increase in caveolin-1 levels after stromal coculture suggesting that interrupting B-cell signaling did not inhibit upregulation of the expression of caveolin-1 proteins in these cells (Figure 7(A)).
Figure 7.
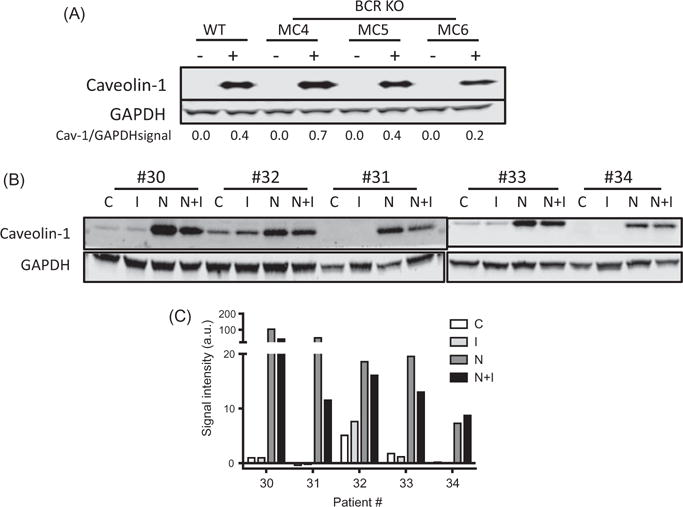
Duvelisib mitigates stromal cell-induced caveolin-1 levels in CLL. (A) Caveolin-1 protein expression levels in B-lymphoma cell lines before and after BCR KO and in the absence (−) or presence (+) of NK.Tert stromal cells. (B) CLL cells were treated with duvelisib (I), cocultured with NK.Tert cells (N), treated with duvelisib in the presence of stromal cells for 24 h (N + I), or left untreated (C). (C) CLL cells from five patient samples were analyzed for caveolin-1 protein levels by immunoblotting. The densitometry plot of the blot is shown. Paired one-tailed Student’s t-test was done to compare C with I, C with N, and N with NI.
We utilized pharmacological inhibitors to determine whether pivotal players in B-cell signaling, such as PI3K and BTK, affect caveolin-1 upregulation in CLL cells cocultured with stromal cells. Five patients’ CLL cells in suspension or cocultured with NK.Tert cells were incubated with duvelisib for 24 h. Duvelisib did not affect the endogenous caveolin-1 levels in CLL cells (p = .258). Coculture with stroma upregulated caveolin-1 levels (p =.048) which was not significantly affected by duvelisib (p =.078) (Figure 7(B,C)).
To further evaluate role of BCR in stroma-mediated upregulation of caveolin-1 protein levels, we stimulated BCR pathway by anti-IgM in CLL cells from three patients. The caveolin levels were low and undetectable in control untreated cells. This was not changed by anti-IgM treatment (Supplemental Figure 4).
Association between caveolin-1 levels and prognostic factors for the disease
We compared and correlated RPPA data for caveolin-1 expression level in 10 CLL patient samples with several prognostic factors (Supplemental Figure 5). The number of samples is low; however, there was no relationship between caveolin-1 levels and number of prior therapies, stage of disease, IGHV, and ZAP70 status. Among WBC and lymphocyte counts in peripheral blood, and B2M and LDH levels, there was mild linear relationship between % of lymphocytes and levels of caveolin-1 (r2 = 0.42; p = .044). We also analyzed these values with caveolin-1 levels in CLL cells after stroma coculture. No statistically significant relationships were observed (data not shown).
Discussion
Our studies demonstrate that after their coculture with stromal cells, CLL cells overexpressed several proteins, including phosphoproteins such as STAT3 and NF-κB. Both STAT3 and NF-κB phosphorylation suggest activation of these two transcription factors. Activation of NF-κB is associated with aggressive CLL as well as pathogenesis. Stimulation of the BCR activates both NF-κB and STAT3 in CLL cells [16,17]. A previous study showed that high levels of STAT3 induce apoptosis in CLL cells from patients with high peripheral blood lymphocyte counts [18]. In contrast, another study reported that the inhibition of STAT3 induces apoptosis in CLL cells [19]. Unstimulated CLL B cells, which express the CD40 ligand, bind to NF-κB [20]. CLL cells cocultured with bone marrow stromal fibroblasts have been shown to have an activated NF-κB signaling pathway and upregulated expression of genes involved in cell cycle progression and DNA repair [21]. In addition, STAT3 also activates NF-κB expression in CLL cells [22].
We also found that the total protein levels of PDGFRβ, PAI1, and cyclin B1 were increased in CLL cells after their coculture with stromal cells. Although the levels of many other proteins were increased or decreased in CLL cells after interaction with stromal cells, the extent of change in those proteins’ levels was less than 20%. PDGFβ and PDGFRβ’s expression mediates PDGF autocrine signaling, which may be important in the malignant transformation of B-CLL [23]. Also, PDGFβ secretion by CLL cells selectively activates mesenchymal stem cells in the microenvironment and aids in their proliferation [24]. The effect of PAI1 and cyclin B1 in CLL has not been studied. However, the induction of cyclin B1 and cyclin D1 in the present study (Supplemental Figure 1) indicates that stromal cells may initiate the cell cycle progression of otherwise replicationally quiescent CLL cells.
In addition to these above-mentioned proteins, the present study also demonstrates that CLL cells cocultured with stromal cells had increased caveolin-1 levels and better survival. Caveolin-1 was upregulated rather quickly, which may explain the adhesion of CLL cells to stromal cells. Caveolin-1 was not among the many growth factors and molecules in CLL that were studied in the context of the microenvironment. Therefore, we decided to investigate caveolin-1 expression in CLL cells cocultured with BMSCs, as the microenvironment likely regulates caveolin-1 expression and/or function, since the microenvironment changes the biology of CLL cells in multiple ways.
Whether normal murine B lymphocytes express caveolin-1 is unclear; a substantial amount of caveolin-1 was found in normal murine splenic B lymphocytes and was shown to negatively interact with Bruton’s tyrosine kinase [15]. On the other hand, in another study with immunohistochemical analysis, no detectable level of caveolin-1 was present in unstimulated mouse B lymphocytes [25], whereas human mature plasma cells stained positively for caveolin-1 [25]. Levels of caveolin-1 in murine B cells [25] or murine macrophages [26] are induced after stimulation with lipopolysaccharides. Gene expression profiling revealed differential expression of caveolin-1 mRNA in human malignant CLL B lymphocytes depending on the tissue residency [27]. The present study demonstrates that CLL cells’ in vitro interaction with the microenvironment positively impacts caveolin-1 mRNA and protein levels.
In the present study, the caveolin-1 expression level of CLL cells in suspension culture was almost below the level of detection. One possible explanation for the increase in caveolin-1 level after stromal interaction is that the CLL cells are soiled with stromal cells. This is a concern as stromal cells contain high level of caveolin-1 (Figure 4(B)). However, we are sure that the increase of caveolin-1 protein in CLL cells was not due to contamination, as we took precautions to avoid accidentally collecting stromal cells while harvesting CLL cells from cocultures. In addition, stromal cells adhere very well to the plastic, whereas the non-adherent CLL cells float and can be collected without disrupting the adherent cells. Furthermore, the ratio of stromal cells to CLL cells in the cocultures was 1:100. Thus, even if all stromal cells were collected with CLL cells, the rate of stromal cell contamination would be <1%, which is not sufficient to provide the signal detected in the RPPA (Figure 2(A)), immunoblotting (Figures 3 and 4), and RT-PCR assays (Figure 5). Caveolin-1 may have been secreted by stromal cells and taken up by CLL lymphocytes. Such a phenomenon occurs when prostate cancer cells are cultured with recombinant caveolin-1 protein; the endothelial cells, through either caveolae- or clathrin-dependent mechanisms, take up the exogenous recombinant protein [28].
Caveolin-1 is an integral membrane protein and an essential component of caveolae [29]. Caveolae are invaginations in the surfaces of the cell membranes of several cell types [30,31]. Caveolin-1 is implicated in diverse cellular functions, including vesicular transport, motility, signaling, survival, metastasis, and angiogenesis [32–36]. Further, certain cancer cells secrete caveolin-1 into the serum [37]. Caveolin-1 is necessary for hematopoietic cell survival and function [38]. It also serves as a predictive biomarker for several cancers, including prostate and gastric cancers [39,40]. Consistent with this statement, caveolin-1 expression in stromal cells dictates cancer progression [41–44]. On the other hand, the downregulation of caveolin-1 expression in stromal fibroblasts in breast cancer leads to early relapse [45].
Caveolin-1 can function as an oncogene or as a tumor suppressor gene. For example, caveolin-1 activates the PI3K/AKT pathway in multiple myeloma and prostate cancer [46,47], but inhibits PI3K activity by ceramide in rat fibroblasts and in breast cancer cells [48,49]. In acute myeloid leukemia, caveolin-1 gene expression is correlated with multidrug resistance [50]. The oncogenic transformation of the NIH3T3 cell line by several oncogenes decreases caveolin-1 mRNA and protein [51]. In contrast, upregulated caveolin-1 protein levels downregulate p42/44 MAP kinase activity [52], whereas the reverse was observed when caveolin-1 levels were reduced [53]. Caveolin-1 is necessary for lipid transport and plays an important role in signal transduction in several cancers [54,55], but is regulated differently by the same upstream or downstream genes in different cancers [55]. In prostate cancer, caveolin-1 is regulated by c-MYC [56]. Therefore, caveolin-1 knockdown or overexpression has been reported to have contrasting outcomes owing to the differential regulation of signaling cascades. This protein has gained interest because of its diverse roles in cancer and its potential as a new therapeutic target [57].
In CLL, caveolin-1 overexpression is related to poor clinical outcome, in the same study, it was reported that compared to blood or bone marrow CLL lymphocytes, lymph node resident CLL cells express higher caveolin-1 [27]. In the present study, we found that CAV-1 gene expression was significantly higher in CLL cells on stromal cells (Figure 5). In line with these data, knockdown of caveolin-1 decreased CLL cell migration and survival. Further, immune synapse formation between T lymphocytes and CLL cells is compromised in cells lacking caveolin-1 [27]. In vivo studies have demonstrated that caveolin-1 is necessary for CLL development [58]. Caveolin-1 has also been shown to enhance MAPK signaling to regulate CLL cell survival. Collectively, these findings suggest that caveolin-1 provides a survival benefit to CLL cells. Previous studies have established that stroma provides a survival benefit to CLL cells. Our finding that caveolin-1 is increased in CLL cells cocultured with stromal cells provides a potential link between caveolin-1 and enhanced survival of CLL cells.
One mechanism by which caveolin-1 can enhance CLL cell survival is through signal transduction. Caveolin-1 in the lipid raft has been shown to amplify intracellular signaling. Several proteins involved in cellular signaling, such as heterotrimeric G-proteins [59], Bruton’s tyrosine kinase [15], and nitric oxide synthase [60] interact with caveolin-1. Akt and Wnt signaling pathways are activated by caveolin-1 in prostate cancer [28,61]. The structure of the caveolin-1 protein, especially its scaffolding domain, is conducive to protein–protein interactions [59]. In line with these reports, caveolin-1 has been implicated in the regulation of AKT and MAPK, which are associated with metabolism and cell survival, and that of anti-apoptotic proteins such as MCL-1 [62].
In conclusion, using proteomics profiling, we identified a new protein, caveolin-1 that is significantly and consistently augmented in CLL cells after these lymphocytes interact with stromal cell lines. Further studies to determine caveolin-1’s biological role in CLL cells and its suitability as a target for future drug development are warranted.
Supplementary Material
Acknowledgments
This work was supported in part by the National Institutes of Health through grant P01 CA81534, CLL-Global Research Foundation Alliance grant, and MD Anderson’s Cancer Center Support Grant P30 CA016672. Authors thank Joe Munch, Department of Scientific Publications, for carefully reviewing and editing the manuscript.
Footnotes
Supplemental data for this article can be accessed here.
Potential conflict of interest: Disclosure forms provided by the authors are available with the full text of this article online at https://doi.org/10.1080/10428194.2017.1376747.
References
- 1.Balakrishnan K, Burger JA, Fu M, et al. Regulation of Mcl-1 expression in context to bone marrow stromal microenvironment in chronic lymphocytic leukemia. Neoplasia. 2014;16:1036–1046. doi: 10.1016/j.neo.2014.10.002. [DOI] [PMC free article] [PubMed] [Google Scholar]
- 2.Mittal AK, Iqbal J, Nordgren TM, et al. Molecular basis of proliferation/survival and migration of CLL in peripheral blood, bone marrow and lymph nodes. Blood. 2008;112:204–205. [Google Scholar]
- 3.Kurtova AV, Balakrishnan K, Chen R, et al. Diverse marrow stromal cells protect CLL cells from spontaneous and drug-induced apoptosis: development of a reliable and reproducible system to assess stromal cell adhesion-mediated drug resistance. Blood. 2009;114:4441–4450. doi: 10.1182/blood-2009-07-233718. [DOI] [PMC free article] [PubMed] [Google Scholar]
- 4.Till KJ, Spiller DG, Harris RJ, et al. CLL, but not normal, B cells are dependent on autocrine VEGF and alpha4-beta1 integrin for chemokine-induced motility on and through endothelium. Blood. 2005;105:4813–4819. doi: 10.1182/blood-2004-10-4054. [DOI] [PubMed] [Google Scholar]
- 5.de Totero D, Meazza R, Capaia M, et al. The opposite effects of IL-15 and IL-21 on CLL B cells correlate with differential activation of the JAK/STAT and ERK1/2 pathways. Blood. 2008;111:517–524. doi: 10.1182/blood-2007-04-087882. [DOI] [PubMed] [Google Scholar]
- 6.Herman SE, Gordon AL, Hertlein E, et al. Bruton tyrosine kinase represents a promising therapeutic target for treatment of chronic lymphocytic leukemia and is effectively targeted by PCI-32765. Blood. 2011;117:6287–6296. doi: 10.1182/blood-2011-01-328484. [DOI] [PMC free article] [PubMed] [Google Scholar]
- 7.Herishanu Y, Perez-Galan P, Liu D, et al. The lymph node microenvironment promotes B-cell receptor signaling, NF-kappaB activation, and tumor proliferation in chronic lymphocytic leukemia. Blood. 2011;117:563–574. doi: 10.1182/blood-2010-05-284984. [DOI] [PMC free article] [PubMed] [Google Scholar]
- 8.Herndon TM, Chen SS, Saba NS, et al. Direct in vivo evidence for increased proliferation of CLL cells in lymph nodes compared to bone marrow and peripheral blood. Leukemia. 2017;31:1340–1347. doi: 10.1038/leu.2017.11. [DOI] [PMC free article] [PubMed] [Google Scholar]
- 9.Burger JA, Burger M, Kipps TJ. Chronic lymphocytic leukemia B cells express functional CXCR4 chemokine receptors that mediate spontaneous migration beneath bone marrow stromal cells. Blood. 1999;94:3658–3667. [PubMed] [Google Scholar]
- 10.Patel V, Chen LS, Wierda WG, et al. Impact of bone marrow stromal cells on Bcl-2 family members in chronic lymphocytic leukemia. Leuk Lymphoma. 2014;55:899–910. doi: 10.3109/10428194.2013.819573. [DOI] [PMC free article] [PubMed] [Google Scholar]
- 11.Capron C, Jondeau K, Casetti L, et al. Viability and stress protection of chronic lymphoid leukemia cells involves overactivation of mitochondrial phosphoSTAT3Ser727. Cell Death Dis. 2014;5:e1451. doi: 10.1038/cddis.2014.393. [DOI] [PMC free article] [PubMed] [Google Scholar]
- 12.Shull AY, Noonepalle SK, Awan FT, et al. RPPA-based protein profiling reveals eIF4G overexpression and 4E-BP1 serine 65 phosphorylation as molecular events that correspond with a pro-survival phenotype in chronic lymphocytic leukemia. Oncotarget. 2015;6:14632–14645. doi: 10.18632/oncotarget.4104. [DOI] [PMC free article] [PubMed] [Google Scholar]
- 13.Stellrecht CM, Vangapandu HV, Le XF, et al. ATP directed agent, 8-chloro-adenosine, induces AMP activated protein kinase activity, leading to autophagic cell death in breast cancer cells. J Hematol Oncol. 2014;7:23. doi: 10.1186/1756-8722-7-23. [DOI] [PMC free article] [PubMed] [Google Scholar]
- 14.Benjamini Y, Drai D, Elmer G, et al. Controlling the false discovery rate in behavior genetics research. Behav Brain Res. 2001;125:279–284. doi: 10.1016/s0166-4328(01)00297-2. [DOI] [PubMed] [Google Scholar]
- 15.Vargas L, Nore BF, Berglof A, et al. Functional interaction of caveolin-1 with Bruton’s tyrosine kinase and Bmx. J Biol Chem. 2002;277:9351–9357. doi: 10.1074/jbc.M108537200. [DOI] [PubMed] [Google Scholar]
- 16.Brophy S, Quinn FM, O’Brien D, et al. The regulation of STAT3 and its role in the adhesion and migration of chronic lymphocytic leukaemia cells. Blood. 2016;128:4347. [Google Scholar]
- 17.Rozovski U, Wu JY, Harris DM, et al. Stimulation of the B-cell receptor activates the JAK2/STAT3 signaling pathway in chronic lymphocytic leukemia cells. Blood. 2014;123:3797–3802. doi: 10.1182/blood-2013-10-534073. [DOI] [PMC free article] [PubMed] [Google Scholar]
- 18.Rozovski U, Harris DM, Li P, et al. At high levels, constitutively activated STAT3 induces apoptosis of chronic lymphocytic leukemia cells. J Immunol. 2016;196:4400–4409. doi: 10.4049/jimmunol.1402108. [DOI] [PMC free article] [PubMed] [Google Scholar]
- 19.Severin F, Frezzato F, Martini V, et al. Inhibition of JAK2/STAT3 pathway leads to apoptosis in chronic lymphocytic leukemia cells. Blood. 2016;128:2023. [Google Scholar]
- 20.Furman RR, Asgary Z, Mascarenhas JO, et al. Modulation of NF-kappa B activity and apoptosis in chronic lymphocytic leukemia B cells. J Immunol. 2000;164:2200–2206. doi: 10.4049/jimmunol.164.4.2200. [DOI] [PubMed] [Google Scholar]
- 21.Edelmann J, Klein-Hitpass L, Carpinteiro A, et al. Bone marrow fibroblasts induce expression of PI3K/NF-kappaB pathway genes and a pro-angiogenic phenotype in CLL cells. Leuk Res. 2008;32:1565–1572. doi: 10.1016/j.leukres.2008.03.003. [DOI] [PubMed] [Google Scholar]
- 22.Liu Z, Hazan-Halevy I, Harris DM, et al. STAT-3 activates NF-kappaB in chronic lymphocytic leukemia cells. Mol Cancer Res. 2011;9:507–515. doi: 10.1158/1541-7786.MCR-10-0559. [DOI] [PMC free article] [PubMed] [Google Scholar]
- 23.Ho CL, Hsu LF, Phyliky RL, et al. Autocrine expression of platelet-derived growth factor B in B cell chronic lymphocytic leukemia. Acta Haematol. 2005;114:133–140. doi: 10.1159/000087886. [DOI] [PubMed] [Google Scholar]
- 24.Ding W, Knox TR, Tschumper RC, et al. Platelet-derived growth factor (PDGF)-PDGF receptor interaction activates bone marrow-derived mesenchymal stromal cells derived from chronic lymphocytic leukemia: implications for an angiogenic switch. Blood. 2010;116:2984–2993. doi: 10.1182/blood-2010-02-269894. [DOI] [PMC free article] [PubMed] [Google Scholar]
- 25.Medina FA, Williams TM, Sotgia F, et al. A novel role for caveolin-1 in B lymphocyte function and the development of thymus-independent immune responses. Cell Cycle. 2006;5:1865–1871. doi: 10.4161/cc.5.16.3132. [DOI] [PubMed] [Google Scholar]
- 26.Lei MG, Morrison DC. Differential expression of caveolin-1 in lipopolysaccharide-activated murine macrophages. Infect Immun. 2000;68:5084–5089. doi: 10.1128/iai.68.9.5084-5089.2000. [DOI] [PMC free article] [PubMed] [Google Scholar]
- 27.Gilling CE, Mittal AK, Chaturvedi NK, et al. Lymph node-induced immune tolerance in chronic lymphocytic leukaemia: a role for caveolin-1. Br J Haematol. 2012;158:216–231. doi: 10.1111/j.1365-2141.2012.09148.x. [DOI] [PubMed] [Google Scholar]
- 28.Tahir SA, Yang G, Goltsov AA, et al. Tumor cell-secreted caveolin-1 has proangiogenic activities in prostate cancer. Cancer Res. 2008;68:731–739. doi: 10.1158/0008-5472.CAN-07-2668. [DOI] [PubMed] [Google Scholar]
- 29.Rothberg KG, Heuser JE, Donzell WC, et al. Caveolin, a protein component of caveolae membrane coats. Cell. 1992;68:673–682. doi: 10.1016/0092-8674(92)90143-z. [DOI] [PubMed] [Google Scholar]
- 30.Palade GE. Fine structure of blood capillaries. J Appl Phys. 1953;24:1424–1424. [Google Scholar]
- 31.Yamada E. The fine structure of the gall bladder epithelium of the mouse. J Biophys Biochem Cytol. 1955;1:445–458. doi: 10.1083/jcb.1.5.445. [DOI] [PMC free article] [PubMed] [Google Scholar]
- 32.Drab M, Verkade P, Elger M, et al. Loss of caveolae, vascular dysfunction, and pulmonary defects in caveolin-1 gene-disrupted mice. Science. 2001;293:2449–2452. doi: 10.1126/science.1062688. [DOI] [PubMed] [Google Scholar]
- 33.Schubert W, Frank PG, Razani B, et al. Caveolae-deficient endothelial cells show defects in the uptake and transport of albumin in vivo. J Biol Chem. 2001;276:48619–48622. doi: 10.1074/jbc.C100613200. [DOI] [PubMed] [Google Scholar]
- 34.Sloan EK, Stanley KL, Anderson RL. Caveolin-1 inhibits breast cancer growth and metastasis. Oncogene. 2004;23:7893–7897. doi: 10.1038/sj.onc.1208062. [DOI] [PubMed] [Google Scholar]
- 35.Williams TM, Medina F, Badano I, et al. Caveolin-1 gene disruption promotes mammary tumorigenesis and dramatically enhances lung metastasis in vivo. Role of Cav-1 in cell invasiveness and matrix metalloproteinase (MMP-2/9) secretion. J Biol Chem. 2004;279:51630–51646. doi: 10.1074/jbc.M409214200. [DOI] [PubMed] [Google Scholar]
- 36.Bauer PM, Yu J, Chen Y, et al. Endothelial-specific expression of caveolin-1 impairs microvascular permeability and angiogenesis. Proc Natl Acad Sci USA. 2005;102:204–209. doi: 10.1073/pnas.0406092102. [DOI] [PMC free article] [PubMed] [Google Scholar]
- 37.Tahir SA, Yang G, Ebara S, et al. Secreted caveolin-1 stimulates cell survival/clonal growth and contributes to metastasis in androgen-insensitive prostate cancer. Cancer Res. 2001;61:3882–3885. [PubMed] [Google Scholar]
- 38.Bai L, Shi G, Zhang L, et al. Cav-1 deletion impaired hematopoietic stem cell function. Cell Death Dis. 2014;5:e1140. doi: 10.1038/cddis.2014.105. [DOI] [PMC free article] [PubMed] [Google Scholar]
- 39.Shen XJ, Zhang H, Tang GS, et al. Caveolin-1 is a modulator of fibroblast activation and a potential bio-marker for gastric cancer. Int J Biol Sci. 2015;11:370–379. doi: 10.7150/ijbs.10666. [DOI] [PMC free article] [PubMed] [Google Scholar]
- 40.Tahir SA, Ren C, Timme TL, et al. Development of an immunoassay for serum caveolin-1: a novel biomarker for prostate cancer. Clin Cancer Res. 2003;9:3653–3659. [PubMed] [Google Scholar]
- 41.Wu KN, Queenan M, Brody JR, et al. Loss of stromal caveolin-1 expression in malignant melanoma metastases predicts poor survival. Cell Cycle. 2011;10:4250–4255. doi: 10.4161/cc.10.24.18551. [DOI] [PubMed] [Google Scholar]
- 42.Simpkins SA, Hanby AM, Holliday DL, et al. Clinical and functional significance of loss of caveolin-1 expression in breast cancer-associated fibroblasts. J Pathol. 2012;227:490–498. doi: 10.1002/path.4034. [DOI] [PubMed] [Google Scholar]
- 43.Ayala G, Morello M, Frolov A, et al. Loss of caveolin-1 in prostate cancer stroma correlates with reduced relapse-free survival and is functionally relevant to tumour progression. J Pathol. 2013;231:77–87. doi: 10.1002/path.4217. [DOI] [PMC free article] [PubMed] [Google Scholar]
- 44.Zhao X, He Y, Gao J, et al. Caveolin-1 expression level in cancer associated fibroblasts predicts outcome in gastric cancer. PLoS One. 2013;8:e59102. doi: 10.1371/journal.pone.0059102. [DOI] [PMC free article] [PubMed] [Google Scholar]
- 45.Witkiewicz AK, Dasgupta A, Sotgia F, et al. An absence of stromal caveolin-1 expression predicts early tumor recurrence and poor clinical outcome in human breast cancers. Am J Pathol. 2009;174:2023–2034. doi: 10.2353/ajpath.2009.080873. [DOI] [PMC free article] [PubMed] [Google Scholar]
- 46.Li L, Ren CH, Tahir SA, et al. Caveolin-1 maintains activated Akt in prostate cancer cells through scaffolding domain binding site interactions with and inhibition of serine/threonine protein phosphatases PP1 and PP2A. Mol Cell Biol. 2003;23:9389–9404. doi: 10.1128/MCB.23.24.9389-9404.2003. [DOI] [PMC free article] [PubMed] [Google Scholar]
- 47.Podar K, Tai YT, Cole CE, et al. Essential role of caveolae in interleukin-6- and insulin-like growth factor I-triggered Akt-1-mediated survival of multiple myeloma cells. J Biol Chem. 2003;278:5794–5801. doi: 10.1074/jbc.M208636200. [DOI] [PubMed] [Google Scholar]
- 48.Zundel W, Swiersz LM, Giaccia A. Caveolin 1-mediated regulation of receptor tyrosine kinase-associated phosphatidylinositol 3-kinase activity by ceramide. Mol Cell Biol. 2000;20:1507–1514. doi: 10.1128/mcb.20.5.1507-1514.2000. [DOI] [PMC free article] [PubMed] [Google Scholar]
- 49.Feng S, Wang Y, Wang X, et al. Caveolin-1 gene silencing promotes the activation of PI3K/AKT dependent on Eralpha36 and the transformation of MCF10ACE. Sci China Life Sci. 2010;53:598–605. doi: 10.1007/s11427-010-0100-x. [DOI] [PubMed] [Google Scholar]
- 50.Pang A, Au WY, Kwong YL. Caveolin-1 gene is coordinately regulated with the multidrug resistance 1 gene in normal and leukemic bone marrow. Leuk Res. 2004;28:973–977. doi: 10.1016/j.leukres.2004.01.010. [DOI] [PubMed] [Google Scholar]
- 51.Koleske AJ, Baltimore D, Lisanti MP. Reduction of caveolin and caveolae in oncogenically transformed cells. Proc Natl Acad Sci USA. 1995;92:1381–1385. doi: 10.1073/pnas.92.5.1381. [DOI] [PMC free article] [PubMed] [Google Scholar]
- 52.Engelman JA, Zhang XL, Lisanti MP. Genes encoding human caveolin-1 and -2 are co-localized to the D7S522 locus (7q31.1), a known fragile site (FRA7G) that is frequently deleted in human cancers. FEBS Lett. 1998;436:403–410. doi: 10.1016/s0014-5793(98)01134-x. [DOI] [PubMed] [Google Scholar]
- 53.Galbiati F, Volonte D, Engelman JA, et al. Targeted downregulation of caveolin-1 is sufficient to drive cell transformation and hyperactivate the p42/44 MAP kinase cascade. EMBO J. 1998;17:6633–6648. doi: 10.1093/emboj/17.22.6633. [DOI] [PMC free article] [PubMed] [Google Scholar]
- 54.Martinez-Outschoorn UE, Sotgia F, Lisanti MP. Caveolae and signalling in cancer. Nat Rev Cancer. 2015;15:225–237. doi: 10.1038/nrc3915. [DOI] [PubMed] [Google Scholar]
- 55.Liu P, Rudick M, Anderson RG. Multiple functions of caveolin-1. J Biol Chem. 2002;277:41295–41298. doi: 10.1074/jbc.R200020200. [DOI] [PubMed] [Google Scholar]
- 56.Timme TL, Goltsov A, Tahir S, et al. Caveolin-1 is regulated by c-myc and suppresses c-myc-induced apoptosis. Oncogene. 2000;19:3256–3265. doi: 10.1038/sj.onc.1203654. [DOI] [PubMed] [Google Scholar]
- 57.Oh P, Borgstrom P, Witkiewicz H, et al. Live dynamic imaging of caveolae pumping targeted antibody rapidly and specifically across endothelium in the lung. Nat Biotechnol. 2007;25:327–337. doi: 10.1038/nbt1292. [DOI] [PMC free article] [PubMed] [Google Scholar]
- 58.Shukla A, Cutucache CE, Sutton GL, et al. Absence of caveolin-1 leads to delayed development of chronic lymphocytic leukemia in Emu-TCL1 mouse model. Exp Hematol. 2016;44:30–37. doi: 10.1016/j.exphem.2015.09.005. [DOI] [PubMed] [Google Scholar]
- 59.Li S, Okamoto T, Chun M, et al. Evidence for a regulated interaction between heterotrimeric G proteins and caveolin. J Biol Chem. 1995;270:15693–15701. doi: 10.1074/jbc.270.26.15693. [DOI] [PubMed] [Google Scholar]
- 60.Garcia-Cardena G, Fan R, Stern DF, et al. Endothelial nitric oxide synthase is regulated by tyrosine phosphorylation and interacts with caveolin-1. J Biol Chem. 1996;271:27237–27240. doi: 10.1074/jbc.271.44.27237. [DOI] [PubMed] [Google Scholar]
- 61.Tahir SA, Yang G, Goltsov A, et al. Caveolin-1-LRP6 signaling module stimulates aerobic glycolysis in prostate cancer. Cancer Res. 2013;73:1900–1911. doi: 10.1158/0008-5472.CAN-12-3040. [DOI] [PMC free article] [PubMed] [Google Scholar]
- 62.Rungtabnapa P, Nimmannit U, Halim H, et al. Hydrogen peroxide inhibits non-small cell lung cancer cell anoikis through the inhibition of caveolin-1 degradation. Am J Physiol Cell Physiol. 2011;300:C235–C245. doi: 10.1152/ajpcell.00249.2010. [DOI] [PMC free article] [PubMed] [Google Scholar]
Associated Data
This section collects any data citations, data availability statements, or supplementary materials included in this article.