Abstract
In addition to weather conditions and pollutant emissions, the degree to which topography influences the occurrence and development of haze pollution in downtown Beijing and the mechanisms that may be involved remain open questions. A series of atmospheric chemistry simulations are executed by using the online-coupled Weather Research and Forecasting with Chemistry (WRF-Chem) model for November-December 2015 with different hypothetical topographic height scenarios. The simulation results show that topography exerts an important influence on haze pollution in downtown Beijing, particularly the typical development of haze pollution. A possible mechanism that underlies the response of haze pollution to topography is that the mountains that surround Beijing tend to produce anomalous southerly winds, high relative humidity, low boundary layer heights, and sinking motion over most of Beijing. These conditions favor the formation and development of haze pollution in downtown Beijing. Furthermore, the reduction percentage in PM2.5 concentrations due to reduced terrain height in the southerly wind (S) mode is almost three times larger than that in the northerly wind (N) mode. In the context of the regional topography, the simple S and N modes represent useful indicators for haze prediction in Beijing to some extent, especially over medium to long time scales.
Introduction
Beijing is located in the northern tip of the North China Plain and surrounded by mountains along the west, north and northeast. Beijing is the capital of China and one of the largest cities in the world; it has with approximately 20 million residents. Given the rapid urbanization and industrial development over the past several decades, Beijing and its adjacent areas are becoming more and more important in China and for the global economy. However, the rapid economic growth and urbanization have increased the level of air pollution in recent decades1–8. Beijing and eastern China have suffered from severe haze or smog days frequently in recent years. These events are characterized by high particle mass concentrations and low visibility. Severe haze pollution, exemplified by the persistent haze days in January 2013, represent a substantial threat to human health and traffic safety. These phenomena have stimulated great interest in studying the haze pollution in Beijing or eastern China as a whole9–18. Very serious haze pollution struck again in Beijing in November-December 2015, and heavy pollution red alerts were issued on December 7th and 18th, 2015 (although, according to pollutant concentration records, these dates were not the worst cases over that period November-December 2015). That is the first time the capital issued a red alert (the most serious level) for air pollution in Chinese history19–21.
Haze pollution is generally attributed to the following two factors: the emission of pollutants to the lower atmosphere from fossil fuel combustion, construction and other sources and unfavorable meteorological conditions. Air quality and the occurrence of haze pollution are strongly influenced by meteorology. Meteorological factors have essential impacts on the accumulation or diffusion, spread and regional transport of air pollutants and have important impacts on the formation of secondary aerosols, which are generated by complex physical and chemical reactions22–31. In particular, weather conditions play an essential role in controlling the daily variability of air pollutant concentrations5,32–34. Previous studies have suggested that there is a close relationship between the occurrence of winter haze pollution in the Beijing-Tianjin-Hebei region and atmospheric circulation at middle to high latitudes over a long-term perspective35–37. In addition, on interannual time scales, the air pollution across central and eastern China or even South Asia in the winter and summer is closely related to the East Asian winter and summer monsoons, respectively38–45.
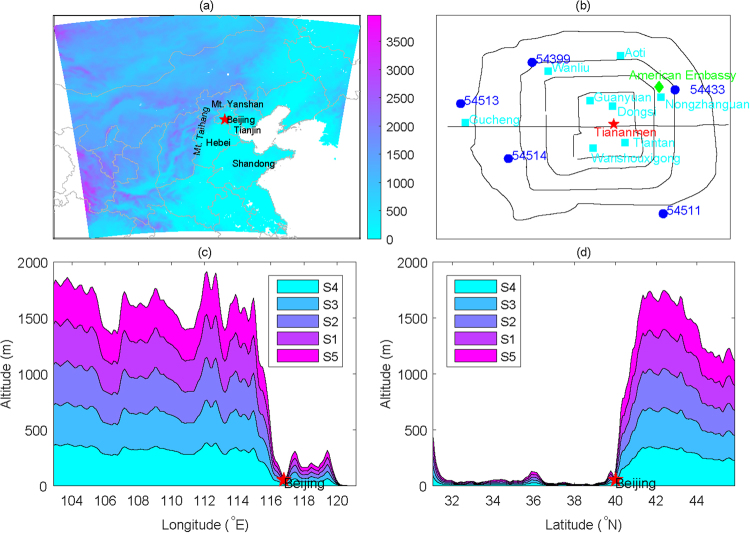
Terrain or topography may be another non-negligible factor that influences the haze pollution that occurs in Beijing and eastern China. For example, a previous study has suggested that the “harbor” effect on the westerlies in the eastern lee of the Tibetan Plateau’s large topography may be an important factor that influences the regional distribution of haze frequency in eastern China46. Beijing is located in the northern part of the North China Plain (Fig. 1a). The Taihang Mountains are located west of Beijing, whereas the Yanshan Mountains lie to the north and northeast of Beijing. Topographical profiles show that the altitude differences in both the west-east and north-south directions exceed 1000 m over very short horizontal distances (Fig. 1c,d). Thus, whether and how the regional topographic variations influence the occurrence and development of haze pollution in Beijing remain open questions. To date, few studies have examined the possible influence of topography on haze in Beijing or other areas quantitatively47,48. A close understanding of the effects of topography on air pollution assists in planning the spatial layout of industry areas and emission controls in Beijing and the adjacent areas and is also useful in improving the prediction skill achieved by weather and air quality forecasts produced by numerical models. This study aims to investigate the effects of topography on the occurrence and development of haze pollution using numerical sensitivity experiments.
Figure 1.
A map showing the topography of northern China and the spatial domain of the simulations (a); environmental monitoring sites operated by the Ministry of Environmental Protection of the People’s Republic of China (cyan squares) and American Embassy (green diamond) and meteorological stations operated by China Meteorological Administration (blue dots) in downtown Beijing (b); the topographic profiles of altitude-longitude along 39.5–40.5°N (c) and altitude-latitude along 116–117°E (d) in the different sensitivity simulations.
Results
Analysis of observational data
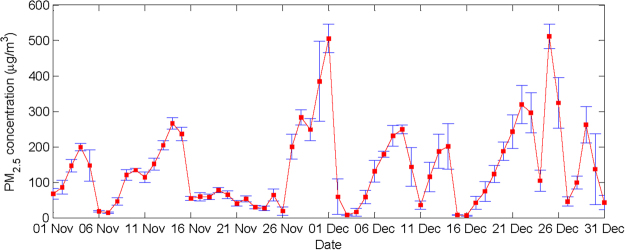
The daily mean PM2.5 concentrations in downtown Beijing in November-December 2015 are presented in Fig. 2. The standard deviations determined from the 24-hour records from each day are indicated by error bars. Days with a high PM2.5 concentrations and a small error bars, such as December 1st and December 25th, indicate heavy pollution throughout the day. In contrast, a large error bar generally indicates intense fluctuations in the PM2.5 concentrations, which may reflect either the accumulation or elimination of pollutants or both. It is clear that most (36 days, approximately 59%) of the daily PM2.5 concentrations exceed 75 μg/m3, which suggest polluted conditions, according to the ambient air quality standards of China. The mean concentration over this period was 140.6 μg/m3, which is far larger than the annual mean for 2015 (80.6 μg/m3, according to the Beijing Municipal Environmental Protection Bureau). During the November-December 2015, extreme severe pollution occurred, especially on the 1st and 25th of December, and the daily mean PM2.5 concentrations in downtown Beijing exceeded 500 μg/m3, which is very unusual. Generally, the high recorded PM2.5 concentrations indicate that severe or even extreme haze pollution occurred in Beijing in November-December of 2015.
Figure 2.
The daily mean PM2.5 concentrations in downtown Beijing over November-December 2015. Error bars denote the standard deviations calculated from 24 hours of recorded data.
Modeling evaluation
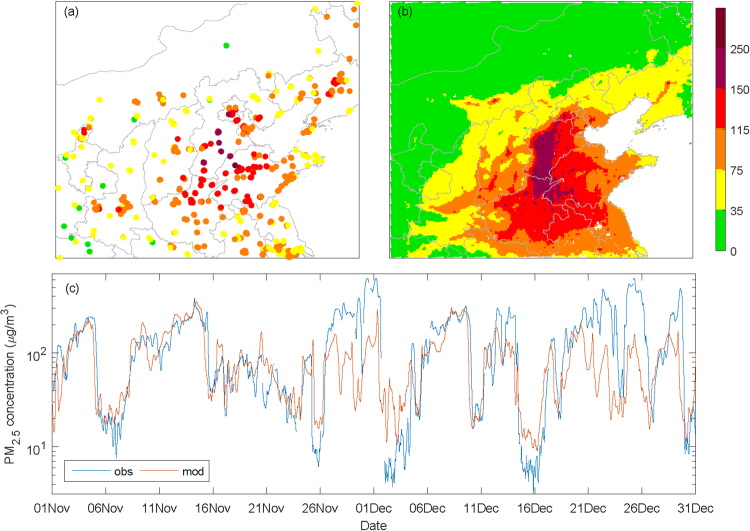
Using the Weather Research and Forecasting with Chemistry (WRF-Chem) model and output from the final (FNL) reanalysis data, a series of high-resolution simulation experiments is performed that focuses on the possible influences of topography on haze pollution in downtown Beijing during November-December 2015. We first compared the features of the spatial distribution of simulated PM2.5 concentrations to the observations during the study period. The observed and simulated mean PM2.5 concentrations over most of northern China during November-December 2015 are shown in Fig. 3a,b, respectively. As seen in the observations, most of Beijing, Tianjin, the south-central portion of Hebei province and the northwest part of Shandong province experience moderate (≥115 μg/m3) to high levels (≥150 μg/m3) of pollution during these two months. The spatial distribution of the simulated mean PM2.5 concentrations is generally consistent with that of the observations. Heavy pollution extends from the south-central portion of Hebei province along the foot of the Taihang Mountains to the Beijing areas. The spatial correlation coefficient between the observed mean PM2.5 concentrations at all of the stations (770 in total) located within the simulation domain and the corresponding PM2.5 concentrations derived from the simulations is 0.62 (p < 0.01). The temporal correlation coefficients between the observed and simulated PM2.5 concentrations are also calculated; on the daily and hourly time scales, the percentages of positive correlations are 93.8% and 94.2%, and the mean correlation coefficients are 0.34 and 0.29, respectively. These significant correlations suggest that the simulations generally capture the spatial distribution patterns and temporal fluctuations of the PM2.5 concentrations found in the observations over the entire areas. In downtown Beijing, the correlation coefficients between the observed and simulated PM2.5 concentrations are 0.48 and 0.46 on the daily and hourly time scales, respectively. Both of these correlations are significant at the 0.01 level. The comparison of the temporal variations in the observed and simulated hourly PM2.5 concentrations in downtown Beijing (Fig. 3c) indicates that the simulated PM2.5 variability is generally consistent with the observed, although the model does not capture the peak concentrations. Note that the skill of the simulation in representing the typical development of haze events (featured by gradual increases in PM2.5 concentrations) is better than its ability to represent the intense fluctuations in haze (featured by rapid increases or decreases in PM2.5 concentrations over very short time periods). Generally, the simulation results are reliable and useful in examining the effects of topography on the occurrence of haze pollution in Beijing.
Figure 3.
The spatial distribution of the observed (a) and simulated (b) mean PM2.5 concentrations during the period of November 1st to December 31st and the temporal variations in the observed and simulated hourly PM2.5 concentrations in downtown Beijing (c).
Sensitivity analysis
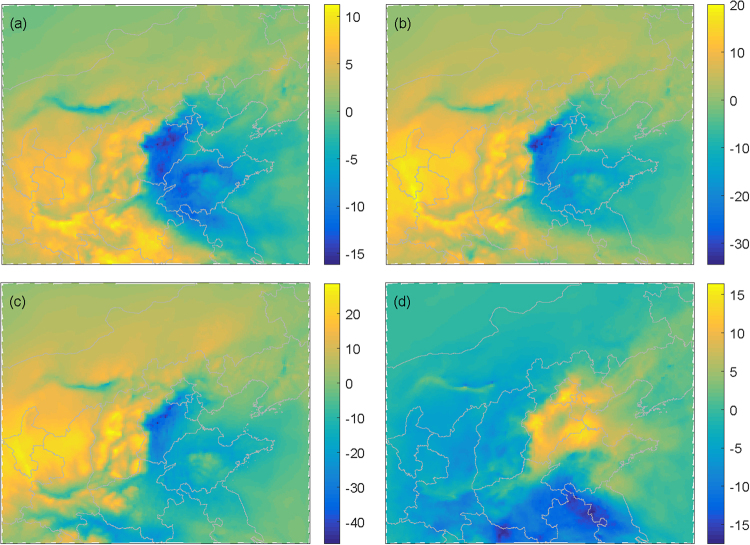
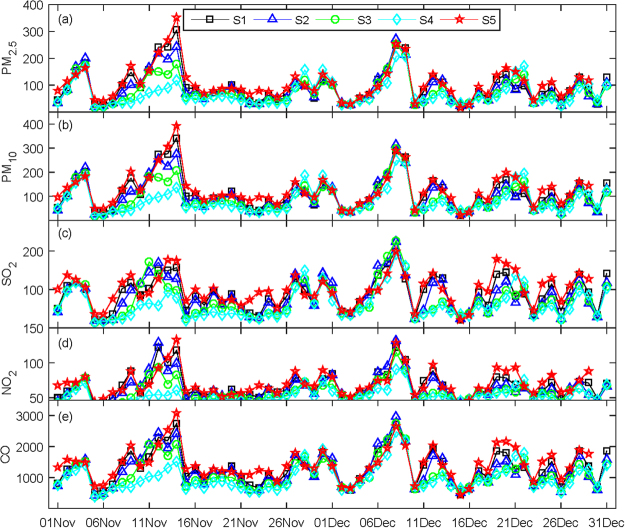
We first examine the general characteristics of the response of PM2.5 concentrations to changes in topography. As the terrain heights drop, the PM2.5 concentrations decrease over most of the North China Plain, especially from south of Beijing to the south-central portion of Hebei province (Fig. 4a–c). In contrast, the PM2.5 concentrations clearly increase over most of the North China Plain as the terrain heights is increased (Fig. 4d). Moreover, the responses of other important pollutants, such as PM10, SO2, NO2, and CO, to topographic height changes are roughly consistent with those of PM2.5 (not shown). The daily variations in the concentrations of PM2.5, PM10, SO2, NO2, and CO in downtown Beijing from November to December 2015 derived from the simulations performed using different topographical scenarios are shown in Fig. 5. The pollutant concentrations generally increase as the terrain heights increases, especially during the typical development of haze, such as during the period of the 7th to the 16th of November (Fig. 5).
Figure 4.
The spatial distribution of PM2.5 differences between scenarios S1 and S2 (S2-S1) (a), S3 (S3-S1) (b), S4 (S4-S1) (c), and S5 (S5-S1) (d) in μg/m3.
Figure 5.
The daily concentrations of PM2.5 (a), PM10 (b), SO2 (c), NO2 (d) and CO (e) in downtown Beijing during November-December 2015 derived from the simulations using different scenarios in μg/m3.
To quantitatively understand the influence of the regional topography on haze pollution in downtown Beijing in the different scenarios, the mean concentrations of PM2.5, PM10, SO2, NO2, and CO derived from all of the scenario simulations over the entire period and the typical haze events are calculated. When the topographic heights are scaled by 0.75 (S2), 0.50 (S3) and 0.25 (S4), all of the pollutant concentrations in downtown Beijing are clearly less than those in scenario S1 over both the entire period and the typical haze period. In contrast, when the height of the topography is scaled by 1.25 (S5), all of the pollutant concentrations in downtown Beijing are larger than these of S1 in both periods (Table 1). We further calculated the percentage changes in the pollutant concentrations in the scenarios with changed terrain heights (S2, S3, S4 and S5) relative to the scenario S1 (Table 2). During November to December 2015, the PM2.5 concentrations in downtown Beijing decrease by 9.2%, 18.3%, and 26.1% as the topographic heights are lowered by 25%, 50%, and 75%, respectively, whereas the concentration increases by 12.9% when the topographic height increases by 25%. During the typical development of haze, the PM2.5 concentrations appear to decrease by 15.3%, 36.5%, and 59.2% as the topographic heights decrease by 25%, 50%, and 75%, respectively; however, they increase by 10.4% when the topographic height increases by 25%. The percentage changes in the PM10 concentrations are very similar to the percentage changes in the concentrations of PM2.5, SO2, NO2, and CO. However, there is an exception; namely, no distinct changes in the NO2 concentrations occur in scenarios S5 relative to S1 during the period of November 7th to 16th (0.1%).
Table 1.
Mean concentrations of the pollutants in the different scenarios.
| Pollutant | Period | Scenario (μg/m3) | ||||
|---|---|---|---|---|---|---|
| S1 | S2 | S3 | S4 | S5 | ||
| PM2.5 | Nov-Dec | 94.9 | 86.2 | 77.5 | 70.1 | 107.2 |
| 11.7–11.16 | 150.2 | 127.3 | 95.4 | 61.3 | 165.8 | |
| PM10 | Nov-Dec | 113.1 | 102.9 | 92.3 | 83.2 | 127.5 |
| 11.7–11.16 | 173.2 | 148.7 | 112.9 | 73.1 | 191.2 | |
| SO2 | Nov-Dec | 87.9 | 81.4 | 71.7 | 62.0 | 99.8 |
| 11.7–11.16 | 102.5 | 97.6 | 79.4 | 48.2 | 115.4 | |
| NO2 | Nov-Dec | 66.7 | 63.5 | 58.3 | 52.8 | 70.7 |
| 11.7–11.16 | 79.1 | 75.1 | 61.9 | 46.7 | 79.2 | |
| CO | Nov-Dec | 1308.8 | 1232.6 | 1120.4 | 1002.8 | 1431.4 |
| 11.7–11.16 | 1664.6 | 1587.5 | 1342.3 | 930.9 | 1782.7 | |
Table 2.
Percentage changes in the pollutant concentrations among the different scenarios.
| Pollutant | Period | Scenario (%) | |||
|---|---|---|---|---|---|
| (S2–S1)/S1 | (S3–S1)/S1 | (S4–S1)/S1 | (S5–S1)/S1 | ||
| PM2.5 | Nov-Dec | −9.2 | −18.3 | −26.1 | 12.9 |
| 11.7–11.16 | −15.3 | −36.5 | −59.2 | 10.4 | |
| PM10 | Nov-Dec | −9.0 | −18.4 | −26.4 | 12.7 |
| 11.7–11.16 | −14.2 | −34.8 | −57.8 | 10.4 | |
| SO2 | Nov-Dec | −7.4 | −18.4 | −29.4 | 13.5 |
| 11.7–11.16 | −4.7 | −22.5 | −52.9 | 12.6 | |
| NO2 | Nov-Dec | −4.8 | −12.6 | −20.7 | 6.0 |
| 11.7–11.16 | −5.0 | −21.7 | −40.9 | 0.1 | |
| CO | Nov-Dec | −5.8 | −14.4 | −23.4 | 9.4 |
| 11.7–11.16 | −4.6 | −19.4 | −44.1 | 7.1 | |
In summary, the topography plays an important role in aggravating the concentrations of pollutants (especially the PM25 and PM10) in downtown Beijing during periods of air pollution, especially during the gradual development of haze pollution.
Discussion
Analysis of the relevant mechanisms
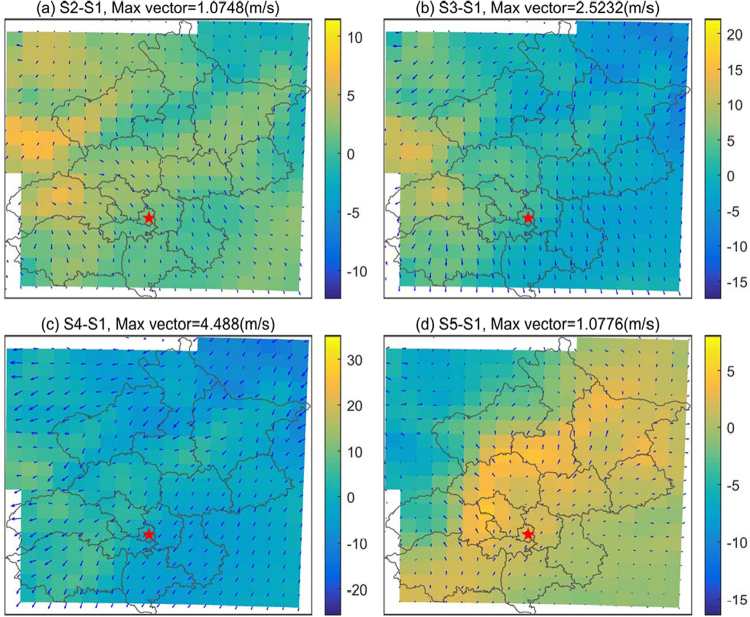
The simulation results suggest that topography indeed exerts an important influence on air pollutant concentrations in downtown Beijing. We thus wonder what the possible mechanisms underlie the relationships and whether the modulation depends on the favorable weather conditions. First, we investigate the response of surface winds and relative humidity to the topographic changes. Fig. 6 shows the composite anomaly fields of surface wind vectors and relative humidity during November 7th to 16th. The anomalous northerly winds and low relative humidity become dominant in Beijing and the surrounding areas as the terrain is lowered, especially when the terrain drops by 50% (Fig. 6b) and 75% (Fig. 6c). In contrast, most of the study area is dominated by anomalous southerly winds and high relative humidity when the terrain height increases (Fig. 6d). The anomalous southerly winds are likely accompanied by static winds, due to the blocking produced by the high topography to the north and west. A similar response is also found in the planetary boundary layer height (PBLH), which increases (decreases) over Beijing and its adjacent areas when the terrain height drops (increases). Furthermore, the profiles of zonal and vertical winds over central Beijing in the simulations that evaluate different scenarios are examined. The results show that increases in terrain height may lead to a sinking vertical vortex in the lower troposphere on the eastern lee of the regional topography, which promotes the development of sinking motion over downtown Beijing (Fig. 7). This sinking motion typically depresses the vertical exchange in pollutants and is often accompanied by or leads to a lower PBLH and weak winds. This phenomenon is similar to the “harbor” effect on the westerlies in the eastern lee of the Tibetan Plateau’s large topography, which may be an important factor that influences the regional distribution of haze frequency in eastern China47. Thus a simple conceptual model can be described as that increase in terrain height lead to anomalous southerly winds, high relative humidity, low boundary layer heights, and sinking motion, which favor the formation and development of haze pollution in Beijing, and vice versa.
Figure 6.
The composite anomaly fields of surface wind vectors and relative humidity for S2-S1 (a), S3-S1 (b), S4-S1 (c) and S5-S1 (d), respectively.
Figure 7.
Profiles of simulated zonal and vertical winds along 39.5–40.5°N in the S5 (a), S1 (b), S2 (c), S3 (d), and S4 (e) scenario from November 7th to 16th. The vertical winds have been multiplied by 400; the opaque regions denote the terrain.
Implications of the S and N modes
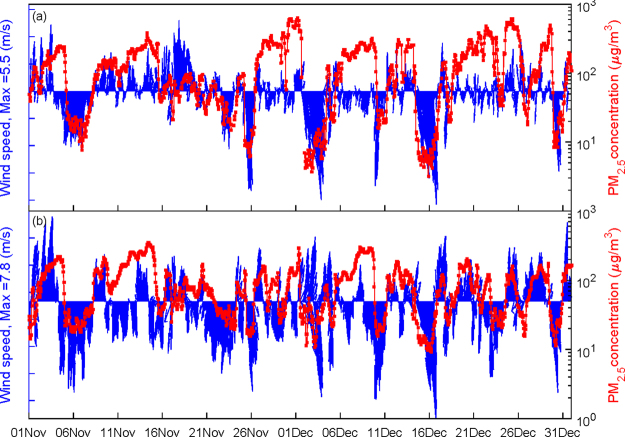
The observed data show that the PM2.5 concentrations in downtown Beijing are distinctly related to the wind direction. The southerly and northerly winds correspond to high and low (or no) pollutions, respectively (Fig. 8a). The relationship between the winds and haze pollution in downtown Beijing is well reproduced in the atmospheric chemistry simulation (Fig. 8b). This result suggests that the simple southerly (S) and northerly (N) wind modes are very useful predictors of haze in downtown Beijing to some extent. Thus, it is of interest to understand the influence of topography on haze pollution in downtown Beijing under the different wind modes. The percentage changes in the pollutant concentrations in the different scenarios and the different wind modes are calculated (Table 3). For example, in the context of the N mode, the PM2.5 concentrations decreases by 5.0%, 9.6%, and 14.5% as the terrain height drops by 25%, 50%, 75%, respectively. However, in the context of the S mode, the PM2.5 concentrations decrease by 13.5%, 27.0%, and 37.6%, respectively. The reduction percentage in PM2.5 concentrations due to terrain height decreases in the S mode is almost three times larger than that in the N mode. This opposite relationship is noted when the terrain height increases by 25%. Similar characteristics are also found in the concentrations of other pollutants, such as PM10, SO2, NO2, and CO (Table 3). The response of pollutants concentrations to terrain height changes are closely related to the responses of meteorological variables, such as wind speed, relative humidity, and the PBLH. When the terrain height drops, the increases (decreases) in wind speed and the PBLH (RH) in the S mode are larger than those in the N mode, and vice versa (Table 4). Thus, characterizing the different modulating effects of topography on haze pollution in downtown Beijing under the S and N modes is important. This information would be very useful in producing medium-range to long-term (monthly to seasonal) predictions or evaluations of air pollution.
Figure 8.
The observed (a) and simulated (b) PM2.5 concentrations and wind vectors in downtown Beijing.
Table 3.
Percentage changes (%) in the pollutant concentrations among the different scenarios and the different wind modes.
| Pollutant | Wind mode | Scenario | |||
|---|---|---|---|---|---|
| (S2–S1)/S1 | (S3–S1)/S1 | (S4–S1)/S1 | (S5–S1)/S1 | ||
| PM2.5 | S | −13.5 | −27.0 | −37.6 | 7.9 |
| N | −5.0 | −9.6 | −14.5 | 18.2 | |
| PM10 | S | −13.4 | −27.5 | −37.8 | 7.5 |
| N | −4.4 | −8.9 | −14.6 | 18.4 | |
| SO2 | S | −15.0 | −31.5 | −40.6 | 6.9 |
| N | 1.8 | −2.4 | −15.8 | 22.1 | |
| NO2 | S | −7.3 | −17.6 | −25.5 | 4.7 |
| N | −2.6 | −8.2 | −16.5 | 7.3 | |
| CO | S | −10.8 | −23.6 | −31.8 | 6.2 |
| N | −1.0 | −5.4 | −15.1 | 12.7 | |
Table 4.
Percentage changes (%) in the meteorological variables among the different scenarios and the different wind modes.
| Pollutant | Wind mode | Scenario | |||
|---|---|---|---|---|---|
| (S2–S1)/S1 | (S3–S1)/S1 | (S4–S1)/S1 | (S5–S1)/S1 | ||
| Wind speed | S | 19.8 | 44.0 | 49.6 | −9.0 |
| N | 12.8 | 35.2 | 39.3 | −15.1 | |
| RH | S | 2.2 | 7.9 | 9.6 | −0.2 |
| N | 7.1 | 12.6 | 14.5 | −0.7 | |
| PBLH | S | 1.6 | 9.0 | 42.6 | −10.3 |
| N | 1.4 | 3.3 | 8.7 | −14.1 | |
Uncertainties
Moreover, note that some uncertainties exist in the qualitative response of haze pollution to terrain height changes, due to the different spatial scales involved. In principle, differences are expected between the influence of regional topography on haze pollution in downtown Beijing and the influence of national- or continental-scale topography. Thus, further study is needed to explore this issue.
Conclusion
The possible effects of different topographic scenarios on haze pollution in downtown Beijing are quantitatively examined using the online-coupled WRF-Chem model, output from the FNL reanalysis obtained from the National Centers for Environmental Prediction (NCEP), high-resolution anthropogenic emissions data derived from the Multi-resolution Emission Inventory for China (MEIC) and the hourly PM2.5 records generated at surface stations. The results suggest that the terrain height indeed plays an important role in controlling the haze pollution in downtown Beijing, especially during the typical development of haze, which featured by a gradual increase in PM2.5 concentrations. Concretely, the PM2.5 concentrations in downtown Beijing decrease by approximately 9.2% (15.3%), 18.3% (36.5%), and 26.1% (59.2%) as the topographic height in most of northern China is lowered by 25%, 50% and 75%, and it increases by 12.9% (10.4%) as the topographic height is increased by 25% during November-December 2015 (during a typical haze event), respectively. The statistical relationships are consistent with the simple mechanisms demonstrated by these simulations. For example, increases in terrain height lead to anomalous southerly winds, high relative humidity, low boundary layer heights, and sinking motion in the lower troposphere, which favor to the formation and development of haze pollution in downtown Beijing, and vice versa. Moreover, the reduction percentage in PM2.5 concentrations due to reductions in terrain height in the southerly wind mode (S mode) is almost three times larger than that in the northerly wind mode (N mode), suggesting that the S and N modes represent good indicators of haze pollution in downtown Beijing in relevant operations or studies, especially over medium to long time scales.
Methods
Data and study area
The hourly concentrations of PM2.5 (particulate matter with aerodynamic diameters less than 2.5 μm) in downtown Beijing used in this study are derived from eight stations operated by the Ministry of Environmental Protection of the People’s Republic of China during November-December 2015 (Fig. 1b). Moreover, the PM2.5 concentration data measured at the American Embassy station are also used for comparison and to fill in missing data using regression. From November 1st to December 31st in 2015, the percentages of missing hourly PM2.5 concentration records at the American Embassy station and the average of the eight operational stations are 0.68% (10 hours missing) and 3.62% (53 hours missing), respectively. In fact, the hourly PM2.5 records from the American Embassy station are highly consistent with the average values for the eight stations. The correlation coefficient is 0.96, which is significant at the 0.01 level (i.e., p < 0.01). The difference in their mean values is only 0.81 μg/m3. To better represent the data across the city, we take the average records from the eight stations as the actual PM2.5 concentration for downtown Beijing in this study. The meteorological records from five stations in downtown Beijing are shown in Fig. 1b (solid blue circles). The spatial scope in Fig. 1a also represents the model domain of the WRF-Chem simulations. For the daily mean values calculated here, a meteorological day is defined as the 20:00–20:00 (local time) throughout the paper.
Model and simulation design
To investigate the influence of topography on haze pollution in Beijing, a series of sensitivity simulations involving five scenarios of topographic changes are evaluated using version 3.7 of the online-coupled Weather Research and Forecasting with Chemistry (WRF-Chem) model49–53. The first simulation involves the real (unchanged) terrain heights (labeled as S1). In addition, the real terrain heights are then scaled by 0.75, 0.50, 0.25, and 1.25 in the second (S2), third (S3), fourth (S4), and fifth (S5) scenario simulations, respectively. The output from the final (FNL) reanalysis produced by the Global Forecast System (GFS) of the National Centers for Environmental Prediction (NCEP) is used as the lateral meteorological boundary conditions in the simulations. The temporal and spatial resolutions of the FNL data used here are 6 hours and 1.0° × 1.0°, respectively. The primary settings and schemes used in the WRF-Chem simulations are shown in Table 5. The schemes used in our simulations are similar to those applied in the previous studies19,54,55, with a few differences. To better capture the process of haze development near the surface, 13 levels are specified under 1,500 m. A monthly dataset that describes anthropogenic emissions in 2012 at high spatial resolution (0.1° × 0.1°) is used in the simulations and was provided by the Multi-resolution Emission Inventory for China (MEIC)56,57.
Table 5.
List of the experimental settings and schemes used in WRF-Chem.
| Simulation settings | Values |
|---|---|
| Domain size Horizontal resolution Vertical resolution Time step for physics Time step for chemistry |
201 × 222 cells (> 3.2 million km2) 9 km 30 levels up to 50 hPa 45 seconds 3 minutes |
| Physics option | Adopted scheme |
| Microphysics Longwave radiation Shortwave radiation Surface layer Land surface Planetary boundary layer Cumulus parameterizations |
WRF Single-Moment 6-class scheme Rapid radiative transfer model (RRTM) Goddard Monin-Obukhov similarity Noah Land Surface Model Yonsei University scheme (YSU) Grell 3D |
| Chemistry option | Adopted scheme |
| Photolysis Gas phase chemistry Aerosols Anthropogenic emissions Biogenic emissions |
Fast-J photolysis Carbon Bond Mechanism, version Z (CBM-Z) Model for Simulating Aerosol Interactions and Chemistry (MOSAIC) with 4 sectional bins MEIC with a spatial resolution of 0.1°×0.1° Guenther (from the United States Geological Survey land-use classification) |
All of the simulations cover November-December 2015 because a very serious haze pollution event struck Beijing in November-December 2015, and red alerts were issued for the first time in Chinese history, as mentioned in the Introduction. Both the typical development of haze events (which feature a gradual increase in PM2.5 concentrations, i.e., November 7th to 16th) and the fast-changing haze events (which feature explosive growth and/or dramatic reductions in PM2.5 concentrations, i.e., November 29th to December 2nd and December 22nd to 26th) occurred during this haze season. Thus, this study increase our understanding of the possible effects of topography on haze pollution in downtown Beijing under different weather and pollution conditions.
Acknowledgements
This study was supported by the Beijing Municipal Science & Technology Commission (grant no. Z161100004516018), the National Natural Science Foundation of China (grant nos 91644223 and 41621061), the National Key Research and Development Program of China (grant no. 2016YFC0203300) and project PE18010 of the Korea Polar Research Institute.
Author Contributions
Z.Z. and X.X. designed the study. Z.Z. performed the simulations. Z.Z., X.X., Q.L. and D.G. analyzed the results and wrote the paper. S.K. polished the writing. Y.W. produced Fig. 7. R.M. analyzed some of the data. All of the authors commented on the paper.
Competing Interests
The authors declare no competing interests.
Footnotes
Publisher's note: Springer Nature remains neutral with regard to jurisdictional claims in published maps and institutional affiliations.
References
- 1.Chan CK, Yao X. Air pollution in mega cities in China. Atmos. Environ. 2008;42:1–42. doi: 10.1016/j.atmosenv.2007.09.003. [DOI] [Google Scholar]
- 2.Wang T, et al. Air quality during the 2008 Beijing Olympics: secondary pollutants and regional impact. Atmos. Chem. Phys. 2010;10:7603–7615. doi: 10.5194/acp-10-7603-2010. [DOI] [Google Scholar]
- 3.Gao Y, Liu X, Zhao C. Emission controls versus meteorological conditions in determining aerosol concentrations in Beijing during the 2008 Olympic Games. Atmos. Chem. Phys. 2011;11:12437–12451. doi: 10.5194/acp-11-12437-2011. [DOI] [Google Scholar]
- 4.Li W, et al. Integrated evaluation of aerosols from regional brown hazes over northern China in winter: Concentrations, sources, transformation, and mixing states, J. Geophys. Res. Atmos. 2011;116:D09301. [Google Scholar]
- 5.Wu D, et al. The long-term trend of haze and fog days and the surface layer transport conditions under haze weather in North China (in Chinese) Acta Scientiae Circumstantiae. 2014;34:1–11. [Google Scholar]
- 6.Tie XX, et al. A budget analysis of the formation of haze in Beijing. Atmos. Environ. 2015;100:25–36. doi: 10.1016/j.atmosenv.2014.10.038. [DOI] [Google Scholar]
- 7.Zheng S, et al. Long-term (2001–2012) concentrations of fine particulate matter (PM2.5) and the impact on human health in Beijing, China. Atmos. Chem. Phys. 2015;15:5715–5725. doi: 10.5194/acp-15-5715-2015. [DOI] [Google Scholar]
- 8.Liu QY, et al. Temporal variations of black carbon during haze and non-haze days in Beijing. Sci. Rep. 2016;6:33331. doi: 10.1038/srep33331. [DOI] [PMC free article] [PubMed] [Google Scholar]
- 9.Bi J, et al. Investigating the aerosol optical and radiative characteristics of heavy haze episodes in Beijing during January of 2013. J. Geophys. Res. Atmos. 2014;119:9884–9900. doi: 10.1002/2014JD021757. [DOI] [Google Scholar]
- 10.Sun YL, et al. Investigation of the sources and evolution processes of severe haze pollution in Beijing in January 2013. J. Geophys. Res. Atmos. 2014;119:4380–4398. doi: 10.1002/2014JD021641. [DOI] [Google Scholar]
- 11.Wang H, et al. A study of the meteorological causes of a prolonged and severe haze episode in January 2013 over central-eastern China. Atmos. Environ. 2014;98:146–157. doi: 10.1016/j.atmosenv.2014.08.053. [DOI] [Google Scholar]
- 12.Wang YX, et al. Enhanced sulfate formation during China’s severe winter haze episode in January 2013 missing from current models. J. Geophys. Res. Atmos. 2014;119:425–440. doi: 10.1002/2013JB010544. [DOI] [Google Scholar]
- 13.Tao MH, et al. Formation process of the widespread extreme haze pollution over northern China in January 2013: Implications for regional air quality and climate. Atmos. Environ. 2014;98:417–425. doi: 10.1016/j.atmosenv.2014.09.026. [DOI] [Google Scholar]
- 14.Zhang RH, Li Q, Zhang RN. Meteorological conditions for the persistent severe fog and haze event over eastern China in January 2013. Sci. China Earth Sci. 2014;57:26–35. doi: 10.1007/s11430-013-4774-3. [DOI] [Google Scholar]
- 15.Wang HJ, Chen HP. Understanding the recent trend of haze pollution in eastern China: roles of climate change. Atmos. Chem. Phys. 2016;16:4205–4211. doi: 10.5194/acp-16-4205-2016. [DOI] [Google Scholar]
- 16.Fu HB, Chen JM. Formation, features and controlling strategies of severe haze-fog pollutions in China. Sci. Total Environ. 2017;578:121–138. doi: 10.1016/j.scitotenv.2016.10.201. [DOI] [PubMed] [Google Scholar]
- 17.Han B, et al. Heavy haze episodes in Beijing during January 2013: Inorganic ion chemistry and source analysis using highly time-resolved measurements from an urban site. Sci. Total Environ. 2016;544:319–329. doi: 10.1016/j.scitotenv.2015.10.053. [DOI] [PubMed] [Google Scholar]
- 18.Zhu X, et al. Regional pollution and its formation mechanism over North China Plain: A case study with ceilometer observations and model simulations. J. Geophys. Res. Atmos. 2016;121:574–588. doi: 10.1002/2015JE004885. [DOI] [Google Scholar]
- 19.Zhang ZY, et al. Cause and predictability for the severe haze pollutions in downtown Beijing during November–December 2015. Sci. Total Environ. 2017;592:627–638. doi: 10.1016/j.scitotenv.2017.03.009. [DOI] [PubMed] [Google Scholar]
- 20.Sun YL, Li JP, Sun C. Rapid formation and evolution of an extreme haze episode in Northern China during winter 2015. Sci. Rep. 2016;6:27151. doi: 10.1038/srep27151. [DOI] [PMC free article] [PubMed] [Google Scholar]
- 21.Chang L, et al. Impact of the 2015 El Nino event on winter air quality in China. Sci. Rep. 2016;6:34275. doi: 10.1038/srep34275. [DOI] [PMC free article] [PubMed] [Google Scholar]
- 22.Wang XF, et al. The secondary formation of inorganic aerosols in the droplet mode through heterogeneous aqueous reactions under haze conditions. Atmos. Environ. 2012;63:68–76. doi: 10.1016/j.atmosenv.2012.09.029. [DOI] [Google Scholar]
- 23.Jeong JI, Park RJ. Effects of the meteorological variability on regional air quality in East Asia. Atmos. Environ. 2013;69:46–55. doi: 10.1016/j.atmosenv.2012.11.061. [DOI] [Google Scholar]
- 24.Ramsey NR, Petra MK, Berrien M. The impact of meteorological parameters on urban air quality. Atmos. Environ. 2014;86:58–67. doi: 10.1016/j.atmosenv.2013.12.006. [DOI] [Google Scholar]
- 25.Sun YL, et al. Long-term real-time measurements of aerosol particle composition in Beijing, China: seasonal variations, meteorological effects, and source analysis. Atmos. Chem. Phys. 2015;15:10149–10165. doi: 10.5194/acp-15-10149-2015. [DOI] [Google Scholar]
- 26.Zheng GJ, Duan FK, Su H. Exploring the severe winter haze in Beijing: the impact of synoptic weather, regional transport and heterogeneous reactions. Atmos. Chem. Phys. 2015;15:2969–2983. doi: 10.5194/acp-15-2969-2015. [DOI] [Google Scholar]
- 27.Quan JN, et al. Effect of heterogeneous aqueous reactions on the secondary formation of inorganic aerosols during haze events. Atmos. Environ. 2015;122:306–312. doi: 10.1016/j.atmosenv.2015.09.068. [DOI] [Google Scholar]
- 28.Marais EA, et al. Aqueous-phase mechanism for secondary organic aerosol formation from isoprene: application to the southeast United States and co-benefit of SO2 emission controls. Atmos. Chem. Phys. 2016;16:1603–1618. doi: 10.5194/acp-16-1603-2016. [DOI] [PMC free article] [PubMed] [Google Scholar]
- 29.Yang, Y., Liao, H. & Lou, S. J. Increase in winter haze over eastern China in recent decades: Roles of variations in meteorological parameters and anthropogenic emissions. J. Geophys. Res. Atmos. 121(21), 10.1002/2016JD025136 (2016).
- 30.He H, et al. Mineral dust and NOx promote the conversion of SO2 to sulfate in heavy pollution days. Sci. Rep. 2014;4:4172. doi: 10.1038/srep04172. [DOI] [PMC free article] [PubMed] [Google Scholar]
- 31.Zhang ZH, Hong YC, Liu N. Association of ambient Particulate matter 2.5 with intensive care unit admission due to pneumonia: a distributed lag non-linear model. Sci. Rep. 2017;7:8679. doi: 10.1038/s41598-017-08984-x. [DOI] [PMC free article] [PubMed] [Google Scholar]
- 32.Whiteaker JR, Suess DT, Prather KA. Effects of meteorological conditions on aerosol composition and mixing state in Bakersfield, CA. Environ. Sci. Technol. 2002;36(11):2345–2353. doi: 10.1021/es011381z. [DOI] [PubMed] [Google Scholar]
- 33.Mues A, et al. Impact of the extreme meteorological conditions during the summer 2003 in Europe on particulate matter concentrations. Atmos. Environ. 2012;55:377–391. doi: 10.1016/j.atmosenv.2012.03.002. [DOI] [Google Scholar]
- 34.Zhang ZY, et al. Evolution of surface O3 and PM2.5 concentrations and their relationships with meteorological conditions over the last decade in Beijing. Atmos. Environ. 2015;108:67–75. doi: 10.1016/j.atmosenv.2015.02.071. [DOI] [Google Scholar]
- 35.Zhang ZY, et al. Possible influence of atmospheric circulations on winter hazy pollution in Beijing-Tianjin-Hebei region, northern China. Atmos. Chem. Phys. 2016;16:561–571. doi: 10.5194/acp-16-561-2016. [DOI] [Google Scholar]
- 36.Yin ZC, Wang HJ, Chen HP. Understanding severe winter haze events in the North China Plain in 2014: roles of climate anomalies. Atmos. Chem. Phys. 2017;17:1641–1651. doi: 10.5194/acp-17-1641-2017. [DOI] [Google Scholar]
- 37.Chen, H. P. & Wang, H. J. Haze Days in North China and the associated atmospheric circulations based on daily visibility data from 1960 to 2012. J. Geophys. Res. Atmos. 120, 10.1002/2015JD023225 (2015).
- 38.Niu F, et al. Increase of wintertime fog in China: Potential impacts of weakening of the Eastern Asian monsoon circulation and increasing aerosol loading. J. Geophys. Res. Atmos. 2010;115:D00K20. doi: 10.1029/2009JD013484. [DOI] [Google Scholar]
- 39.Hien PD, Loc PD, Dao NV. Air pollution episodes associated with East Asian winter monsoons. Sci. Total Environ. 2011;409(23):5063–5068. doi: 10.1016/j.scitotenv.2011.08.049. [DOI] [PubMed] [Google Scholar]
- 40.Qu W, et al. Effect of cold wave on winter visibility over eastern China. J. Geophys. Res. Atmos. 2015;120:2394–2406. doi: 10.1002/2014JD021958. [DOI] [Google Scholar]
- 41.Cheng XG, et al. Implications of East Asian summer and winter monsoons for interannual aerosol variations over central-eastern China. Atmos. Environ. 2016;129:218–228. doi: 10.1016/j.atmosenv.2016.01.037. [DOI] [Google Scholar]
- 42.Li Q, Zhang RH, Wang Y. Interannual variation of the wintertime fog–haze days across central and eastern China and its relation with East Asian winter monsoon. Int. J. Climatol. 2016;36:346–354. doi: 10.1002/joc.4350. [DOI] [Google Scholar]
- 43.Liu Q, et al. Dual effects of the winter monsoon on haze-fog variations in eastern China. J. Geophys. Res. Atmos. 2017;122(11):5857–5869. doi: 10.1002/2016JD026296. [DOI] [Google Scholar]
- 44.Wang JJ, et al. Large-scale transport of PM2.5 in the lower troposphere during winter cold surges in China. Sci. Rep. 2017;7:13238. doi: 10.1038/s41598-017-13217-2. [DOI] [PMC free article] [PubMed] [Google Scholar]
- 45.Zhao S, et al. Decadal variability in the occurrence of wintertime haze in central eastern China tied to the Pacific Decadal Oscillation. Sci. Rep. 2016;6:27424. doi: 10.1038/srep27424. [DOI] [PMC free article] [PubMed] [Google Scholar]
- 46.Xu XD, et al. “Harbor” effect of large topography on haze distribution in eastern China and its climate modulation on decadal variations in haze China (in Chinese) Chin. Sci. Bull. 2015;60:1132–1143. doi: 10.1360/N972014-00101. [DOI] [Google Scholar]
- 47.Cheng YL, Hao QZHJ. Effects of topography on diffusion of thermal discharge in power plant. Procedia Environ. Sci. 2011;11:618–623. doi: 10.1016/j.proenv.2011.12.096. [DOI] [Google Scholar]
- 48.Wang J, et al. Mesoscale modeling of smoke transport over the Southeast Asian Maritime Continent: Interplay of sea breeze, trade wind, typhoon, and topography. Atmos. Res. 2013;122:486–503. doi: 10.1016/j.atmosres.2012.05.009. [DOI] [Google Scholar]
- 49.Grell GA, et al. Fully coupled “online” chemistry within the WRF model. Atmos. Environ. 2005;39:6957–6975. doi: 10.1016/j.atmosenv.2005.04.027. [DOI] [Google Scholar]
- 50.Fast JD, et al. Evolution of ozone, particulates, and aerosol direct radiative forcing in the vicinity of Houston using a fully coupled meteorology-chemistry-aerosol model. J. Geophys. Res. Atmos. 2006;111:D21305. doi: 10.1029/2005JD006721. [DOI] [Google Scholar]
- 51.Kumar R, et al. WRF-Chem simulations of a typical pre-monsoon dust storm in northern India: influences on aerosol optical properties and radiation budget. Atmos. Chem. Phys. 2014;14(5):2431–2446. doi: 10.5194/acp-14-2431-2014. [DOI] [Google Scholar]
- 52.Liu XY, et al. Application of online-coupled WRF/Chem-MADRID in East Asia: Model evaluation and climatic effects of anthropogenic aerosols. Atmos. Environ. 2016;124:321–336. doi: 10.1016/j.atmosenv.2015.03.052. [DOI] [Google Scholar]
- 53.Wang LT, et al. Application of Weather Research and Forecasting Model with Chemistry (WRF/Chem) over northern China: Sensitivity study, comparative evaluation, and policy implications. Atmos. Environ. 2016;124:337–350. doi: 10.1016/j.atmosenv.2014.12.052. [DOI] [Google Scholar]
- 54.Crippa P, et al. Evaluating the skill of high-resolution WRF-Chem simulations in describing drivers of aerosol direct climate forcing on the regional scale. Atmos. Chem. Phys. 2016;16:397–416. doi: 10.5194/acp-16-397-2016. [DOI] [Google Scholar]
- 55.Zhang L, et al. On the severe haze in Beijing during January 2013: Unraveling the effects of meteorological anomalies with WRF-Chem. Atmos. Environ. 2015;104:11–21. doi: 10.1016/j.atmosenv.2015.01.001. [DOI] [Google Scholar]
- 56.Zhang Q, et al. Asian emissions in 2006 for the NASA INTEX-B mission. Atmos. Chem. Phys. 2009;9:5131–5153. doi: 10.5194/acp-9-5131-2009. [DOI] [Google Scholar]
- 57.Li M, et al. MIX: a mosaic Asian anthropogenic emission inventory for the MICS-Asia and the HTAP projects. Atmos. Chem. Phys. Discuss. 2015;15(23):34813–34869. doi: 10.5194/acpd-15-34813-2015. [DOI] [Google Scholar]


