

Abstract
Recent increases in human disturbance pose significant threats to migratory species using collective movement strategies. Key threats to migrants may differ depending on behavioural traits (e.g. collective navigation), taxonomy and the environmental system (i.e. freshwater, marine or terrestrial) associated with migration. We quantitatively assess how collective navigation, taxonomic membership and environmental system impact species' vulnerability by (i) evaluating population change in migratory and non-migratory bird, mammal and fish species using the Living Planet Database (LPD), (ii) analysing the role of collective navigation and environmental system on migrant extinction risk using International Union for Conservation of Nature (IUCN) classifications and (iii) compiling literature on geographical range change of migratory species. Likelihood of population decrease differed by taxonomic group: migratory birds were more likely to experience annual declines than non-migrants, while mammals displayed the opposite pattern. Within migratory species in IUCN, we observed that collective navigation and environmental system were important predictors of extinction risk for fishes and birds, but not for mammals, which had overall higher extinction risk than other taxa. We found high phylogenetic relatedness among collectively navigating species, which could have obscured its importance in determining extinction risk. Overall, outputs from these analyses can help guide strategic interventions to conserve the most vulnerable migrations.
This article is part of the theme issue ‘Collective movement ecology'.
Keywords: migration, birds, mammals, fishes, living planet database, collective navigation
1. Introduction
Migration is one of life's most complex and ecologically consequential behaviours. In recent years, while technological advances have enabled scientists to describe for the first time the complex social mechanisms (e.g. collective navigation) that facilitate many migrations (e.g. [1–9]), scientists have also suggested that many such migrations may be in peril [10,11]. However, more spatially and taxonomically ambitious analyses are needed to help identify what specific factors may control the extinction risk and population status of collectively navigating and other migratory species.
Loss of migration is non-trivial: migratory species have been shown to provide unique functions to ecosystems, such as vectoring nutrients and seeds long distances, maintaining grassland ecosystems through cyclical grazing and providing pulses of prey to resident predators (reviewed in [12]). Economies that are reliant on tourism or harvesting migratory species (e.g. wildebeest migrations in the Serengeti) could suffer from their decline [13,14]. Collective navigation (i.e. group-level pooling of information) aids migratory species' ability to travel long distances, and conserving this behaviour requires maintaining a minimum population size [15], which helps drive important ecological processes [12].
Several studies have reported declines of migratory species, although this research has primarily focused on specific taxonomic groups [11] or is qualitative [16]. Sanderson et al. [17], for example, found European long-distance migratory birds to have declined relative to resident European birds. Similarly, Harris et al. [18] reported that of the 24 large-bodied migratory ungulates they reviewed, six migrations have been lost. However, studies on extinction risk found that migration was not an important predictor of extinction risk [19]. One study on birds even suggested that migration decreased risk of extinction [20].
In the light of these contradicting predictions, exploring how collective navigation, environmental system (i.e. the freshwater, marine or terrestrial system associated with the migratory population) and taxonomy shape vulnerability to population decline and extinction risk could help focus efforts to preserve migrations. Species that travel long distances and rely on multiple habitat types are likely to be disproportionately impacted by human actions [17,21]. Road building, agricultural development and dam construction create barriers for long-distance migratory species [22,23], and such impacts can be further compounded by habitat loss, overharvest and climate change [10,24]. Threats may be even more serious for collectively navigating species. If these populations fall below a threshold size, Allee effect-caused collapses might occur that are difficult or impossible to reverse [15].
The environmental system through which a species migrates can also alter which threats they face; for example, landscape fragmentation and urban development are terrestrial disturbances that will likely have a greater impact on species that migrate on land than on marine or freshwater migrants. Similarly, the comparative lack of human infrastructure and associated fragmentation in marine systems could potentially leave migrating marine species at less risk of extinction [25]. The discrete and comparatively easy-to-modify nature of many freshwater ecosystems (e.g. dams in rivers) may increase risk of extinction for species migrating through these systems [26].
However, some characteristics of migratory species could increase their ability to circumvent potential threats. For example, the synthesized integration of environmental cues can help collective migrants traverse fragmented and complex landscapes [27]. Furthermore, migratory species with large geographical ranges and flexible movement patterns may reduce risk by moving to a new habitat when part of their range is fragmented or degraded [28].
In this study, we follow previous definitions of migration, defining it as cyclical and directed round-trip movement of animals between discrete areas [11]. We restrict this definition to include only movements greater than 100 km in one direction [29]. We leverage the power of two large datasets (International Union for Conservation of Nature Red List (IUCN) and Living Planet Database (LPD)) to examine the status of migrations from three perspectives: (i) by comparing population change over time; (ii) by analysing the role of collective navigation and environmental system (freshwater, marine, terrestrial and their combination) on migrant extinction risk; and (iii) by examining contemporary shifts in the geographical range of migratory species. The results from these multiple perspectives contribute to our general understanding of how well migrations will fare in the Anthropocene and better position us to strategically respond to these risks.
2. Material and methods
(a). Population change over time
(i). Data selection and coding
To evaluate the relative vulnerability of migratory birds, mammals and fishes, we created indices using population change data from the LPD [30]. Reptiles, amphibians and invertebrates were excluded from the analyses because of lack of information in the LPD. The LPD is one of the largest repositories of time-series data relevant to recent population change (see [31] for further details).
For this analysis, we included data on all LPD populations of birds, mammals and fishes (Actinopterygii only, as adequate trend data were available) with sufficient information to determine migratory status. Each population record was coded by its ecological affiliation to three different environmental systems: freshwater, marine and terrestrial. Environmental systems were assigned based on a number of considerations, including where the population spends the majority of its time, which environmental system(s) help sustain the population, and where the population is most threatened (see electronic supplementary material, table S1). Seven candidate biogeographic realms were assigned to terrestrial and freshwater populations and five realms were assigned to marine populations (electronic supplementary material, table S1).
We used the Global Register of Migratory Species (GROMS) for migratory coding [29]. As above, GROMS also defines migration as predictable and cyclical movements of more than 100 km. For details on migratory coding, see electronic supplementary material, tables S2 and S6.
After removing replicates (populations monitored in the same location and at the same time), the final dataset created for analysis included 11 717 populations of 2978 species (electronic supplementary material, table S3).
(ii). Data analysis and statistical methods
To estimate patterns of abundance change, we followed the Living Planet Index (LPI) method and calculated the geometric mean of trends for each species whereby each population time-series with six or more data points was modelled using a generalized additive modelling (GAM) framework [31]. Population time-series with fewer than six data points or those that resulted in a poor GAM fit were modelled using the chain method [32]. In cases with more than one population time-series per species, the modelled annual trends for each population were averaged within each realm, class and realm/class combination to provide a single set of annual trends for each species. These were then averaged across species and converted to index values with a baseline year of 1970. For each index, we generated 95% confidence intervals using a bootstrap resampling technique for 10 000 iterations [31]. These confidence intervals demonstrate the uncertainty in the index values inherited from the baseline in 1970 and propagated through the time-series. An R package, rlpi, for calculating these index values is available at https://github.com/Zoological-Society-of-London/rlpi.
Using these population trends, we explored a range of models to examine the relationship between migratory behaviour and population trends. For total change in abundance across all years, we constructed linear mixed effects models in R using the lme4 package [33,34]. For likelihood of annual increases, beta-binomial models were used to model the ratio of increasing and decreasing years for each population using the glmmadmb package in R [35]. In these comparisons, we also excluded populations with no available GROMS status. Across all models, species and realm were included as random effects. Models were compared using the Akaike information criterion (AIC).
To examine how these differences in migration vulnerability varied by taxonomic grouping, all analyses were repeated for birds, mammals and fishes (for taxonomic breakdown see electronic supplementary material, table S3).
We then further analysed differences for taxonomic groups in select regions for which there were sufficient data for robust comparison between taxa and systems. Although system was not an important factor for birds and mammals overall, regional differences between systems were explored. Many regions did not have sufficient data to run these finer-scale analyses or to compare to other systems or taxa (see electronic supplementary material, tables S4 and S5 for breakdown by realm). To illustrate the nature of these regional-level differences, we focused on the Palearctic and northern temperate Pacific realms because these regions had sufficient data for taxonomic and system comparisons.
(b). Species extinction risk
(i). Data selection and coding
Our second analysis investigated patterns of migrant extinction risk using data from the IUCN Red List [36]. The IUCN database collects information from global assessments based on standardized protocols, which are linked to population size and structure, population trends and geographical range. We extracted data on the threat status and environmental system (terrestrial, marine, freshwater or their combination) for all bird, mammal and fish species listed in both GROMS and IUCN (n = 3447) [36]. The migratory status of each species was coded using GROMS. IUCN species were classified as terrestrial, freshwater, marine or a combination of the three environmental systems based on IUCN's classification scheme (electronic supplementary material, table S6). IUCN threat status was converted to a 1–6 ordinal numerical index (following [37]).
We used the resultant database to test the effects of environmental system (referred to as ‘system') and tendency to collectively navigate on migratory species extinction risk. Owing to considerable gaps in information on whether species directly exhibit collective movement or collective navigation, we coded each species based on proxy measures. Based on findings from the literature exploring the emergent dynamics of collective navigation [15,38], we coded migratory species as putative ‘collective navigators' if they were determined to travel in social groups (e.g. pods, herds, flocks, etc. as distinguished from loose aggregations of non-interacting individuals). Principal databases used for these determinations were FishBase and IUCN Red List (fishes); Avibase, NatureServe, USFWS Migratory Bird Data Center, and BirdLife International (birds); and IUCN and NOAA Fisheries Office of Protected Resources (mammals), which were supplemented with the literature searches. Mammals were coded at the species level. Birds and fishes were coded at higher taxonomic levels to overcome strong geographical biases in data resolution, lack of data accessibility and extreme intraspecific variation in migratory behaviour [39]. Birds were coded at the family level. Fishes were initially coded at the order level for those with strong phylogenetic association of schooling, and groups with mixed schooling behaviour were more thoroughly examined and coded at the family or genus level (electronic supplementary material, table S6).
(ii). Data analysis
We used cumulative link models (clms) to test the effect of system and its interaction with collective movement on IUCN risk category (extinct (EX), extinct in the wild (EW), critically endangered (CR), endangered (EN), vulnerable (VU), near threatened (NT), least concern (LC)) for birds, mammals and fishes. Within each taxonomic class, species were typically found in only a subset of the systems available. For birds, very low sample sizes in freshwater, freshwater/marine and marine systems required that we pool those groups into terrestrial/freshwater, terrestrial/freshwater/marine and terrestrial/marine, respectively. For fishes, only the systems freshwater, freshwater/marine and marine were applicable, and low sample sizes required we pool the highest threat categories (CR, EX and EN) into one highest risk category. For mammals, species that were classified as inhabiting any system that included freshwater (freshwater, freshwater/marine, freshwater/terrestrial and freshwater/marine/terrestrial) were grouped as freshwater to retain an adequate sample size for analyses. When comparing across taxonomic groups, we did not have the proportional odds to compare all threat categories, so the categories were grouped into Lower Risk (LC, NT, VU) and Threatened (EN, CR, EW, EX).
We modelled extinction risk with clms using a flexible threshold and logit link function [40] using the ordinal package in R [41]. We then compared all model subsets using AIC to select the best model of extinction risk. Analysis of deviance tables (ANODE) were then used to evaluate the importance of parameters in the best model [41]. Finally, we conducted Tukey-adjusted pairwise comparisons of the nominal effects of the best model to identify significantly different groupings using the lsmeans package [42].
(c). Geographical range shifts
(i). Data collection and coding
To examine changes in the spatial distribution of migratory species, we conducted a literature search investigating geographical range shifts of any type for migratory species of birds, mammals, fishes and insects. Insects were included in these analyses (and not above) because data were sufficient in the literature to include them in this compilation. All searches were conducted in Web of Science using the search terms ‘migra*' and ‘range', six terms for taxonomic groupings (mammal*, marine mammal*, bird*, fish*, insect*) and four terms denoting geographical change (i.e. shift*, contract*, expand*, change*). We also searched within the citations of the relevant papers for additional papers. This resulted in a total of 5163 papers, of which 66 had quantitatively investigated geographical range shifts in migratory species and produced results concluding some change or no change had occurred (not predictive). All species treated in this literature search were confirmed to match our definition of migration. For each paper, we recorded the study species, taxonomic class and the system and realm as defined by IUCN and matched to the LPD. We then categorized the type of geographical range change for each species as one of four possible categories: contraction, shift, no change or expansion. The data were split taxonomically and by type of geographical range change (see electronic supplementary material, table S7 for coding and literature).
3. Results
(a). Population change over time
(i). Global patterns
When data derived from the LPD from all species, systems and realms were examined together there was no significant difference between migratory and non-migratory species (p = 0.138) (figure 1a).
Figure 1.
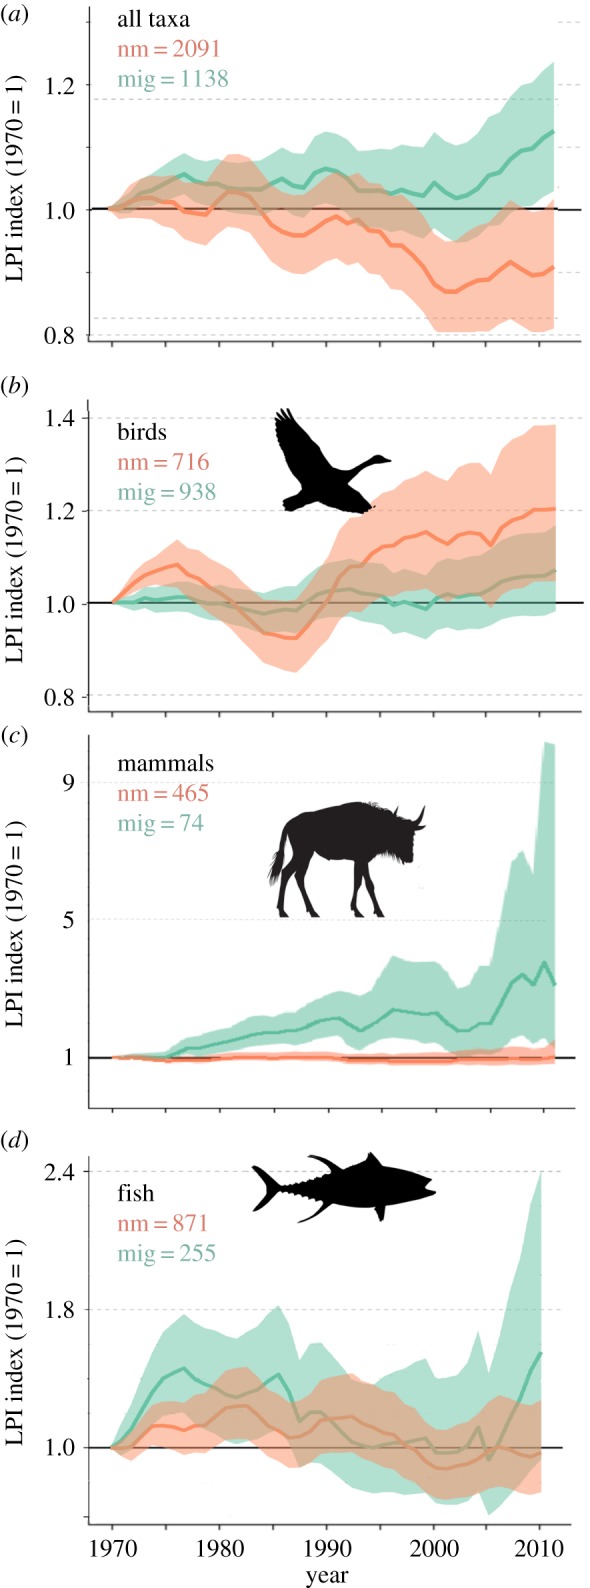
Abundance indices measured over time relative to 1970 baseline values for non-migratory (nm; orange) and migratory (mig; green) species derived from the Living Planet Database. The data in this figure represent a compilation of population time-series from monitored sites around the world. Data are (a) aggregated across all birds, mammals and fishes, and (b–d) subdivided by taxon. The numbers of species included in the analyses are provided in each figure part. (Online version in colour.)
Effect of migration on likelihood of annual increase differed by taxonomic group, with migratory birds significantly more likely to have faced declines than non-migratory birds (p < 0.001; table 1) and migratory mammals significantly less likely to experience annual declines than non-migratory mammals (p = 0.032; table 1). From AIC, the best model for predicting the likelihood of annual increase for birds and mammals was determined to be the simplest model, with Migratory as the only explanatory variable (no interaction between migration and system). However, the best model for fishes was determined to be Migratory × System, which includes the interaction between migration status and system (freshwater and marine). There was no significant difference found between migratory and non-migratory fishes in either system (table 1).
Table 1.
Model results from Living Planet Database likelihood of annual increase analysis for birds, mammals and fishes. Odds ratio, standard error (s.e.) with confidence intervals, Z score and p-value are reported for each taxonomic group, with fishes split into freshwater and marine systems.
| taxonomic group | environmental system | odds ratio | s.e. | Z score | p-value |
|---|---|---|---|---|---|
| birds | all | 1.317 | 0.11 (1.12–1.55) | −4.10 | <0.001 |
| mammals | all | 0.668 | 0.10 (0.496–0.901) | 2.15 | 0.032 |
| fishes | freshwater | 1.173 | 0.15 (0.91–1.51) | −1.37 | 0.171 |
| marine | 0.756 | 0.15 (0.51–1.13) | 1.256 | 0.210 |
(ii). Regional patterns
Data from the LPD were sufficiently robust in nine cases to permit further subdivision and analyses of the pattern at finer regional levels. Of the nine regional trends, six show migratory populations tending to perform worse than non-migratory populations (figure 2; electronic supplementary material, figures S1–S4).
Figure 2.

Regional abundance indices measured relative to 1970 for data rich northern temperate terrestrial and aquatic species in either the Palearctic or Pacific realm. Data are derived for non-migratory (nm; orange) and migratory (mig; green) species from the Living Planet Database. The data in this figure represent a compilation of population time-series from monitored sites around the world. Graphs depict change in abundance indices for (a) Palearctic terrestrial birds, (b) Palearctic freshwater birds, (c) Palearctic terrestrial mammals and (d) Pacific marine fishes. Numbers of species included in analyses are provided in each figure. (Online version in colour.)
In the Palearctic and Pacific regions, migratory populations performed worse than non-migratory populations for each group (figure 2), with the exception of Pacific marine birds, for which migratory and non-migratory species appear to have been on similar trajectories (electronic supplementary material, figure S2). Terrestrial and freshwater Palearctic migratory birds are both faring worse than non-migrants (figure 2a,b), which matches the taxonomic level results. The trend for terrestrial Palearctic mammal change over time is different from the overall results for mammals; here, Palearctic terrestrial migrants are doing worse than non-migrants (figure 2c). Similarly, migratory Pacific marine fishes appear to be doing worse than non-migrants (figure 2d), whereas there was no significance in the taxonomic analysis. For LPIs used to create the figures, see electronic supplementary material, table S8.
(b). Species extinction risk
Within all migratory species, analysis of IUCN data indicates that extinction risk differed significantly among taxonomic groups. Migratory mammals were more likely to be placed in a higher extinction risk category than either migratory fishes or birds (table 2). Analyses within taxonomic groups yielded additional insights: for birds and fishes, the best model included model terms System, Collective behaviour and their interaction. However, no model outperformed the null for mammals (electronic supplementary material, table S9). Extinction risk was higher for non-collective migratory birds in some systems, but not all (table 2). Migratory birds in terrestrial/marine systems (seabirds) had a higher risk of extinction than avian migrants in other systems; non-collective migratory seabirds were at greater risk of extinction than collective migratory seabirds.
Table 2.
Analysis of deviance (ANODE) table and Tukey-adjusted pairwise comparisons of model coefficients for all IUCN extinction risk analyses. ANODE results shown at left correspond to the best model of extinction risk for each analysis. Pairwise comparisons for group differences in each best model are shown on the right. Species were coded as collective migrants based upon database or literature indicating they travel in social groups. Environmental system (freshwater, marine, terrestrial or their combination) was coded from IUCN classifications. The mammal model showed no difference from the null and thus comparisons were not possible. Group levels denote significant differences from pairwise comparisons within each dataset for birds, fishes, mammals and all taxa. Lowercase lettering (i.e. ‘a') indicates a lower risk of extinction than higher lettering; ‘b–d', least-square means and asymptotes of their 95% confidence limits were used to differentiate groups, but their numeric values are arbitrary; these are listed in electronic supplementary material, table S9.
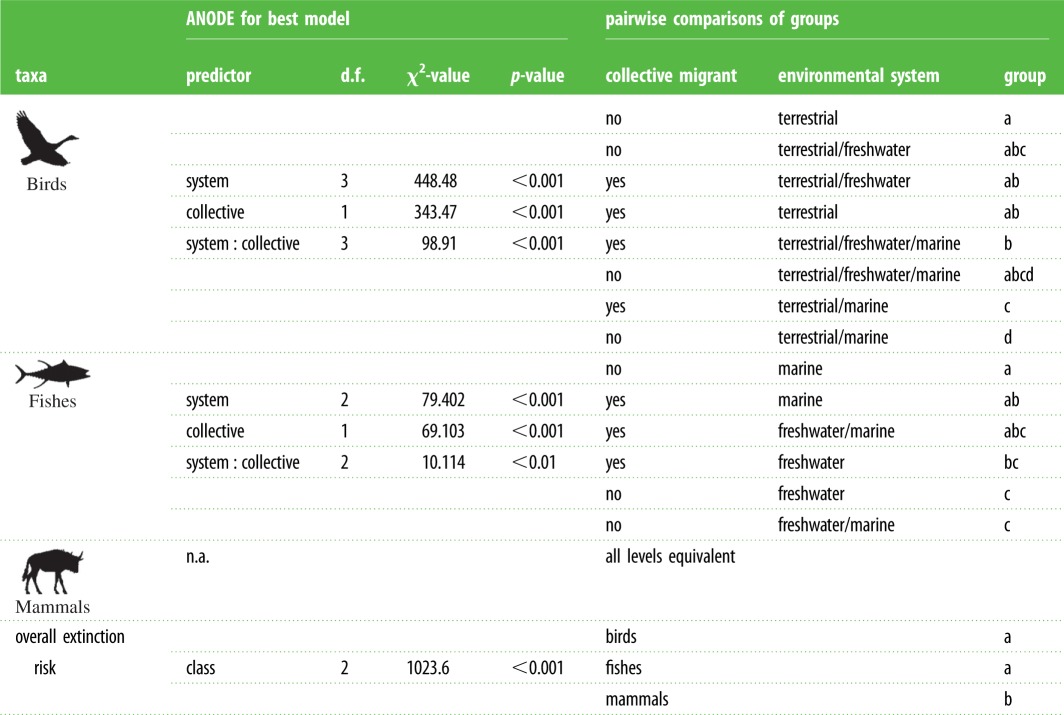 |
For fishes, the best model was the full model that included the interaction of system and collective behaviour. The interaction was significant (p < 0.001; table 2); for collective migrants, marine fishes were placed in lower risk categories than their freshwater counterparts. Non-collective freshwater and anadromous migrants were substantially more at risk of extinction than any marine migrants (table 2).
(c). Geographical range shift
The literature review of geographical range change of migratory species produced different patterns of change for birds (n = 451), mammals (n = 30), fishes (n = 138) and insects (n = 107) (figure 3). Eighty per cent of the bird records indicated shifts in geographical range, with the remaining records indicating contractions or expansions. Fish literature produced the second-largest source of records on geographical range change of all the taxonomic groups, with the majority (73%) of these records experiencing range contractions. Although there were relatively few records of mammal geographical range change, 47% of mammal records indicated range contractions. There was extremely low taxonomic diversity in data available on insect geographical range, with all records identified coming from Lepidoptera. Seventy per cent of these records showed range expansions.
Figure 3.

Proportion of types of migratory range changes reported for migratory insects (i.e. butterflies), birds, mammals and fishes. Range changes can be contractions, shifts (i.e. change in geographic location), expansions or no change. Width of x-axis represents relative sample size of taxonomic groups. The number of records of change for each taxonomic group is reported. (Online version in colour.)
4. Discussion
Our global analysis of population change across all taxa did not reveal discernible differences between migratory and non-migratory species; however, analyses of spatially and taxonomically disaggregated data revealed that migration vulnerability and extinction risk are highly context-dependent.
(a). Overall taxonomic vulnerability
Across all taxonomic groups, migration did not consistently predict vulnerability to population decline. This suggests that characteristics of taxonomic groups, such as evolutionary history, determine how migration interacts with other variables (i.e. environmental system and collective navigation).
(b). Birds
In agreement with previous studies that used different data sources and analytical approaches [17,43], we observed elevated vulnerability for migratory birds relative to non-migratory birds (table 1). One possible explanation for the elevated vulnerability of migratory birds is that they are subject to ‘multiple jeopardy' because they require many different sites throughout their annual cycles: stopover sites, overwintering habitat and breeding grounds [21]. Recent field studies have found disproportionate rates of bird mortality during migratory periods (e.g. raptor mortality was six times higher during migration than stationary periods; [44]), and habitat loss in breeding or overwintering grounds is a significant threat to migratory birds [45]. While migratory birds are disproportionately vulnerable to population decline compared to non-migratory birds, overall extinction risk for birds in IUCN is lower than mammal extinction risk (table 2). This indicates that while migratory bird populations are more likely to decrease than non-migratory birds, many migratory bird populations are still relatively robust and there is high potential for conservation.
(c). Mammals
Contrary to the well-documented losses of high profile mammal migrations [18,46], our population analysis suggests that migratory mammals were more likely to increase annually than non-migrants. The vagility of migratory mammals could aid their ability to escape anthropogenic threats in areas where non-migrants would have more difficulty moving territories. Additionally, migratory mammals appear to receive disproportionate conservation attention due to their visibility (e.g. ungulate herds and great whales) and influence on tourist-based economies (e.g. safaris and whale-watching), which have helped motivate the direct investment of conservation funds and attention to such species (e.g. rinderpest eradication; [47]).
Despite the increases of migratory mammals relative to non-migrants, IUCN lists migratory mammals in higher threat categories than birds or fishes (table 2). This discrepancy likely derives from the different time periods and variables considered (e.g. IUCN considers variables such as population size and connectivity that the LPD does not). This is likely true also for birds and fishes.
It is also important to note that increasing the abundance of migratory mammals is a necessary but not sufficient condition for the persistence of the migrations themselves. South African wildlife, for example, is often managed in carefully controlled fenced plots. This has facilitated population increases for a number of species in recent years, but this management strategy effectively eradicates migration potential [48,49].
(d). Fishes
There was no significant difference in the likelihood of annual population increase between migratory and non-migratory fishes. In our environmental system-level analyses of IUCN data, however, migratory freshwater fishes were at more risk of extinction than migratory marine fishes (table 2). Marine fishes face immense threats from overharvest; but, as with other taxa, the mobility of marine migrants could allow migrants to more successfully avoid anthropogenic threats, whereas migratory freshwater fishes are less able to escape habitat modification, pollution and water extractions [23,50].
(e). Regional vulnerability
Data limitations made regional analyses challenging, but in the northern temperate Palearctic and Pacific realms, migrants were more vulnerable to extinction than non-migrants across all environmental systems (figure 2). Terrestrial and freshwater migratory birds were again more vulnerable than non-migrants (figure 2a,b); although, the heightened vulnerability of terrestrial mammal and marine fish migrants relative to non-migrants differs from the overall results for mammals and fishes (figure 2c,d). This suggests that declines in migratory populations can be obscured in the aggregated data and emphasizes the need to examine migrants in their local context.
(f). Collective navigation
As previously discussed, collective navigation could be either an aid or a liability for migratory species. While the best model for bird and fish extinction risk included collective navigation, extinction risk did not differ significantly between collective and non-collective species for most groups. However, the lower risk of collectively moving migratory seabirds relative to non-collectively moving migratory seabirds suggests there might be some benefit to seabirds moving in flocks, in that they are better able to avoid threats than their non-flocking counterparts (e.g. [51]). It is interesting to note that migratory seabirds have the highest risk of extinction as compared to the migratory birds in other environmental systems (table 2). The reliance of seabirds on both terrestrial spaces for breeding and marine spaces for feeding could elevate their extinction risk [52], while collective navigation could aid their immense movements and unique use of different resources and habitats. Although collective navigation seems to aid migratory seabirds, the overall population declines in migratory birds are concerning, given the observed relationship between collective navigation and population abundance [15]. With continued decline, collectively moving migrants could face the threat of population collapse.
We did not find evidence in migratory mammals for an effect of collective movement. However, the small sample size of migratory mammals in several environmental systems may have played a role in our inability to detect differences between collective and non-collective migrants. It is interesting to note, however, that the most threatened migratory mammal (i.e. Critically Endangered and Extinct in the Wild) species were collective migrants. While largely a benefit, the reliance of collectively navigating species on inter-individual cues can also result in cascading consequences when one individual makes a mistake (e.g. failed wildebeest river crossings). Increasing anthropogenic change could result in greater potential for mistakes and greater cost to collective migrants.
Although fishes similarly showed no significant interactions between extinction risk and collective movement, non-collectively moving freshwater and diadromous fishes were more likely to be placed in higher threat categories than the rest of the migratory fishes, once again at least partially suggesting some benefit to moving collectively.
Finally, while coding for collective movement we found that species that tend to move in social groups were typically phylogenetically related (electronic supplementary material, table S6). The interrelatedness of collectively moving species could be a confounding factor in this analysis, potentially obscuring the importance of collective navigation.
(g). Geographical range
Restricting movement, particularly access to key resources, also endangers migrations [18]. As with previous results, the literature review on migratory species' geographical range suggests that the type of range change differs between taxonomic groups. Insects (i.e. butterflies) mostly exhibited expansions in range (figure 3), which have largely been attributed to increasing temperatures in temperate areas such as Europe, where many such studies are concentrated [53]. The majority of studies on bird ranges only documented overall shifts, likely because many bird studies were not able to track bird populations across their entire range, thus limiting their ability to conclude whether an absence in one area represented a contraction or simply a change in geographical location. Shifts in migratory birds could be due to a variety of factors, including habitat loss and climate change [54]. The contractions in migratory mammals seem to support the notion that while migratory mammals are faring better than non-migrants with respect to population change, threats to the functional integrity of mammal migrants may still exist. Both freshwater and marine fishes exhibited contractions, with the contractions in freshwater fishes largely due to damming of rivers [55] and marine fish contractions likely caused by intense fishing pressure extirpating even highly mobile species from parts of their range [56].
It is interesting to note that aerially mobile migratory groups (i.e. insects and birds) experienced many expansions and shifts, while the groups restricted to land and water movement (i.e. mammals and fishes) appeared to experience more contractions in range. The energetic cost of moving on land and the potential for barriers in aquatic and terrestrial systems might decrease the ability of mammals and fish to respond to anthropogenic changes relative to aerially mobile species [22]. We posit that these patterns support the idea that locomotion on land or in water might expose migratory species to increased threat from anthropogenic habitat fragmentation (e.g. roads, dams, deforestation), but other correlates need to be considered to make such links definitive.
(h). Caveats
We draw attention to four key limitations inherent to these analyses. First, we highlight the recent nature of the abundance comparisons (population trends were examined relative to a baseline of 1970), which would not detect population declines for species that were negatively impacted prior to 1970 (e.g. marine mammals). Second, the LPI relies on aggregated publicly available data and is therefore prone to biases associated with over-representation of certain taxa and regions [57], specifically towards temperate regions (electronic supplementary material, tables S4 and S5). We analysed the LPD data in both aggregate and within disaggregated regions, but were unable to use the diversity-weighted approach normally employed to account for such biases [57] due to availability of data and species numbers. While we fully agree that there are biases and pitfalls to this approach, previous analyses of these biases indicate that even an unweighted index is likely indicative of overall patterns [31]. While the LPD does contain trends on commercially important species, the impact of these is reduced through the inclusion of harvest or catch data only if they include a measure of effort. Third, our study purposefully does not thoroughly examine correlates for extinction risk, as many studies have already usefully done [20,37]. We focused on patterns and trends in migratory species, necessitating further study to conclusively identify mechanisms behind observed patterns of vulnerability and extinction risk for migrants. Fourth, GROMS does not comprehensively cover all migratory species. GROMS includes a total of 4472 records, of which approximately 3400 migratory species are also in IUCN.
5. Conclusion
In the instances where migration is indeed under threat, we risk losing important ecological functions and charismatic biological phenomena. From these analyses, it is clear that migration vulnerability is dependent on complex interactions between behavioural traits, taxonomy and the environmental system through which the species navigates. Species with a high potential for collective navigation might be able to more efficiently avoid threats in certain environmental systems (i.e. marine birds, freshwater and diadromous fishes), but collective navigation could amplify the vulnerability of declining species, such as migratory terrestrial mammals in the Palearctic. Migratory bird populations are disproportionately vulnerable compared with non-migrants, whereas migratory mammals are less vulnerable than non-migrants. However, the overall pattern of high extinction risk in mammals, coupled with the high proportion of range contractions experienced by migratory mammals, is concerning. Spatial distribution of migratory mammals, rather than population declines, might be more relevant to preserving their migrations. While there is certainly cause for concern, some of our results suggest possibilities for recovery, namely: recent increases in certain migratory mammals, potential benefits of collective navigation, and remaining high abundances of birds despite declines.
Of note, if we aim to recover the functional significance of migration, we cannot simply focus on increasing the population sizes of migratory species, but need to ensure that these important increases are matched with recovered ecological potential for these larger groups to meaningfully execute migration. In our increasingly fragmented world, the latter goal perhaps is more challenging than the former. The broader patterns reported here suggest both an opportunity and a roadmap for mounting strategic interventions to protect this ecologically, socially and economically important part of the behavioural portfolio of life.
Supplementary Material
Supplementary Material
Supplementary Material
Supplementary Material
Acknowledgements
We thank Francis Joyce and Michael Kapuscik for assistance with data synthesis and computation. We thank the two anonymous reviewers for their constructive comments on an earlier version of the manuscript.
Data accessibility
All IUCN, geographical range data and LPD model outputs and synthesized information used in this project are included as the electronic supplementary material. LPD raw data can be found at http://www.livingplanetindex.org/.
Authors' contributions
M.H.-M., D.J.M., G.C.T., E.M.D., K.S., H.S.Y., M.K., A.B., A.M.-t.K., D.O., L.F.H. designed the concept of the study. M.H.-M., G.C.T., E.M.D., K.S., M.K., A.B., A.M.-t.K., D.O., L.F.H. found, synthesized and interpreted data. R.F. and S.D. provided, analysed and helped interpret all LPD data. G.C.T. analysed IUCN data. E.M.D. and K.S analysed geographical range data. M.H.-M. wrote the manuscript with input from D.J.M., and all authors contributed to revisions.
Competing interests
We have no competing interests.
Funding
Funding for authors came from UC Santa Barbara, World Wildlife Fund, Benioff Ocean Initiative and National Science Foundation. This paper was an outcome of the Sante Fe Institute working group funded by NSF grant no. IOS-1545888.
References
- 1.Berdahl AM, Kao AB, Flack A, Westley PAH, Codling EA, Couzin ID, Dell AI, Biro D. 2018. Collective animal navigation and migratory culture: from theoretical models to empirical evidence. Phil. Trans. R. Soc. B 373, 20170009 ( 10.1098/rstb.2017.0009) [DOI] [PMC free article] [PubMed] [Google Scholar]
- 2.Hughey LF, Hein AM, Strandburg-Peshkin A, Jensen FH. 2018. Challenges and solutions for studying collective animal behaviour in the wild. Phil. Trans. R. Soc. B 373, 20170005 ( 10.1098/rstb.2017.0005) [DOI] [PMC free article] [PubMed] [Google Scholar]
- 3.Calabrese JM, Fleming CH, Fagan WF, Rimmler M, Kaczensky P, Bewick S, Leimgruber P, Mueller T. 2018. Disentangling social interactions and environmental drivers in multi-individual wildlife tracking data. Phil. Trans. R. Soc. B 373, 20170007 ( 10.1098/rstb.2017.0007) [DOI] [PMC free article] [PubMed] [Google Scholar]
- 4.del M Delgado M, Miranda M, Alvarez SJ, Gurarie E, Fagan WF, Penteriani V, di Virgilio A, Morales JM. 2018. The importance of individual variation in the dynamics of animal collective movements. Phil. Trans. R. Soc. B 373, 20170008 ( 10.1098/rstb.2017.0008) [DOI] [PMC free article] [PubMed] [Google Scholar]
- 5.Nagy M, Couzin ID, Fiedler W, Wikelski M, Flack A. 2018. Synchronization, coordination and collective sensing during thermalling flight of freely migrating white storks. Phil. Trans. R. Soc. B 373, 20170011 ( 10.1098/rstb.2017.0011) [DOI] [PMC free article] [PubMed] [Google Scholar]
- 6.Sasaki T, Mann RP, Warren KN, Herbert T, Wilson T, Biro D. 2018. Personality and the collective: bold homing pigeons occupy higher leadership ranks in flocks. Phil. Trans. R. Soc. B 373, 20170038 ( 10.1098/rstb.2017.0038) [DOI] [PMC free article] [PubMed] [Google Scholar]
- 7.Strandburg-Peshkin A, Papageorgiou D, Crofoot MC, Farine DR. 2018. Inferring influence and leadership in moving animal groups. Phil. Trans. R. Soc. B 373, 20170006 ( 10.1098/rstb.2017.0006) [DOI] [PMC free article] [PubMed] [Google Scholar]
- 8.Sumpter DJT, Szorkovszky A, Kotrschal A, Kolm N, Herbert-Read JE. 2018. Using activity and sociability to characterize collective motion. Phil. Trans. R. Soc. B 373, 20170015 ( 10.1098/rstb.2017.0015) [DOI] [PMC free article] [PubMed] [Google Scholar]
- 9.Torney CJ, Lamont M, Debell L, Angohiatok RJ, Leclerc L-M, Berdahl AM. 2018. Inferring the rules of social interaction in migrating caribou. Phil. Trans. R. Soc. B 373, 20170385 ( 10.1098/rstb.2017.0385) [DOI] [PMC free article] [PubMed] [Google Scholar]
- 10.Wilcove DS, Wikelski M. 2008. Going, going, gone: is animal migration disappearing? PLoS Biol. 6, 1361–1364. ( 10.1371/journal.pbio.0060188) [DOI] [PMC free article] [PubMed] [Google Scholar]
- 11.Berger J. 2004. The last mile: how to sustain long-distance migration in mammals. Conserv. Biol. 18, 320–331. ( 10.1111/j.1523-1739.2004.00548.x) [DOI] [Google Scholar]
- 12.Bauer S, Hoye BJ. 2014. Migratory animals couple biodiversity and ecosystem functioning worldwide. Science 344, 1242552 ( 10.1126/science.1242552) [DOI] [PubMed] [Google Scholar]
- 13.Anderson LE, Lee ST. 2013. Untangling the recreational value of wild and hatchery salmon. Mar. Resour. Econ. 28, 175–197. ( 10.5950/0738-1360-28.2.175) [DOI] [Google Scholar]
- 14.Grunewald C, Schleuning M, Bohning-Gaese K. 2016. Biodiversity, scenery and infrastructure: factors driving wildlife tourism in an African savannah national park. Biol. Conserv. 201, 60–68. ( 10.1016/j.biocon.2016.05.036) [DOI] [Google Scholar]
- 15.Berdahl A, van Leeuwen A, Levin SA, Torney CJ. 2016. Collective behavior as a driver of critical transitions in migratory populations. Mov. Ecol. 4, 18 ( 10.1186/s40462-016-0083-8) [DOI] [PMC free article] [PubMed] [Google Scholar]
- 16.Wilcove D. 2007. No way home: the decline of the world's great animal migrations. Washington, DC: Island Press. [Google Scholar]
- 17.Sanderson FJ, Donald PF, Pain DJ, Burfield IJ, van Bommel FPJ. 2006. Long-term population declines in Afro-Palearctic migrant birds. Biol. Conserv. 131, 93–105. ( 10.1016/j.biocon.2006.02.008) [DOI] [Google Scholar]
- 18.Harris G, Thirgood S, Hopcraft JGC, Cromsigt JPGM, Berger J. 2009. Global decline in aggregated migrations of large terrestrial mammals. Endanger. Species Res. 7, 55–76. ( 10.3354/esr00173) [DOI] [Google Scholar]
- 19.Davidson AD, Boyer AG, Kim H, Pompa-Mansilla S, Hamilton MJ, Costa DP, Ceballos G, Brown JH. 2012. Drivers and hotspots of extinction risk in marine mammals. Proc. Natl Acad. Sci. USA 109, 3395–3400. ( 10.1073/pnas.1121469109) [DOI] [PMC free article] [PubMed] [Google Scholar]
- 20.Lee TM, Jetz W. 2011. Unravelling the structure of species extinction risk for predictive conservation science. Proc. R. Soc. B 278, 1329–1338. ( 10.1098/rspb.2010.1877) [DOI] [PMC free article] [PubMed] [Google Scholar]
- 21.Gilroy JJ, Gill JA, Butchart SHM, Jones VR, Franco AMA. 2016. Migratory diversity predicts population declines in birds. Ecol. Lett. 19, 308–317. ( 10.1111/ele.12569) [DOI] [PubMed] [Google Scholar]
- 22.Foley JA, et al. 2005. Global consequences of land use. Science 309, 570–574. ( 10.1126/science.1111772) [DOI] [PubMed] [Google Scholar]
- 23.Zarfl C, Lumsdon AE, Berlekamp J, Tydecks L, Tockner K. 2015. A global boom in hydropower dam construction. Aquat. Sci. 77, 161–170. ( 10.1007/s00027-014-0377-0) [DOI] [Google Scholar]
- 24.McCauley DJ, et al. 2014. Reliance of mobile species on sensitive habitats: a case study of manta rays (Manta alfredi) and lagoons. Mar. Biol. 161, 1987–1998. ( 10.1007/s00227-014-2478-7) [DOI] [Google Scholar]
- 25.McCauley DJ, Pinsky ML, Palumbi SR, Estes JA, Joyce FH, Warner RR. 2015. Marine defaunation: animal loss in the global ocean. Science 347, 247–254. ( 10.1126/science.1255641) [DOI] [PubMed] [Google Scholar]
- 26.Reynolds JD, Webb TJ, Hawkins LA. 2005. Life history and ecological correlates of extinction risk in European freshwater fishes. Can. J. Fish. Aquat. Sci. 62, 854–862. ( 10.1139/f05-066) [DOI] [Google Scholar]
- 27.Fryxell JM, Berdahl AM. 2018. Fitness trade-offs of group formation and movement by Thomson's gazelles in the Serengeti ecosystem. Phil. Trans. R. Soc. B 373, 20170013 ( 10.1098/rstb.2017.0013) [DOI] [PMC free article] [PubMed] [Google Scholar]
- 28.Calvert AM, Mackenzie SA, Flemming JM, Taylor PD, Walde SJ. 2012. Variation in songbird migratory behavior offers clues about adaptability to environmental change. Oecologia 168, 849–861. ( 10.1007/s00442-011-2119-5) [DOI] [PubMed] [Google Scholar]
- 29.Riede K.2004. Global register of migratory species: from global to regional scales. Final Report of the R&D Project 808-05-081 (CD-ROM). Bonn, Germany: Federal Agency for Nature Conservation.
- 30.2017. Living Planet Index database. LPI 2017. See www.livingplanetindex.org/ (accessed on 11 May 2017).
- 31.Collen B, Loh J, Whitmee S, McRae L, Amin R, Baillie JEM. 2009. Monitoring change in vertebrate abundance: the Living Planet Index. Conserv. Biol. 23, 317–327. ( 10.1111/j.1523-1739.2008.01117.x) [DOI] [PubMed] [Google Scholar]
- 32.Loh J, Green RE, Ricketts T, Lamoreux J, Jenkins M, Kapos V, Randers J. 2005. The Living Planet Index: using species population time series to track trends in biodiversity. Phil. Trans. R. Soc. B 360, 289–295. ( 10.1098/rstb.2004.1584) [DOI] [PMC free article] [PubMed] [Google Scholar]
- 33.R Development Core Team. 2013. R: A language and environment for statistical computing Vienna, Austria: R Foundation for Statistical Computing; (http://www.R-project.org/) [Google Scholar]
- 34.Bates D, Maechler M, Bolker B, Walker S. 2015. Fitting linear mixed-effects models using lme4. J. Stat. Softw. 67, 1–48. ( 10.18637/jss.v067.i01) [DOI] [Google Scholar]
- 35.Fournier D, Skaug H, Ancheta J, Ianelli J, Magnusson A, Maunder M, Nielsen A, Sibert J. 2012. AD Model Builder: using automatic differentiation for statistical inference of highly parameterized complex nonlinear models. Optim. Methods Softw. 27, 233–249. ( 10.1080/10556788.2011.597854) [DOI] [Google Scholar]
- 36.IUCN. 2017. The IUCN Red List of Threatened Species. Version 2017-1. See http://www.iucnredlist.org. (Downloaded 1 May 2017.)
- 37.Cardillo M, Mace GM, Jones KE, Bielby J, Bininda-Emonds ORP, Sechrest W, Orme CDL, Purvis A. 2005. Multiple causes of high extinction risk in large mammal species. Science 309, 1239–1242. ( 10.1126/science.1116030) [DOI] [PubMed] [Google Scholar]
- 38.De Luca G, Mariani P, MacKenzie BR, Marsili M.. 2014. Fishing out collective memory of migratory schools. J. R. Soc. Interface 11, 20140043 ( 10.1098/rsif.2014.0043) [DOI] [PMC free article] [PubMed] [Google Scholar]
- 39.Helbig AJ. 2003. Evolution of bird migration: a phylogenetic and biogeographic perspective. In Avian migration (eds Berthold P, Gwinner E, Sonnenschein E), pp. 3–20. Berlin, Germany: Springer Science and Business Media. [Google Scholar]
- 40.McCullagh P. 1980. Regression models for ordinal data. J. R. Stat. Soc. Ser. B 42, 109–142. [Google Scholar]
- 41.Christensen RHB. 2015. ordinal - Regression Models for Ordinal Data. R package version 2015.6-28. (http://www.cran.rproject.org/package=ordinal/).
- 42.Lenth RV. 2016. Least-squares means: the R package lsmeans. J. Stat. Softw. 69, 1–33. ( 10.18637/jss.v069.i01) [DOI] [Google Scholar]
- 43.Robbins CS, Sauer JR, Greenberg RS, Droege S. 1989. Population declines in North American birds that migrate to the neotropics. Proc. Natl Acad. Sci. USA 86, 7658–7662. ( 10.1073/pnas.86.19.7658) [DOI] [PMC free article] [PubMed] [Google Scholar]
- 44.Klaassen RHG, Hake M, Strandberg R, Koks BJ, Trierweiler C, Exo KM, Bairlein F, Alerstam T. 2014. When and where does mortality occur in migratory birds? Direct evidence from long-term satellite tracking of raptors. J. Anim. Ecol. 83, 176–184. ( 10.1111/1365-2656.12135) [DOI] [PubMed] [Google Scholar]
- 45.Taylor CM, Stutchbury BJM. 2016. Effects of breeding versus winter habitat loss and fragmentation on the population dynamics of a migratory songbird. Ecol. Appl. 26, 424–437. ( 10.1890/14-1410.1) [DOI] [PubMed] [Google Scholar]
- 46.Berger J, Young JK, Berger KM. 2008. Protecting migration corridors: challenges and optimism for mongolian saiga. PLoS Biol. 6, 1365–1367. ( 10.1371/journal.pbio.0060165) [DOI] [PMC free article] [PubMed] [Google Scholar]
- 47.Mariner JC, House JA, Mebus CA, Sollod AE, Chibeu D, Jones BA, Roeder PL, Admassu B, van't Klooster GGM. 2012. Rinderpest eradication: appropriate technology and social innovations. Science 337, 1309–1312. ( 10.1126/science.1223805) [DOI] [PubMed] [Google Scholar]
- 48.Boone RB, Hobbs NT. 2004. Lines around fragments: effects of fencing on large herbivores. Af. J. Range Forage Sci. 21, 147–158. ( 10.2989/10220110409485847) [DOI] [Google Scholar]
- 49.Woodroffe R, Hedges S, Durant SM. 2014. To fence or not to fence. Science 344, 46–48. ( 10.1126/science.1246251) [DOI] [PubMed] [Google Scholar]
- 50.Young HS, McCauley DJ, Galetti M, Dirzo R. 2016. Patterns, causes and consequences of anthropocene defaunation. Annu. Rev. Ecol. Evol. Syst. 47, 333–358. ( 10.1146/annurev-ecolsys-112414-054142) [DOI] [Google Scholar]
- 51.Orpwood JE, Magurran AE, Armstrong JD, Griffiths SW. 2008. Minnows and the selfish herd: effects of predation risk on shoaling behaviour are dependent on habitat complexity. Anim. Behav. 76, 143–152. ( 10.1016/j.anbehav.2008.01.016) [DOI] [Google Scholar]
- 52.Young HS, McCauley DJ, Dunbar RB, Dirzo R. 2010. Plants cause ecosystem nutrient depletion via the interruption of bird-derived spatial subsidies. Proc. Natl Acad. Sci. USA 107, 2072–2077. ( 10.1073/pnas.0914169107) [DOI] [PMC free article] [PubMed] [Google Scholar]
- 53.Sparks T, Roy D, Dennis R. 2005. The influence of temperature on migration of Lepidoptera into Britain. Glob. Chang. Biol. 11, 507–514. ( 10.1111/j.1365-2486.2005.00910.x) [DOI] [Google Scholar]
- 54.Robinson RA, et al. 2009. Travelling through a warming world: climate change and migratory species. Endanger. Species Res. 7, 87–99. ( 10.3354/esr00095) [DOI] [Google Scholar]
- 55.Fukushima M, Kameyama S, Kaneko M, Nakao K, Steel EA. 2007. Modelling the effects of dams on freshwater fish distributions in Hokkaido, Japan. Freshw. Biol. 52, 1511–1524. ( 10.1111/j.1365-2427.2007.01783.x) [DOI] [Google Scholar]
- 56.Worm B, Tittensor DP. 2011. Range contraction in large pelagic predators. Proc. Natl Acad. Sci. USA 108, 11 942–11 947. ( 10.1073/pnas.1102353108) [DOI] [PMC free article] [PubMed] [Google Scholar]
- 57.McRae L, Deinet S, Freeman R. 2017. The diversity-weighted living planet index: controlling for taxonomic bias in a global biodiversity indicator. PLoS ONE 2, e0169156 ( 10.1371/journal.pone.0169156) [DOI] [PMC free article] [PubMed] [Google Scholar]
Associated Data
This section collects any data citations, data availability statements, or supplementary materials included in this article.
Supplementary Materials
Data Availability Statement
All IUCN, geographical range data and LPD model outputs and synthesized information used in this project are included as the electronic supplementary material. LPD raw data can be found at http://www.livingplanetindex.org/.