Abstract
Fractal analysis is a widely used tool to analyze the geometrical complexity of biological structures. The geometry of natural objects such as plants, clouds, cellular structures, blood vessel, and many others cannot be described sufficiently with Euclidian geometric properties, but can be represented by a parameter called the fractal dimension. Here we show that a specific estimate of fractal dimension, the correlation dimension, is able to describe changes in the structural complexity of the human brain, based on data from magnetic resonance diffusion imaging. White matter nerve fiber bundles, represented by tractograms, were analyzed with regards to geometrical complexity, using fractal geometry. The well-known age-related change of white matter tissue was used to verify changes by means of fractal dimension. Structural changes in the brain were successfully be observed and quantified by fractal dimension and compared with changes in fractional anisotropy.
Introduction
In the late sixties Benoit Mandelbrot developed a mathematical concept to describe geometrical structures, denoted as fractals, whose measured metric properties (length, area or volume) depend on the scale of measurement. A fractal can be defined as a set, whose fractal dimension (FD) is a non-integer value between the topological dimension, which is zero for a point, one for a curve and two for a plane, and its embedding dimension. With this, FD can describe geometrical features such as self-similarity or space-filling properties of textures or structures that are obtained by stochastic processes. In his pioneering work “How long is the coast of Britain1?” Mandelbrot paved the way for the field of fractal analysis, a mathematical framework describing geometrical structures that cannot be characterized sufficiently with Euclidian geometry. For a natural structure or an image, the fractal dimension cannot be calculated exactly, but is usually approximated as the ratio of change in detail with change in scale, plotted in a double logarithmic plot where the slope provides an estimate of FD.
In the last two decades, a huge variety of applications utilizing fractal analysis have been published on different biomedical fields from the analysis of DNA base sequences2 and the classification of biological structures3 to the description of microvascularity in gliomas4,5. The complex structures of the brain have been extensively investigated using fractal methods focusing on the brain’s surface6, the geometrical complexity of white matter7, changes in the structure of the cerebrovascular system8 due to pathologies and for analyzing the complex structure of neural networks9,10. Fractal analysis of the brain’s geometrical structure was correlated with pathologies such as Multiple Scleroses11,12 or Alzheimer’s disease13, suggesting that structural alterations, specifically in white matter structure, can be captured by changes in FD. Considering these studies, FD seems to be a sensitive biomarker for changes in the geometrical complexity of the brain.
Structural changes of the brain, that concern all of us, are due to a normal aging process and effects the brain on many levels including vascularization14, atrophy15, changes in cortical and subcortical regions16,17 and changes in myelination. Cerebral white matter is subject to structural changes during the entire life-span, which has been shown in several MRI studies18,19. Diffusion tensor imaging revealed that the fractional anisotropy (FA), a measure for the anisotropy of the diffusion process, increases in the first three decades and decreases in the following decades19–22. However, age-related changes of the brain structure are closely linked to mental fitness and cognitive performance23. Hence, a quantification of structural changes is of highest interest.
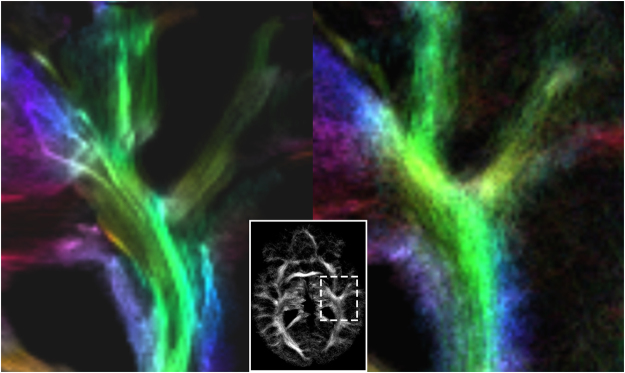
When analyzing changes in FD of white matter structure, two strategies are mainly used. Firstly, fractal analysis of the entire binary WM mask24, which is directly obtained from a T1-weighted structural Magnetic Resonance Imaging (MRI) scan. Secondly, the fractal dimension is obtained from a skeletonized version of a T1-weighted white matter mask25. However, due to limitations in spatial resolution, caused by MRI basic conditions such as signal strength and scan time, both methods are only rough approximations to investigate the underlying complex structure of nerve fiber bundles. The most accurate macroscopic geometrical representation of the neural structure of the brain, by means of MRI, is provided by diffusion tensor imaging (DTI) based fiber tracking26 and its further developments. These methods allow for the visualization of neural fiber tracts based on a direction-sensitive MR measurement of the diffusion of free water. The sum of all fiber tracts represented by lines in a three dimensional space and color-coded according to their orientation is usually referred to as tractogram. Fractal properties of MR tractograms have been firstly investigated by Katsaloulis et al.27,28. However, studies including large cohorts of subjects or patients with neurological pathologies are missing. One reason might be that the diffusion tensor model, which is widely used for tractography, is not able to resolve complex fiber configurations such as crossing or kissing fibers. Then, fractal analysis describes space-filling properties without capturing the full geometrical complexity and group differences may remain unrevealed. New developments in diffusion data analysis account for complex fiber orientations and provide tractograms with higher accuracy, more suitable for fractal analysis (Fig. 1). Methods like q-ball imaging29, diffusion spectrum imaging30, or constrained spherical deconvolution (CSD)31 have been developed for this purpose but require a large number of diffusion sensitizing gradient directions (60 and more) making the MR measurement challenging with respect to scan time and signal-to-noise ratio. However, analyzing tractograms inherit a profound advantage over analyzing image data. While images are limited in resolution due to the sampled imaging matrix, tractograms are defined by points in space, referred to as fulcrums, that allows for a discretization with arbitrary resolution. Given that, for reliable estimates of FD, a structure to be analyzed with fractal analysis should obey scaling rules over several scales32, tractograms might be ideal candidates for fractal analysis of cerebral white matter.
Figure 1.
Comparison of fiber tracts based on DTI (left) and based on CSD (right). The images demonstrate the more realistic presentation of white matter tracts when crossing fiber configurations are taken into account. Tensor based tractography my lead to an unnatural fiber density (marked with white arrows). The more natural representation of cerebral white matter, obtained with CSD, served as input for fractal analysis.
There are several ways to calculate FD for a natural structure or for an image. All of these are approximations of the Hausdorff Dimension33, a single value, characterizing the geometrical complexity of a structure. The most prominent method that is often used due to its simplicity and computational efficiency is called the Box-counting method34 providing a value of FD called the Box-counting dimension35. However, fractal systems in nature are often insufficiently described by such a single value because self-similarity only exists in a limited number of magnitudes. Hence, a continuous spectrum of fractal dimensions instead of a single fractal dimension may provide a better geometrical description of natural complex structures such as tractograms. This characteristic, usually denoted as multifractality36, is considered when evaluating generalized fractal dimensions or Renyi dimensions.
In this proof of concept, we investigated, if FD captures age-related structural changes in white matter by analyzing tractograms obtained from CSD. Changes of FD values, obtained by multifractal analysis (MFA), are compared to changes of FA values and their age dependence is discussed. We demonstrate that fractal dimension is able to capture age related changes in white matter structure by analyzing 85 healthy subjects between eighteen and eighty-one years. We hypothesized that age dependent changes are more accurately modeled using the FD approach analyzing tractograms obtained from CSD compared to FA analysis based on the diffusion tensor model.
Results
Evaluation of the multifractal spectrum
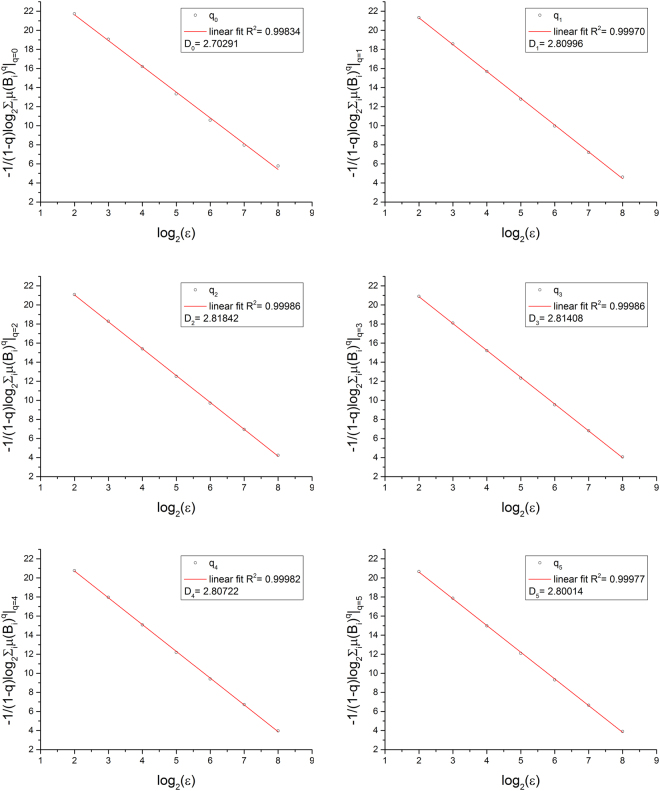
The generalized fractal dimensions Dq were evaluated as the slopes in the double-logarithmic plots against for q = [0…10] (q = 0 … 5 shown in Fig. 2). The quality of the fit was indicated by the root mean square error (RMSE). RMSE felled from D0 (mean RMSE: 0.14 ± 0.02) until D2 (mean RMSE: 0.054 ± 0.006) and rose with increasing q, given the highest RMSE at D10 (mean RMSE: 0.7 ± 0.1) (Fig. 3). For all subjects, D2 showed the best linear relation, indicated by the minimum RMSE, and was therefore the preferred fractal estimator. Values of the generalized fractal dimensions Dq showed their highest values for D2 (mean D2: 2.811 ± 0.009). D0 and D1 were lower than D2 and for q > 2 the fractal dimension decreased monotonically. This is not in agreement with Eq. [4] because multifractal properties of the fractal spectrum are only given for generalized fractal dimensions Dq with q > 2. This observation was consistent for all subjects (Fig. 4).
Figure 2.
The absolute value of the slope in the double-logarithmic plot provides the fractal dimensions for the generalized dimensions or Renyi dimensions in the range q = [0 … 5]. The highest R2 was found for q = 2, indicating that the correlation dimension D2 is the best fractal estimator (highlighted by the green frame). Data are shown for one arbitrary chosen subject.
Figure 3.
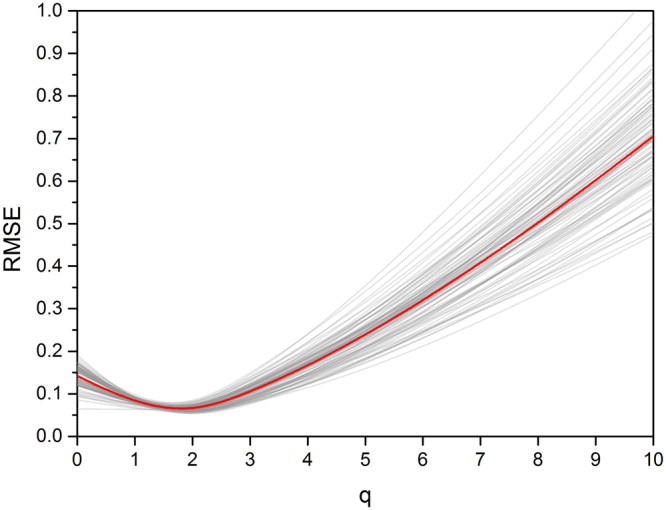
RMSE of the linear fit in the double-logarithmic plot. A minimum for RMSE was detected at q = 2 for all subjects. This demonstrates the stability of D2 as the superior FD estimator for all subjects. The red line indicates the mean value.
Figure 4.
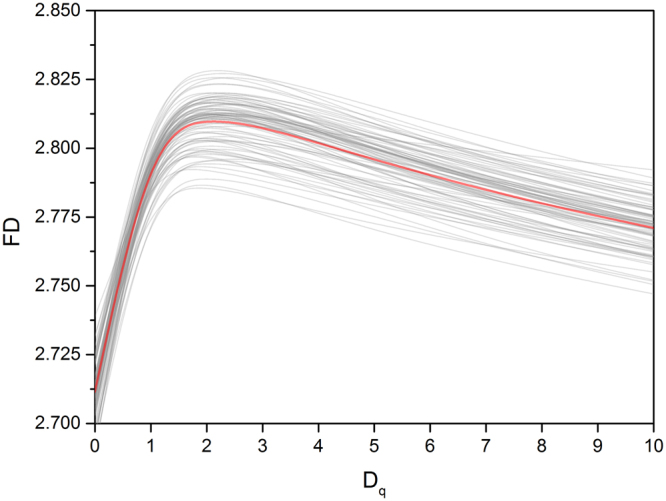
Generalized fractal dimensions in the range q = [0 … 10]. The fractal dimension shows a maximum for D2 with a monotonic decrease for Dq with q > 2. Please note that for ideal or geometric fractals Dq decreases for q ≥ 0. The red line indicates the mean value.
Age dependence of fractal dimension
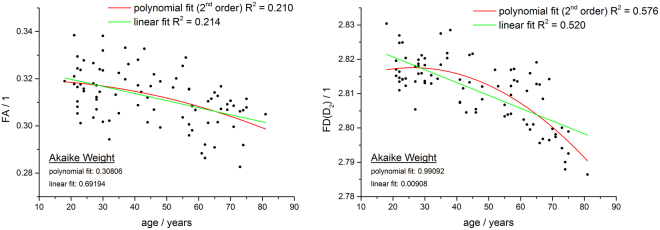
A correlation analysis between the generalized fractal dimensions (Dq: q = [0…10] with age identified the highest correlation for D2, the correlation dimension (Table 1). The box-counting dimension did not correlate with age (p < 0.71). Both parameters, FD (D2) and FA, were reduced with increasing age (Fig. 5). Since the existence of non-linear age-related effects is well documented21,37,38, linear regression and additional polynomial regression was employed to describe the effect of age on FA and FD. In both cases, R2 was higher for FD than for FA (linear fit FD: R2 = 0.520, linear fit FA: R2 = 0.214; polynomial fit FD: R2 = 0.576, polynomial fit FA: R2 = 0.210). The Akaike Information Criterion (AIC) identified the polynomial fit as the preferred model for FD and the linear model for FA. The Akaike weights (AW) can be interpreted as the probability for a specific model fit and was evaluated as follows: FD: linear fit AW = 0.00908, polynomial fit AW = 0.99092; FA: linear fit AW = 0.69194, polynomial fit AW = 0.30806. This means that for FD the polynomial fit was about 109 times more likely to be correct than the linear fit and for FA the linear model was about 2 times more likely to be correct than the polynomial fit.
Table 1.
Correlation between age and the generalized fractal dimensions (Dq: q = [0…10]). Regression parameters and ANOVA results are presented for the polynomial fit of 2nd order. n=85, p < 0.05. The correlation dimension D2 shows the best correlation with age.
| D | Residual Sum of Squares | Adj. R-Square | ANOVA | ||
|---|---|---|---|---|---|
| Sum of Squares | F Value | Prob > F | |||
| D 0 | 0.00823 | −0.016 | 6.90595E-5 | 0.34 | 0.71 |
| D 1 | 0.00231 | 0.518 | 0.00261 | 46.19 | 3.66E-14 |
| D 2 | 0.00313 | 0.576 | 0.00442 | 57.98 | 2.22E-16 |
| D 3 | 0.00365 | 0.541 | 0.00451 | 50.59 | 4.88E-15 |
| D 4 | 0.00402 | 0.482 | 0.00393 | 40.11 | 7.12E-13 |
| D 5 | 0.00433 | 0.417 | 0.00328 | 31.08 | 8.96E-11 |
| D 6 | 0.00462 | 0.355 | 0.00272 | 24.12 | 5.78E-9 |
| D 7 | 0.00490 | 0.298 | 0.00226 | 18.87 | 1.81E-7 |
| D 8 | 0.00519 | 0.249 | 0.00189 | 14.93 | 2.95E-6 |
| D 9 | 0.00547 | 0.207 | 0.0016 | 11.98 | 2.73E-5 |
| D 10 | 0.00576 | 0.172 | 0.00137 | 9.76 | 1.573E-4 |
Figure 5.
Correlation between FA and FD with age. Both parameters FA and FD show a negative correlation with subject’s age. While Akaike information criterion suggests a linear model (green line) for FA-age correlation, for FD the polynomial fit of 2nd order (red line) is more probable. The negative correlation of D2 with age is better compared to FA-age correlation.
Influence of sex, brain volume and mean fiber length
Both, FD (D2) and FA did not significantly differ between male and female subjects (D2: p < 0.84, FA: p < 0.19). To ensure that the age dependence of fractal dimension was not biased by brain volume changes due to normal aging processes, a regression analysis was performed. Given that female and male white matter volume significantly (p < 4.3·10-8) differed in volume (female: 501.9 ml ± 45.1 ml, male: 563.2 ml ± 47.2 ml), the regression analysis was performed separately for female and for male subjects. At the p = 0.05 level, the slopes were not significantly different from zero for both, female subjects (p < 0.98) and male subjects (p < 0.66) indicating that no correlation between white matter volume and age was observed in our data. Furthermore, we investigated if there was an age dependent change in mean fiber length that might influence the age dependence of the fractal dimensions. Female and male subjects were significantly different in mean fiber length at the p = 0.05 level (female: 66.8 mm ± 3.1 mm, male: 68.2 mm ± 2.9 mm) hence regression analysis was performed separately for female and male subjects. At the p = 0.05 level, the slopes were not significantly different from zero for female subjects (p < 0.1) and for male subjects (p < 0.65) supporting the view that no correlation between mean fiber length and age was observed in our data.
Our main results can be summarized as follows
The correlation dimension D2 is the preferred fractal dimension for analyzing tractograms.
For the multifractal spectrum Dq, D2 correlates best with age.
Box-counting dimension D0 does not correlate with age.
A polynomial model of 2nd order describes better the correlation of D2 with age than a linear model.
The correlation of D2 with age is better than the correlation of FA with age
White matter brain volume and mean fiber length do not significantly correlate with age in our data.
Discussion
For the first time, fractal analysis of tractograms described structural changes in human cerebral white matter due to healthy aging. The observed correlation of FD, specifically the correlation dimension D2, with age was much stronger compared to the correlation of FA with age. This can be explained by the fact that our FD calculation relied on much richer information than FA calculation. Firstly, FA is evaluated from the eigenvalues of the diffusion tensor which neglect the fiber orientation and only account for restricted diffusion strength. Secondly, FA is based on a tensor model that does not consider complex fiber configurations such as crossing or kissing fibers. Given that most regions of the brain contain such complex structures39,40, higher angular resolution tracking methods such as CSD31,40 provide a more reliable representation of the fiber nerves and are therefore more suitable to investigate structural changes. Other studies that used fractal analysis to investigate age-related white matter changes relied on the analysis of white matter shape7,24,41. Based on T1-weighted MR images with a typical matrix size of 256 × 256, the white matter was segmented and analyzed utilizing the box-counting dimension. We learned from these studies, that the white matter shape tends to reduce its complexity with increasing age, indicated by a decrease of FD. However, the shape of a white matter mask provides limited information about the entire white matter because the inner structure remains hidden. A much more comprehensive representation was given by the tractograms that were used in our study. Another benefit of analyzing tractograms is that image resolution is not a limiting factor for fractal analysis. It is well known that a fractal structure should obey scaling rules over several scales32. The assumption of this precondition is often violated due to small image matrixes. A tractogram consists of curves that are defined by fulcrums in a three dimensional space and with increasing number of curves the evaluated tractograms becomes denser. Such an object can be discretized with arbitrary high resolution and is independent of the matrix size of underlying DWI scan. With this, it was assured that image resolution was high enough for fractal analysis. In medical imaging, a similar technique is usually referred to as super-resolution track density imaging42–44.
Interestingly, the most frequently used measurement of FD, the box-counting dimension or capacity dimension D0 did not show any significant age dependence when applied on tractograms. The reason is that D0 is not sensitive to the density of points or more specifically to changes in density of points (see Eq. 3). The number of non-empty boxes is counted, regardless of the number of points within a box. If a structure is dense enough, even a small box may always contain a point and changes cannot be captured. Age dependence of FD was therefor only observable for Dq, with q > 0 where the point density was taken into account. The best correlation of FD with age was found for D2. This is interesting in the light that for D2, estimated through the double logarithmic plot for q = 2, RMSE was smallest. So, for all subjects D2 gave the best estimate for FD. The highest value of FD was consistently found for D2 with absolute values close around 2.8 which is in line with previous obserevations27. This is not in line with observations for ideal or geometric fractals where the multifractal spectrum Dq versus q is a monotonic decreasing curve. However, in case of stochastic or finite fractals, anomalous multifractal spectra have been reported for aggregated particles45, for bit strings46, for boundaries of neuronal cells47 and for some mathematical fractals represented in digital images32. The origin of such curve shapes has not been investigated sufficiently and still is subject of scientific debate, but it is conceivable that scaling rules are only valid for specific ranges of the multifractal spectrum.
The method proposed in this proof-of-concept describes the geometric complexity of neural fiber tracts with a single parameter. The observed trend of decreasing FD with age was also found for FA and is congruent with other studies16. Although it is fascinating that a single value is definitely linked with structural changes in the brain, a closer look on specific regions might be in the scientific focus. Spatially resolved FA maps revealed that structural changes due to normal aging are not uniformly distributed16,19. However, spatially resolved evaluation of FD is possible, following the idea described in48. The challenge of extending our approach from a single value to a three dimensional spatially resolved FD map is less a question of feasibility than a question of computational efficiency.
Conclusion
MRI based tractography of the brain is the most promising imaging technique for revealing cerebral white matter architecture. Changes in the structural complexity can reliably be measured with fractal analysis. Specifically the correlation dimension D2 is a reliable measurement to capture structural changes which was demonstrated for a large cohort of normal aging subjects. The sensitivity to structural changes due to aging is higher compared to changes in fractional anisotropy suggesting that fractal dimension might be a valuable biomarker for detecting structural changes in the brain. This is of exceptional interest for studying structural changes in healthy subjects as well as for pathologies provoking white matter changes.
Methods
Participants
All of the 85 participants (34 male between 21 and 74 years, 51 female between 18 and 81 years) had no history of chronic psychiatric or neurological diseases, brain or heart surgery. The Mini-Mental State Examination49 and the General Depression-scale (in German)50 ensured that all participants over 60 years were free from dementia and depression. Participant’s written informed consent was obtained according to the Declaration of Helsinki and the study was approved by the ethics committee of the Medical University of Graz.
MRI data acquisition
Imaging data was acquired on a 3 T Siemens Skyra (Siemens Healtheneers, Erlangen, Germany) using a 32-channel head coil. Foam pads were used for the fixation of participants’ head during data acquisition. For diffusion weighted images, 50 transversal slices, oriented parallel to the AC-PC plane, were measured using a single-shot echo planar imaging sequence (TR = 6600 ms, TE = 95 ms, flip angle 90°, FoV = 240 mm, matrix size = 122 × 122 mm, 2 mm thickness, slice gap = 0.5 mm, GRAPPA acceleration factor = 2). One non-diffusion weighted image (b value = 0 s/mm²) and 64 diffusion sensitizing gradient directions were applied (b value = 1000 s/mm²). Additionally, structural images were obtained using a MPRAGE sequence (TR = 2530, TE = 2.07, TI = 900 ms, flip angle = 9°, Number of slices = 176, slice thickness = 1 mm, matrix = 256 × 256). Total scanning time was 13 minutes 33 seconds.
MRI data processing
Diffusion data were analyzed using the FSL Software Library (v. 5.0.1) from the Oxford Centre for Functional MRI of the Brain (FMRIB), in a standard multi-step procedure including: (a) correction for eddy-currents and head-motion artefacts (b) removal of non-brain tissue based on the b = 0 images for every participant, using the Brain Extraction Tool (BET) (c) voxel-wise fitting of diffusion tensors and computation of fractional anisotropy (FA), using DTIfit. All of these steps are part of the FMRIB Diffusion Toolbox (FDT). For each subject, the T1-weighted image was registered to the b0-image using a rigid body transformation, implemented in SPM12 (vers. 6685). After binarization, the T1-image was segmented into gray matter, white matter and cerebrospinal fluid using SPM12 in native space (tissue types = 6, sampling distance = 3, segmented image voxel size = 1 × 1 × 1), resulting in individual white matter masks. These masks were applied to the FA-images in native space. The mean-FA value for the entire white matter was evaluated.
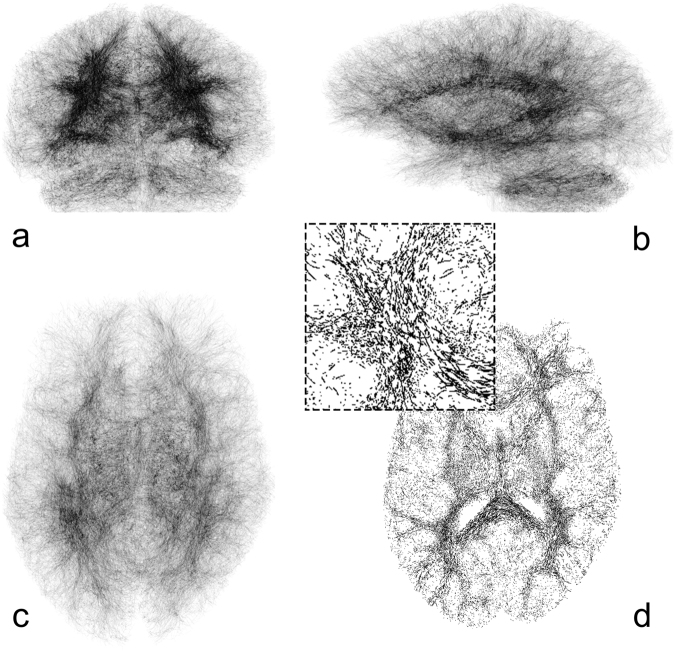
Tractography was performed using CSD, implemented in the MRTRIX 3.0 software package. The CSD method allows for estimating the fiber orientation distribution function (fODF) directly from the diffusion signal. We estimated the fODF based on an eighth-order harmonic function. A total number of 105 tracks were kept constant for all data. The tracks, given though fulcrums in a three dimensional space, were discretized on a 1024 × 1024 × 1024 grid and displayed as binary image (Fig. 6). This approach is comparable to a binary version of super-resolution track-density mapping42,43.
Figure 6.
Tractography discretized on a 1024 × 1024 × 1024 grid. Rendered visualization in coronal (a), sagittal (b), and transversal (c) view. 104 fibertracts were used for better visualization. Please note that 105 fibertracts were used for FD calculation. Image d shows one central transversal slice with magnified view. Images are inverted for better visualization.
Fractal Analysis
The fractal dimension (FD) is often introduced by the Hausdorff dimension, a mathematical definition of fractals that cannot be directly solved. An approximation is possible, using the concept of self-similarity. An object with (N) segments scales with a length (r) thereby formulating a power law:
| 1 |
hence,
| 2 |
where FD is the dimension of the scaling law. For non-fractal objects, FD equals the Euclidean dimension (D = 1, 2, 3, … n) that is one for a line, two for an area, and three for a volume. Fractal objects obey a metric scaling relation, where the exponent (the fractal dimension, FD) is not equal to the Euclidean dimension and is usually not an integer. In nature, a single exponent is often not enough to describe a complex structure and a spectrum of exponents is needed. The generalized dimensions or Rényi-dimensions Dq are defined according to:
| 3 |
where µ is the probability density of elements in the ith box Bi, with a side length of ε. For q = 0, D0 is usually referred to as the capacity dimension that equals the box-counting dimension in that µ is the probability that the ith Box Bi is populated. For q = 1, D1 is called the information dimension where the number of elements is counted for every Box Bi. For q = 2, D2 is called the correlation dimension. These dimensions are theoretically related by the inequality
| 4 |
For an exact monofractal, the evaluated dimensions with varying q should be equal. In contrast, multifractals show a monotonic decreasing behavior in their spectrum of dimensions according to Eq. [4]. All calculations of the fractal dimension were done in a three dimensional space by covering the high-resolution tractograms with cubes. The multifractal spectrum was carried out within the range q = [0, 10] using cube side lengths ε in the range of n = [2, 8] given ε = 2n (Fig. 7) This range, that was determined by simulations (data not presented here), has shown the best linear fit in the double logarithmic plot versus for all q. RMSE was evaluated for every q to reveal q showing the highest linearity. The highest linearity in the double logarithmic plot means that the data are closest to the power law (see Eq. 1) and hence, providing the best fractal description of the structure. Multifractal Analysis was implemented with MATLAB software (V 2015b, The MathWorks, Inc., MA, USA).
Figure 7.
Principle of evaluating the fractal dimension using the box counting method. For estimating the fractal dimension, a structure to be analyzed is covered with boxes Bi, with a side length of ε. The generalized dimensions are obtained for different q according to Eq. [3].
Statistical Analysis
Linear models and polynomial models of 2nd order were used to test for correlation between FD (D2) and FA with age. This allows a direct comparison of age-dependent changes of both, FD and FA. The Akaike Information Criterion was applied to select the most probable model. Evaluated Akaike Weights within the range [0, 1] provide the probability of the model. Gender differences were statistically tested with regards to the parameters age, FD (D2), FA, white matter brain volume, mean fiber length using an unpaired, two-tailed t-test. All statistical analyses were carried out using Origin Pro 9.0 (Northhampton, MA, USA)
Data availability
All data are available from the corresponding author upon reasonable request.
Ethical statement
All methods and experiments were performed in accordance with relevant national and international guidelines and regulations and were approved by the local ethics committee. All subjects gave written informed consent to participate in this study.
Author Contributions
G.R. and K.K conceived the study. K.K. and G.W. were responsible for data acquisition. F.S., G.R. and H.A. programmed scientific computer software. G.R., F.S. and K.K. performed computational analysis. H.A., H.D. and G.W. provided scientific support and general study guidance. G.R. and G.W. performed statistical analysis. G.R. prepared the display items. G.R., H.D. and G.W. provided project supervision.
Competing Interests
The authors declare no competing interests.
Footnotes
Publisher's note: Springer Nature remains neutral with regard to jurisdictional claims in published maps and institutional affiliations.
References
- 1.Mandelbrot B. How long is the coast of britain? Statistical self-similarity and fractional dimension. Science. 1967;156:636–638. doi: 10.1126/science.156.3775.636. [DOI] [PubMed] [Google Scholar]
- 2.Zaia A, Maponi P, Di Stefano G, Casoli T. Biocomplexity and Fractality in the Search of Biomarkers of Aging and Pathology: Focus on Mitochondrial DNA and Alzheimer’s Disease. Aging Dis. 2017;8:44–56. doi: 10.14336/AD.2016.0629. [DOI] [PMC free article] [PubMed] [Google Scholar]
- 3.Ahammer H, Kroepfl JM, Hackl C, Sedivy R. Fractal dimension and image statistics of anal intraepithelial neoplasia. Chaos Solitons & Fractals. 2011;44:86–92. doi: 10.1016/j.chaos.2010.12.004. [DOI] [Google Scholar]
- 4.Di Ieva, A. et al. Computer-assisted and fractal-based morphometric assessment of microvascularity in histological specimens of gliomas. Sci Rep-Uk2 (2012). [DOI] [PMC free article] [PubMed]
- 5.Di Ieva A, Grizzi F, Sherif C, Matula C, Tschabitscher M. Angioarchitectural heterogeneity in human glioblastoma multiforme: A fractal-based histopathological assessment. Microvascular Research. 2011;81:222–230. doi: 10.1016/j.mvr.2010.12.006. [DOI] [PubMed] [Google Scholar]
- 6.Kiselev VG, Hahn KR, Auer DP. Is the brain cortex a fractal? Neuroimage. 2003;20:1765–1774. doi: 10.1016/S1053-8119(03)00380-X. [DOI] [PubMed] [Google Scholar]
- 7.Farahibozorg S, Hashemi-Golpayegani SM, Ashburner J. Age- and Sex-Related Variations in the Brain White Matter Fractal Dimension Throughout Adulthood: An MRI Study. Clin Neuroradiol. 2015;25:19–32. doi: 10.1007/s00062-013-0273-3. [DOI] [PMC free article] [PubMed] [Google Scholar]
- 8.Reishofer G, Koschutnig K, Enzinger C, Ebner F, Ahammer H. Fractal dimension and vessel complexity in patients with cerebral arteriovenous malformations. Plos One. 2012;7:e41148. doi: 10.1371/journal.pone.0041148. [DOI] [PMC free article] [PubMed] [Google Scholar]
- 9.Gallos LK, Makse HA, Sigman M. A small world of weak ties provides optimal global integration of self-similar modules in functional brain networks. P Natl Acad Sci USA. 2012;109:2825–2830. doi: 10.1073/pnas.1106612109. [DOI] [PMC free article] [PubMed] [Google Scholar]
- 10.Gallos, L. K., Sigman, M. & Makse, H. A. The conundrum of functional brain networks: small-world efficiency or fractal modularity. Front Physiol3, (2012). [DOI] [PMC free article] [PubMed]
- 11.Esteban FJ, et al. Fractal dimension and white matter changes in multiple sclerosis. Neuroimage. 2007;36:543–549. doi: 10.1016/j.neuroimage.2007.03.057. [DOI] [PubMed] [Google Scholar]
- 12.Esteban FJ, et al. Fractal dimension analysis of grey matter in multiple sclerosis. Journal of the Neurological Sciences. 2009;282:67–71. doi: 10.1016/j.jns.2008.12.023. [DOI] [PubMed] [Google Scholar]
- 13.King RD, et al. Fractal dimension analysis of the cortical ribbon in mild Alzheimer’s disease. Neuroimage. 2010;53:471–479. doi: 10.1016/j.neuroimage.2010.06.050. [DOI] [PMC free article] [PubMed] [Google Scholar]
- 14.Raz N, Rodrigue KM. Differential aging of the brain: Patterns, cognitive correlates and modifiers. Neurosci Biobehav R. 2006;30:730–748. doi: 10.1016/j.neubiorev.2006.07.001. [DOI] [PMC free article] [PubMed] [Google Scholar]
- 15.Madan CR, Kensinger EA. Cortical complexity as a measure of age-related brain atrophy. Neuroimage. 2016;134:617–629. doi: 10.1016/j.neuroimage.2016.04.029. [DOI] [PMC free article] [PubMed] [Google Scholar]
- 16.Xie, S. et al. Subcortical White Matter Changes with Normal Aging Detected by Multi-Shot High Resolution Diffusion Tensor Imaging. Plos One11, (2016). [DOI] [PMC free article] [PubMed]
- 17.Madan CR, Kensinger EA. Age-related differences in the structural complexity of subcortical and ventricular structures. Neurobiol Aging. 2017;50:87–95. doi: 10.1016/j.neurobiolaging.2016.10.023. [DOI] [PMC free article] [PubMed] [Google Scholar]
- 18.de Groot M, et al. White Matter Degeneration with Aging: Longitudinal Diffusion MR Imaging Analysis. Radiology. 2016;279:532–541. doi: 10.1148/radiol.2015150103. [DOI] [PubMed] [Google Scholar]
- 19.Salat DH, et al. Age-related alterations in white matter microstructure measured by diffusion tensor imaging. Neurobiology of Aging. 2005;26:1215–1227. doi: 10.1016/j.neurobiolaging.2004.09.017. [DOI] [PubMed] [Google Scholar]
- 20.Nusbaum AO, Tang CY, Buchsbaum MS, Wei TC, Atlas SW. Regional and global changes in cerebral diffusion with normal aging. American Journal of Neuroradiology. 2001;22:136–142. [PMC free article] [PubMed] [Google Scholar]
- 21.Morozova M, Koschutnig K, Klein E, Wood G. Monotonic non-linear transformations as a tool to investigate age-related effects on brain white matter integrity: A Box-Cox investigation. Neuroimage. 2016;125:1119–1130. doi: 10.1016/j.neuroimage.2015.08.003. [DOI] [PubMed] [Google Scholar]
- 22.Pfefferbaum A, et al. Age-related decline in brain white matter anisotropy measured with spatially corrected echo-planar diffusion tensor imaging. Magnetic Resonance in Medicine. 2000;44:259–268. doi: 10.1002/1522-2594(200008)44:2<259::AID-MRM13>3.0.CO;2-6. [DOI] [PubMed] [Google Scholar]
- 23.Demnitz N, et al. Associations between Mobility, Cognition, and Brain Structure in Healthy Older Adults. Frontiers in aging neuroscience. 2017;9:155. doi: 10.3389/fnagi.2017.00155. [DOI] [PMC free article] [PubMed] [Google Scholar]
- 24.Mustafa N, et al. Brain structural complexity and life course cognitive change. Neuroimage. 2012;61:694–701. doi: 10.1016/j.neuroimage.2012.03.088. [DOI] [PubMed] [Google Scholar]
- 25.Rajagopalan, V. et al. Brain White Matter Shape Changes in Amyotrophic Lateral Sclerosis (ALS): A Fractal Dimension Study. Plos One8, (2013). [DOI] [PMC free article] [PubMed]
- 26.Tournier JD, Mori S, Leemans A. Diffusion Tensor Imaging and Beyond. Magnet Reson Med. 2011;65:1532–1556. doi: 10.1002/mrm.22924. [DOI] [PMC free article] [PubMed] [Google Scholar]
- 27.Katsaloulis, P., Ghosh, A., Philippe, A. C., Provata, A. & Deriche, R. Fractality in the neuron axonal topography of the human brain based on 3-D diffusion MRI. Eur Phys J B85, (2012).
- 28.Katsaloulis P, Verganelakis DA, Provata A. Fractal Dimension and Lacunarity of Tractography Images of the HumanBrain. Fractals-Complex Geometry Patterns and Scaling in Nature and Society. 2009;17:181–189. [Google Scholar]
- 29.Tuch DS. Q-Ball imaging. Magnetic Resonance in Medicine. 2004;52:1358–1372. doi: 10.1002/mrm.20279. [DOI] [PubMed] [Google Scholar]
- 30.Wedeen VJ, et al. Diffusion spectrum magnetic resonance imaging (DSI) tractography of crossing fibers. Neuroimage. 2008;41:1267–1277. doi: 10.1016/j.neuroimage.2008.03.036. [DOI] [PubMed] [Google Scholar]
- 31.Tournier JD, Calamante F, Connelly A. Robust determination of the fibre orientation distribution in diffusion MRI: Non-negativity constrained super-resolved spherical deconvolution. Neuroimage. 2007;35:1459–1472. doi: 10.1016/j.neuroimage.2007.02.016. [DOI] [PubMed] [Google Scholar]
- 32.Ahammer H, DeVaney TT, Tritthart HA. How much resolution is enough? Influence of downscaling the pixel resolution of digital images on the generalized dimensions. Physica D. 2003;181:147–156. doi: 10.1016/S0167-2789(03)00099-X. [DOI] [Google Scholar]
- 33.Falconer, K. Fractal Geometry: Mathematical Foundations and Applications. 2 edn, (Wiley, 2003).
- 34.Meisel LV, Johnson M, Cote PJ. Box-counting multifractal analysis. Phys Rev A. 1992;45:6989–6996. doi: 10.1103/PhysRevA.45.6989. [DOI] [PubMed] [Google Scholar]
- 35.Theiler J. Estimating fractal dimension. Journal of the Optical Society of America a-Optics Image Science and Vision. 1990;7:1055–1073. doi: 10.1364/JOSAA.7.001055. [DOI] [Google Scholar]
- 36.Vicsek T, Family F, Meakin P. Multifractal Geometry of Diffusion-Limited-Aggregates. Europhysics Letters. 1990;12:217–222. doi: 10.1209/0295-5075/12/3/005. [DOI] [Google Scholar]
- 37.Pfefferbaum A, et al. Variation in longitudinal trajectories of regional brain volumes of healthy men and women (ages 10 to 85 years) measured with atlas-based parcellation of MRI. Neuroimage. 2013;65:176–193. doi: 10.1016/j.neuroimage.2012.10.008. [DOI] [PMC free article] [PubMed] [Google Scholar]
- 38.Westlye LT, et al. Life-Span Changes of the Human Brain White Matter: Diffusion Tensor Imaging (DTI) and Volumetry. Cerebral Cortex. 2010;20:2055–2068. doi: 10.1093/cercor/bhp280. [DOI] [PubMed] [Google Scholar]
- 39.Jeurissen B, Leemans A, Tournier JD, Jones DK, Sijbers J. Investigating the Prevalence of Complex Fiber Configurations in White Matter Tissue with Diffusion Magnetic Resonance Imaging. Human Brain Mapping. 2013;34:2747–2766. doi: 10.1002/hbm.22099. [DOI] [PMC free article] [PubMed] [Google Scholar]
- 40.Tournier JD, et al. Resolving crossing fibres using constrained spherical deconvolution: Validation using diffusion-weighted imaging phantom data. Neuroimage. 2008;42:617–625. doi: 10.1016/j.neuroimage.2008.05.002. [DOI] [PubMed] [Google Scholar]
- 41.Sandu AL, et al. Structural brain complexity and cognitive decline in late life - A longitudinal study in the Aberdeen 1936 Birth Cohort. Neuroimage. 2014;100:558–563. doi: 10.1016/j.neuroimage.2014.06.054. [DOI] [PubMed] [Google Scholar]
- 42.Calamante F, et al. Track density imaging (TDI): Validation of super resolution property. Neuroimage. 2011;56:1259–1266. doi: 10.1016/j.neuroimage.2011.02.059. [DOI] [PubMed] [Google Scholar]
- 43.Calamante F, Tournier JD, Jackson GD, Connelly A. Track-density imaging (TDI): Super-resolution white matter imaging using whole-brain track-density mapping. Neuroimage. 2010;53:1233–1243. doi: 10.1016/j.neuroimage.2010.07.024. [DOI] [PubMed] [Google Scholar]
- 44.Calamante F, et al. Super-resolution track-density imaging studies of mouse brain: Comparison to histology. Neuroimage. 2012;59:286–296. doi: 10.1016/j.neuroimage.2011.07.014. [DOI] [PubMed] [Google Scholar]
- 45.anOpheusden JHJ, Bos MTA. & vanderKaaden, G. Anomalous multifractal spectrum of aggregating Lennard-Jones particles with Brownian dynamics. Physica A. 1996;227:183–196. doi: 10.1016/0378-4371(95)00413-0. [DOI] [Google Scholar]
- 46.van Opheusden JHJ. The origin of an increasing or decreasing multifractal spectrum. Physica a-Statistical Mechanics and Its Applications. 1998;252:10–22. doi: 10.1016/S0378-4371(97)00626-2. [DOI] [Google Scholar]
- 47.Nonnenmacher, T. F., Losa, G. A. & Weibel, E. R. Fractals in biology and medicine. (Birkhäuser Verlag, 1994).
- 48.Landini G, Murray PI, Misson GP. Local connected fractal dimensions and lacunarity analyses of 60 degrees fluorescein angiograms. Invest Ophthalmol Vis Sci. 1995;36:2749–2755. [PubMed] [Google Scholar]
- 49.Folstein MF, Folstein SE, McHugh PR. “Mini-mental state”. A practical method for grading the cognitive state of patients for the clinician. Journal of psychiatric research. 1975;12:189–198. doi: 10.1016/0022-3956(75)90026-6. [DOI] [PubMed] [Google Scholar]
- 50.Hautzinger, M., Bailer, M., Hofmeister, D. & Keller, F. Allgemeine Depressionsskala (ADS). Manual (2., überarbeitete und neu normierte Auflage). (Hogrefe, 2012).
Associated Data
This section collects any data citations, data availability statements, or supplementary materials included in this article.
Data Availability Statement
All data are available from the corresponding author upon reasonable request.


