Abstract
Oral squamous cell carcinoma (OSCC) remains to be a challenging public health problem worldwide. However, the underlying molecular mechanism regulating the carcinogenesis of OSCC is poorly known. Gene expression profiles of GSE13601, GSE30784, GSE37991 and The Cancer Genome Atlas (TCGA) head and neck cancer were downloaded from gene expression omnibus (GEO) and TCGA database respectively. R software and bioconductor packages were used to compare and identify the differentially expressed genes (DEGs) between OSCC tissues and normal controls. The common DEGs were then subjected to gene ontology (GO) enrichment analysis, ingenuity pathway analysis (IPA), protein-protein interaction (PPI) network analysis as well as survival analysis. A total of 76 up- and 102 down-regulated DEGs were identified. Functional analysis revealed that these DEGs were associates with increased oncostatin M signaling, cell diapedesis and extravasation as well as reduced calcium signaling and loss of adherens junctions and tight junctions. A set of robust prognostic signatures including PLAU, CLDN8 and CDKN2A were identified from DEGs and could predict overall survival in OSCC patients from TCGA cohort. This three-gene signature was further successfully validated as a prognostic marker for overall survival prediction in another independent cohort GSE41613. In conclusion, our study has identified a registry of novel genes and pathways that play important roles in regulating the initiation and development of OSCC. A set of robust molecular signature is identified for prognostic prediction, which will provide useful guidance for therapeutic applications.
Keywords: Gene ontology, ingenuity pathway analysis, oral squamous cell carcinoma, protein-protein interactions network, survival analysis
Introduction
Oral squamous cell carcinoma (OSCC) represents up to 90% of all malignancies of oral cavity [1,2]. The initiation and development of OSCC is caused by a combination of genetic alterations, environmental risk factors and viral infection. Despite the magnificent achievements in surgery, radiation therapy and chemotherapy in the past few decades, the 5-year overall survival rate for OSCC remains little changed at approximately 50% [3]. Most patients with OSCC have poor prognosis due to advanced clinical stage at the time of diagnosis. This highlights the importance of studying the underlying molecular events accounting for the carcinogenesis of OSCC. Also, accuracy of predicting survival of OSCC is critical for good decision making by clinicians. However, currently it remains to be a challenging task, and thus identification of novel biomarkers for predicting OSCC prognosis is extremely urgent.
The Gene Expression Omnibus (GEO, http://www.ncbi.nlm.nih.gov/geo/) is an international public repository that archives and freely distributes microarray, next-generation sequencing, and other forms of high-throughput functional genomic data sets [4,5]. The Cancer Genome Atlas (TCGA) is a large-scale cancer genome project which provides researchers with multi-dimensional maps of the key genomic changes and clinicopathological information in 33 types of cancer (http://cancergenome.nih.gov/) [6]. Both GEO and TCGA have significantly increased our understanding of cancer. One obvious advantage of GEO and TCGA is that the data from different independent studies can be integrated to obtain a greater number of clinical samples for achieving a more robust analysis. However, the data from independent microarray studies are often inconsistent due to sample heterogeneity or different microarray platforms. Fortunately, efficient integrated bioinformatic methods have been developed for large-scale analysis of cross-platform high-throughput data.
In this study, we first identified the common differentially expressed genes (DEGs) from multiple microarrays and TCGA HNSC RNA-seq data. Gene ontology (GO) function and pathway enrichment analysis as well as protein-protein interactions (PPI) network analysis of DEGs were performed. Then a set of prognostic gene signature selected from DEGs was identified based on TCGA HNSC RNA-seq data and demonstrated good performance for predicting 5-year overall survival. This robust prognostic signature was successfully validated in another independent cohort of patients.
Materials and methods
Data source
The original datasets comparing the gene expression profiles between OSCC and normal controls were downloaded from NCBI GEO databases. The accession number was GSE13601, GSE30784 and GSE37991 respectively. The microarray data of GSE13601 and GSE30784 were based on GPL8300 (Affymetrix Human Genome U95 Version 2 Array, Affymetrix Inc., Santa Clara, CA, USA) and GPL570 (Affymetrix Human Genome U133 Plus 2.0 Array) respectively. The microarray data of GSE37991 was based on GPL6883 (Illumina HumanRef-8 v3.0 expression beadchip, Illumina Inc, San Diego, CA, USA).
The preprocessed level 3 RNA-seq data and corresponding clinical information of HNSC were downloaded from TCGA data portal. The clinical samples from oral cavity (alveolar ridge, buccal mucosa, floor of mouth, tongue, lip, oral cavity and hard palate) were selected, while samples from other anatomic sites such as hypopharynx, larynx, oropharynx and tonsil were excluded. A total of 329 OSCC patients with detailed follow-up time were included for subsequent analysis.
Data pre-processing and differential expression analysis
Robust multi-array average (RMA) approach was performed for background correction and normalization. The original GEO data were then converted into expression measures using affy R package. Limma R package was subsequently employed for identifying differentially expressed genes (DEGs). For TCGA data, edgeR package was used for DEG screening. P<0.05 and absolute log2FC>1 were chosen as the cut-off criteria based on Benjamini & Hochberg (BH) procedure. Intersect function in R was used for identifying the common DEGs among GSE13601, GSE30784, GSE37991 and TCGA. The Venn diagram was generated by VennDiagram R package.
Gene ontology enrichment analysis
Gene Ontology (GO) enrichment analysis was performed using the DAVID (the Database for Annotation, Visualization and Integration Discovery). The enriched biological processes (BP), cellular component (CC) and molecular function (MF) were obtained to analyze the common DEGs at the functional level. P<0.05 was set as the threshold value.
Ingenuity pathway analysis (IPA)
The common DEGs among GSE13601, GSE30784, GSE37991 and TCGA were first uploaded into Qiagen’s IPA system for core analysis. The ingenuity knowledge base (genes only) was selected as the reference set. IPA was performed to identify the canonical pathways associated with the common DEGs. P<0.01 was set as the threshold value.
PPI network construction
STRING online database (http://string-db.org) was used for analyzing the protein-protein interaction (PPI) of common DEGs and Cytoscape software (http://www.cytoscape.org/) was employed for visualizing PPI network of common DEGs. Cytoscape MCODE plug-in was used for searching clustered sub-networks. The default parameters were as follows: degree cutoff ≥2, node score cutoff ≥0.2, K-core ≥2, and max depth = 100.
Prognostic signatures generation and prediction
TCGA and GSE41613 served as training and validation cohorts respectively. The strategy of data mining and process of GSE41613 is the same as that used in GEO data analyzing mentioned above. Univariate Cox analysis was performed to assess the association between common DEGs and overall survival for TCGA data (training cohort) using survival analysis in R. A set of prognostic signatures (PLAU, CLDN8 and CDKN2A) was identified and hazard ratios (HRs) from univariate Cox regression analysis were used to identify protective (HR<1) and risky genes (HR>1). Multivariate Cox regression analysis was then applied to the three selected genes and the optimal model was obtained by akaike information criterion (AIC) method. A risk score was calculated based on the expression of gene and coefficient. Patients were stratified into a high-risk group and a low-risk group based on the cut-off value Kaplan-Meier analysis with log-rank test for difference between the survival curves of high-risk group and low-risk group was performed in GraphPad Prism (La Jolla, CA, USA). Heatmaps were generated in pheatmap R package with z-score normalization within each row (gene). All statistical tests were two-sided. A P value of less than .05 was considered statistically significant. Similarly, the above prognostic signatures were then applied to GSE41613 (validation cohort) to investigate whether they could effectively predict the prognosis of OSCC.
Results
The DEGs among GSE13601, GSE30784, GSE37991 and TCGA
Volcano plots were generated to visualize the distribution of expressed genes between cancer and normal controls from different studies. Red or green dots in the plots represented significantly upregulated or downregulated genes respectively (Figure 1A). Figure 1B showed the common DEGs among GSE13601, GSE30784, GSE37991 and TCGA. In total, 1270 (743 upregulated and 527 downregulated), 1583 (764 upregulated and 819 downregulated), 1850 (779 upregulated and 1071 downregulated) and 3273 (1309 upregulated and 1964 downregulated) significantly changed genes were identified from GSE13601, GSE30784, GSE37991 and TCGA respectively. The detailed information of the changed genes were summarized in Supplementary Materials. A total of 76 and 102 genes were significantly upregulated and downregulated in all four independent cohorts. The common up-regulated (log2FC>1, P<0.05) and downregulated (log2FC<-1, P<0.05) genes are listed in Tables 1 and 2 respectively.
Figure 1.
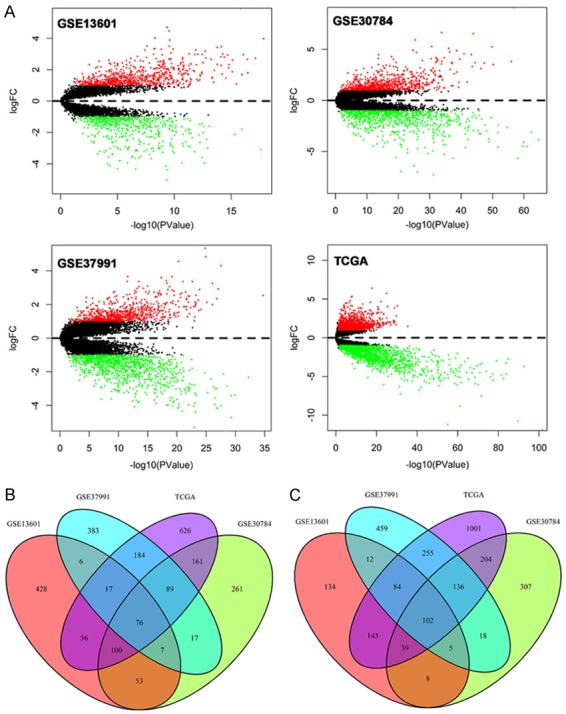
Volcano plots of genes that are significantly different between OSCC tissues and normal controls. X-axis indicates the p values (log-scaled), whereas the Y-axis shows the fold change (logscaled). Each symbol represents a different gene, and the red/green color of the symbols categorize the upregulated/downregulated genes falling under different criteria (p value and fold change threshold). p value <0.05 is considered as statistically significant, whereas fold change = 2 is set as the threshold (A). The common differentially expressed genes among GSE13601, GSE30784, GSE37991 and TCGA (B, C).
Table 1.
| Gene names (upregulated DEGs) |
|---|
| ABL2, ACP5, ADAM12, AIM2, APOBEC3B, ARPC1B, BNC1, BST2, CDH3, CDKN2A, COL11A1, COL4A1, COL4A2, COL4A6, COL7A1, CXCL9, CXCL10, CXCL11, CXCL13, CYP27B1, DKK1, FAP, FN1, FOXM1, FST, FSTL3, GNLY, HLA-F, HOMER3, HSD17B6, IFI6, IFIT3, IGFBP3, ISG15, ITGA5, ITGB4, KIF14, KIF23, KIF2C, LAMB3, LAMC2, LGALS3BP, LTBP1, MAGEA12, MMP1, MMP3, MMP9, MMP11, MMP12, MMP13, NEFL, NELL2, OASL, PCDH7, PDPN, PLA2G7, PLAU, PSMB9, PTHLH, PTK7, PXDN, RBP1, RGS20, RSAD2, SCG5, SERPINE1, SERPINH1, SLC7A8, SPP1, THY1, TK1, TPX2, TRIP13, UBE2C, VEGFC |
Table 2.
| Gene names (upregulated DEGs) |
|---|
| ABCA8, ACADSB, ACOX2, ACTA1, ACTN2, ADH1B, ADIPOQ, ALDH1A1, ALOX12, AMPD1, ANG, APOD, ATP1A2, ATP2A1, AZGP1, CA3, CFD, CHRDL1, CILP, CKM, CKMT2, CLDN8, CLDN10, COBL, COX6A2, COX7A1, CRISP2, CRISP3, CRYAB, CSRP3, CYP3A5, DMBT1, DPT, EEF1A2, ENO3, EPHX2, EYA2, FMO2, FUT6, FXYD1, GAS7, GPD1L, GULP1, HBB, HLF, HSPB2, KRT4, LIFR, LTF, MAL, MB, MEOX2, MFAP4, MYBPC1, MYH2, MYH6, MYH7, MYL1, MYL2, MYLPF, MYOC, MYOM1, MYRIP, NEB, NR3C2, PBX1, PEG3, PIP, PKIA, PLA2G2A, PLN, PLP1, PPARG, PPP1R1A, PPP1R3C, PRELP, PROM1, PYGM, RNASE4, RRAGD, SCNN1B, SELENBP1, SLITRK5, SLN, STATH, SYNGR1, TCAP, TF, TFF1, TFF3, TGFBR3, TJP3, TLE2, TLR5, TMOD1, TMPRSS2, TNNC1, TNNC2, TSPAN8, TTN, WIF1 |
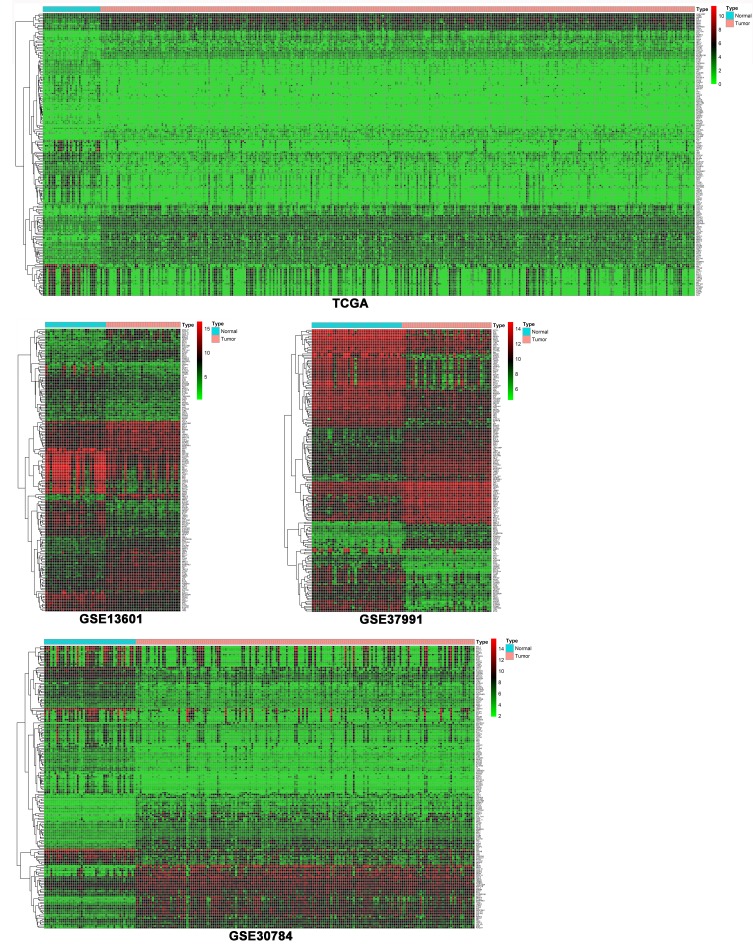
As shown in Figure 2, heat maps were generated with R based on the expression levels of common DEGs in GSE13601, GSE30784, GSE37991 and TCGA. Each column represented a biological sample and each row in the heat map represents a gene. The color indicated the expression levels of genes between cancer tissues and normal controls.
Figure 2.
Heatmaps of the common DEGs between OSCC tissues and normal controls in GSE13601, GSE30784, GSE37991 and TCGA.
Gene ontology and pathway enrichment analysis
Gene Ontology and pathway enrichment analysis of the common DEGs were performed using the DAVID and IPA respectively. For the “biological processes (BP)”, collagen catabolic process, extracellular matrix disassembly, cell adhesion, extracellular matrix organization and platelet degranulation were the commonly enriched categories. For the “cellular component (CC)” ontology, enriched categories among common DEGs were correlated with extracellular region, extracellular space, proteinaceous extracellular matrix, extracellular matrix and extracellular exosome. With regards to the “molecular function (MF)”, the common DEGs mainly showed enrichment in CXCR3 chemokine receptor binding, metalloendopeptidase activity, serine-type endopeptidase activity, actin binding and heparin binding (Figure 3A). IPA showed that the top canonical pathways associated with common DEGs were agranulocyte adhesion and diapedesis, granulocyte adhesion and diapedesis, inhibition of matrix metalloprotease, leukocyte extravasation signaling and bladder cancer signaling (Figure 3B).
Figure 3.
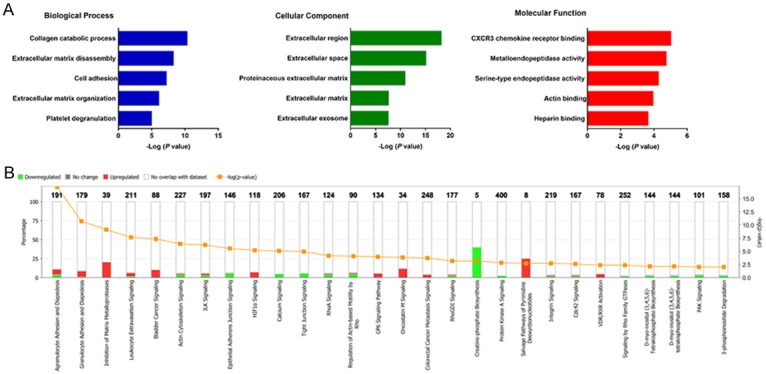
Gene ontology analyses of the common DEGs according to their biological process, cellular component and molecular function (A). Ingenuity pathway analysis of the common DEGs to identify the canonical pathways involving in carcinogenesis of OSCC (B).
Key candidate genes identification with DEGs PPI network
The PPI network of DEGs was constructed by using the STRING online database and Cytoscape (Figure 4A). Then the central node genes (more than 10 connections/interactions) were identified (Supplementary Figure 1) and the top ten highly connected genes were ACTN2, ACTA1, FN1, MMP9, TTN, TNNC2, MYH6, MYL1, TNNC1, MYL2.
Figure 4.
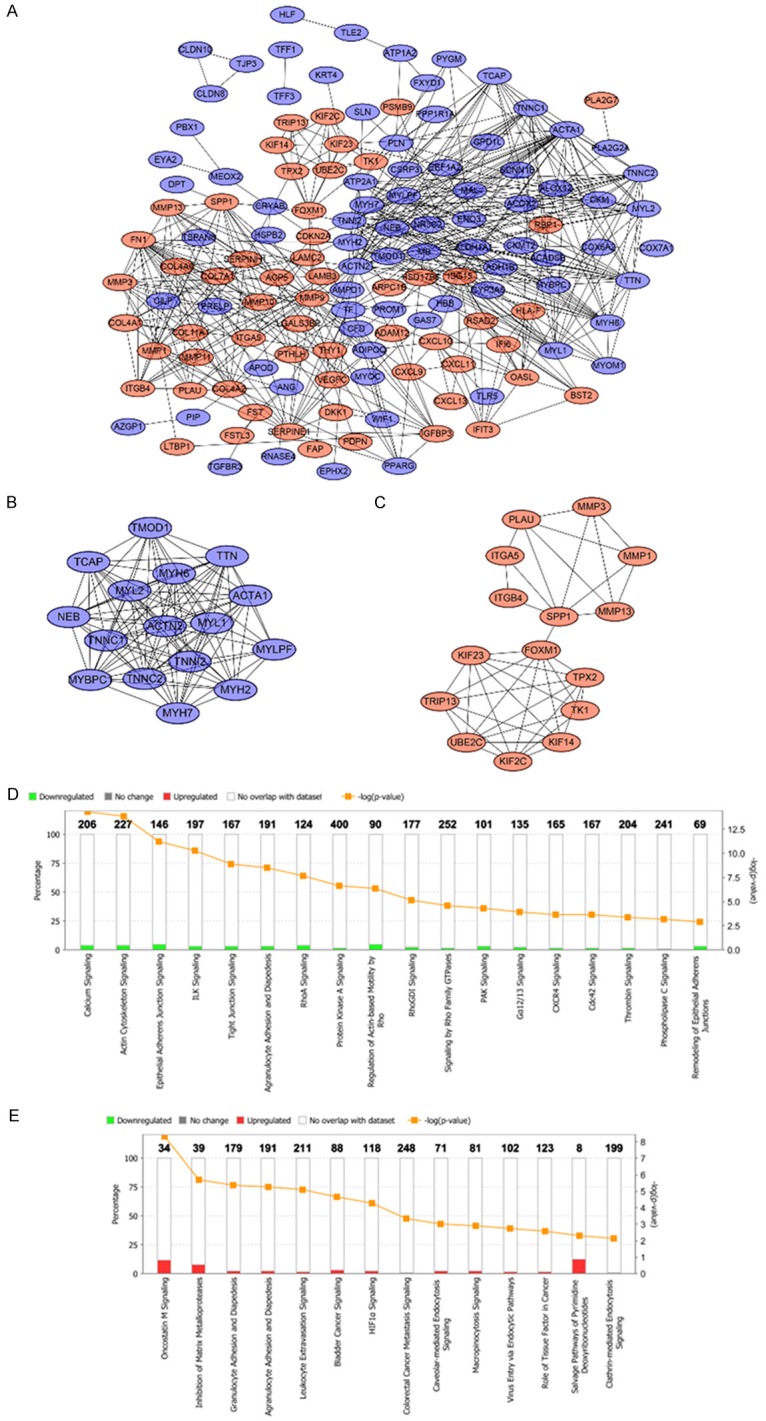
PPI network of the common DEGs identified from GSE13601, GSE30784, GSE37991 and TCGA was constructed (A). Two sub-networks were identified by Cytoscape MCODE plug-in (B, C). Ingenuity pathway analysis of the common DEGs in sub-network 1 to identify the canonical pathways (D). Ingenuity pathway analysis of the common DEGs in sub-network 2 to identify the canonical pathways (E).
MCODE plugin was used for module analysis of the PPI network and the most significant two modules were chosen for further pathway analyses based on the degree of importance. Module 1 and module 2 consisted of 16 nodes and 15 nodes respectively (Figure 4B, 4C). Pathway enrichment analyses revealed the genes in module 1 were mainly correlated with reduced calcium ion signaling and loss of adherens junctions and tight junctions (Figure 4D). The genes in module 2 were mainly associated with increased oncostatin M signaling, cell diapedesis and extravasation as well as other cancer promoting pathways (Figure 4E).
Identification of prognostic signature
Univariate Cox regression was performed to analyze each common DEG as potential predictor of OS in 329 OSCC patients from TCGA cohort. This procedure identified a prognostic signature containing three genes: PLAU, CLDN8 and CDKN2A. The risk score for each patient was calculated as follows: risk score = (0.002) * PLAU + (0.048) * CLDN8 + (-0.012) * CDKN2A. According to the area under the receiver operating characteristic curve (AUC) value, the specificity and sensitivity were both highest when the risk score was 0.974 (Figure 5). The TGCA patients were divided into high risk group (risk score ≥0.974, n = 182) and low risk group (risk score <0.974, n = 147). The OSCC patients in high-risk group had statistically significantly worse overall survival (35.4%; 95% CI = 27.3%-45.8%) than those in low risk group (52.9%; 95% CI = 41.9%-67.5%) in TCGA cohort (P = 5.031e-6) (Figure 6).
Figure 5.
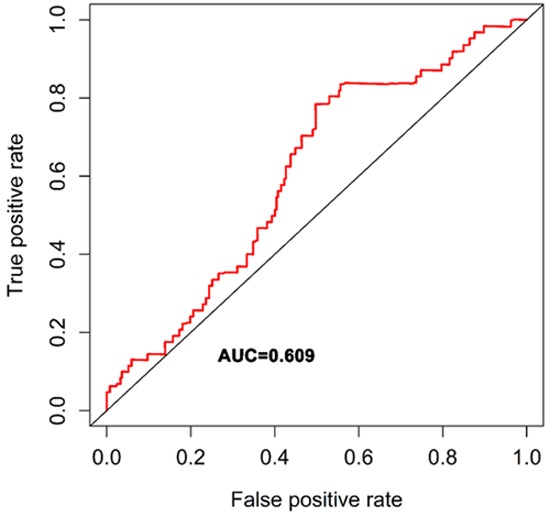
ROC analysis was performed to find out the most optimal cutoff value to divide the OSCC patients into high risk and low risk group.
Figure 6.
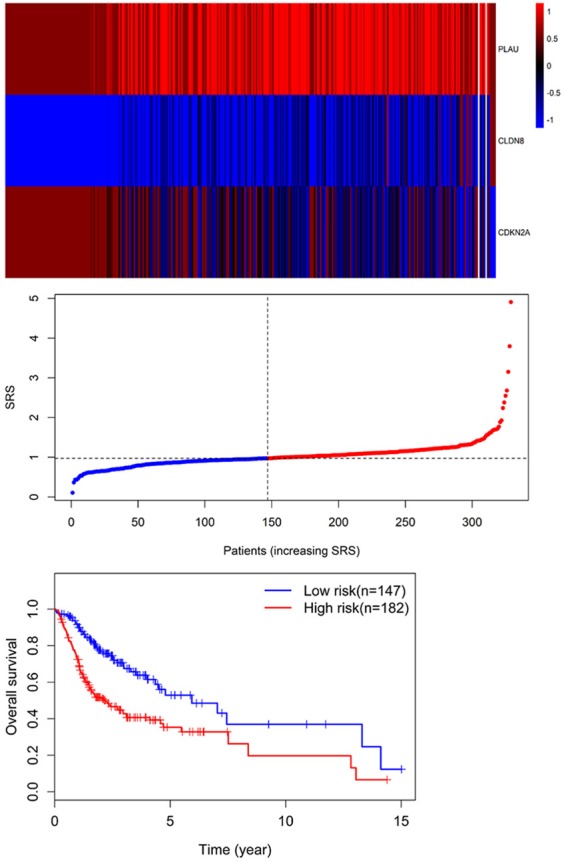
Three expression and risk score distribution in TCGA cohort by z-score, with red indicating higher expression and light blue indicating lower expression. The risk scores for all patients in TCGA cohort are plotted in ascending order and marked as low risk (blue) or high risk (red), as divided by the threshold (vertical black line). Survival analysis showed that the patients in the high risk grouphad statistically significantly worse overall survival (35.4%; 95% CI = 27.3%-45.8%) than those in low risk group (52.9%; 95% CI = 41.9%-67.5%) in TCGA cohort (P = 5.031e-6).
Validation of the three genes prognostic signature by use of an independent cohort
GSE41613 dataset including 97 OSCC patients was used for the validation of the prognostic three genes signature. Similarly, the individual risk score for each patient was calculated. By using the risk score = 0.974 as the threshold, OSCC patients were stratified into high-risk (n = 76) and low-risk groups (n = 21). Survival analysis demonstrated that OS of the high-risk patients (46.1%; 95% CI = 36.1%-58.7%) was significantly lower compared with that of low-risk patients (70.7%; 95% CI, 53.5%-93.6%) (P = 0.039) (Figure 7).
Figure 7.
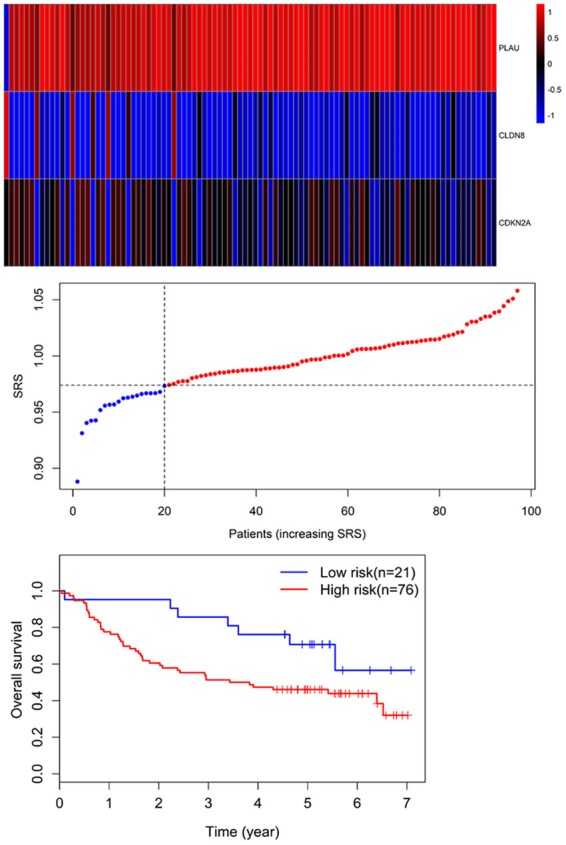
Three-gene expression and risk score distribution in the GSE41613 cohort by z-score, with red indicating higher expression and light blue indicating lower expression. The risk scores for all patients in GSE41613 cohort are plotted in ascending order and marked as low risk (blue) or high risk (red), as divided by the threshold (vertical black line). The OS of the high-risk patients (46.1%; 95% CI = 36.1%-58.7%) was significantly lower in comparison with that of low-risk patients (70.7%; 95% CI, 53.5%-93.6%) (P = 0.039).
Discussion
The carcinogenesis of OSCC is a multistep process during which cells undergo profound metabolic and behavioural changes, leading them to proliferate in an uncontrolled way. However, the underlying molecular mechanisms remain unclear. In this study, we have identified common significant DEGs from four independent studies. Functional analyses demonstrated that these DEGs are mainly associated with loss of tumor suppressive signaling and activation of cancer promoting pathways. More importantly, based on TCGA dataset, a set of robust prognostic signatures including PLAU, CLDN8 and CDKN2A were identified from DEGs and could predict overall survival. This three-gene signature was further successfully validated as a prognostic marker for OS prediction in patients with OSCC in another independent cohort.
Based on GO and IPA enrichment analyses of the common DEGs among different studies, “collagen catabolic process” has the highest enrichment score in the “biological process” category. The upregulation of collagen catabolic metabolism might due to increased levels of MMPs [7]. Other biological processes such as extracellular matrix disassembly and cell adhesion are also enriched. For the “cellular component” category, “extracellular region” shows the highest enrichment score. Interestingly, the top 5 cellular components are all associated with extracellular space or matrix, indicating that cell-to-cell communication is critical for cancer progression. Regarding the “molecular function (MF)” category, the most affected molecular function is CXCR3 chemokine receptor binding. The role for CXCR3 in cancer is complicated and dependent on various factors including cancer type, stage of disease and tumor microenvironment [8]. For the ingenuity pathway analysis, the canonical pathways associated with common DEGs are related to cell diapedesis and extravasation, MMPs pathways and tight junction signaling. Interestingly, the DEGs are involved in upregulation of known oncogenic pathway such as HIF-1a pathway and oncostatin M signaling.
PPI network analysis provides detailed interaction/connection among the common DEGs. The top ten highly interacted/connected genes were ACTN2, ACTA1, FN1, MMP9, TTN, TNNC2, MYH6, MYL1, TNNC1 and MYL2. FN1 encodes fibronectin, which is a glycoprotein involving in cellular adhesion and migration processes. A defining feature of epithelial-mesenchymal transition (EMT) is the gain of fibronectin and its upregulation promote the invasive capacity of cancer cells [9]. MMP9 is capable of degrading type IV collagen of the basement membrane, which is crucial for cancer invasion and metastasis [10]. Interestingly, other eight dysregulated genes are muscle related genes. These genes might play a regulatory role in control of cellular locomotion, cytoplasmic streaming, and cytokinesis in non-muscle cells. Further studies are warranted to elucidate the role of muscle related genes in OSCC carcinogenesis. Two sub-networks were constructed Cytoscape MCODE plug-in. In sub-network 1, the downregulated DEGs were mainly associated with reduced calcium signaling, actin cytoskeleton signaling, adherens and tight junction signaling and ILK signaling. Deregulation of the calcium signal is involved in tumor initiation, angiogenesis, progression and metastasis [11]. Loss of cell adhesion and tight junction lead to invasion and thus metastasis of cancer cells [12]. In sub-network 2, the upregulated DEGs were correlated with oncostatin M signaling, MMPs pathways as well as cell diapedesis and extravasation pathway. The inflammatory cytokine oncostatin-M promotes tumor progression by enhancing angiogenesis and metastasis [13]. There are some similarities between extravasation of tumor cells and leukocytes [14], thus it is reasonable to observe that the pathways involving in diapedesis and extravasation were upregulated.
The three-gene signature robustly predict the overall survival in OSCC patients from different cohorts. It provides potential biological and therapeutic information as well. uPA (PLAU) has been demonstrated to play critical roles in tissue remodelling and migration in the developmental as well as tumorigenesis process [15,16]. uPA and its receptor uPAR are important for extracellular proteolysis, cell/ECM interaction and cell migration, which are closely correlated with cancer cell dissemination and metastasis [17]. Deregulation of uPA has been reported in a wide variety of neoplasms [16]. The expression level of uPA was significantly overexpressed in OSCC tissues, especially in metastasis tumor. Increased uPA expression was associated with adverse clinicopathological parameters [18]. CLDN8 is mainly located in the cell membrane and associated with tight junctions of cell adhesion. The expression level of CLDN8 was remarkably downregulated in OSCC tissues compared to normal controls, indicating CLDN8 might play a tumor suppressive role. However, OSCC patients with higher expression of CLDN8 had poorer overall survival, suggesting that CLDN8 might promote the OSCC progression. One possible reason for this contradictory finding is that CLDN8 exerts different roles at different stages during cancer progression. Similarly, CLDN8 showed down-regulation in colorectal cancer tissues in comparison with adjacent normal tissues [19]. High levels of CLDN8 contribute to the progression of prostate cancer and osteosarcoma [20,21]. The role of CLDN8 in OSCC remains largely unknown and needs further investigation. The CDKN2A gene is located within chromosomal region 9 of p21 which is frequently lost and encodes the p16INK4a protein. p16INK4a specifically suppresses cyclin-dependent kinases 4 and 6 (CDK4, CDK6)-mediated phosphorylation of the retinoblastoma tumor suppressor (RB), and subsequently slow down cell cycle progression [22]. Loss of p16INK4a predisposes both mice and humans to cancer, and functional inactivation of CDKN2A is a common phenomenon in most tumor types [23]. Promoter hypermethylation of CDKN2A was significantly increased in oral cancer tissues compared to the normal controls. Also, inactivation of CDKN2A was associated with early incidence of OSCC and poor prognosis [24]. A recent study showed that the expression of CDKN2A was consistently reduced in recurrent OSCC compared with non-recurrent OSCC. In addition, recurrent OSCC patients with deleted CDKN2A expression suffered unfavorable clinical outcome [25]. To the best of our knowledge, most current available molecular signatures for OSCC are used either to differentiate OSCC patients from healthy controls or to identify the existence of lymph node metastasis, recurrence or extracapsular spread in patients with OSCC [26-28]. Few signatures have been developed for predicting the overall survival for OSCC. In addition, these survival-associated molecular signatures generally have more than 10 genes [28,29], which are not feasible for therapeutic applications especially from a clinical point of view. Our three -gene molecular signature is not only robust and novel for survival prediction of OSCC, but also has promising practical value. Though the three-gene signature has great potential, there are some limitations. The training set and validation cohorts were retrospective, and therefore these findings must be validated prospectively in the future studies.
In conclusion, our study has profiled consistently changed genes between OSCC and normal controls, which are closely with the initiation and development of OSCC. These novel biomarkers might have clinical utility for the diagnosis and prognosis prediction in OSCC. With these potential biomarkers, it is possible that we can diagnose OSCC at the very early stage. Moreover, combination of these biomarkers might stratify the OSCC patients with low risk and high risk for cancer progression and recurrence, which will provide useful guidance for personalized and precision therapy.
Disclosure of conflict of interest
None.
Supporting Information
References
- 1.Yang X, Ruan H, Hu X, Cao A, Song L. miR-381-3p suppresses the proliferation of oral squamous cell carcinoma cells by directly targeting FGFR2. Am J Cancer Res. 2017;7:913–922. [PMC free article] [PubMed] [Google Scholar]
- 2.Cui L, Cheng S, Liu X, Messadi D, Yang Y, Hu S. Syntenin-1 is a promoter and prognostic marker of head and neck squamous cell carcinoma invasion and metastasis. Oncotarget. 2016;7:82634–82647. doi: 10.18632/oncotarget.13020. [DOI] [PMC free article] [PubMed] [Google Scholar]
- 3.Fuller CD, Wang SJ, Thomas CR Jr, Hoffman HT, Weber RS, Rosenthal DI. Conditional survival in head and neck squamous cell carcinoma: results from the SEER dataset 1973-1998. Cancer. 2007;109:1331–1343. doi: 10.1002/cncr.22563. [DOI] [PubMed] [Google Scholar]
- 4.Barrett T, Edgar R. Mining microarray data at NCBI’s gene expression omnibus (GEO)*. Methods Mol Biol. 2006;338:175–190. doi: 10.1385/1-59745-097-9:175. [DOI] [PMC free article] [PubMed] [Google Scholar]
- 5.Clough E, Barrett T. The gene expression omnibus database. Methods Mol Biol. 2016;1418:93–110. doi: 10.1007/978-1-4939-3578-9_5. [DOI] [PMC free article] [PubMed] [Google Scholar]
- 6.Lee JS. Exploring cancer genomic data from the cancer genome atlas project. BMB Rep. 2016;49:607–611. doi: 10.5483/BMBRep.2016.49.11.145. [DOI] [PMC free article] [PubMed] [Google Scholar]
- 7.Lauer-Fields JL, Juska D, Fields GB. Matrix metalloproteinases and collagen catabolism. Biopolymers. 2002;66:19–32. doi: 10.1002/bip.10201. [DOI] [PubMed] [Google Scholar]
- 8.Oghumu S, Varikuti S, Terrazas C, Kotov D, Nasser MW, Powell CA, Ganju RK, Satoskar AR. CXCR3 deficiency enhances tumor progression by promoting macrophage M2 polarization in a murine breast cancer model. Immunology. 2014;143:109–119. doi: 10.1111/imm.12293. [DOI] [PMC free article] [PubMed] [Google Scholar]
- 9.Jung HY, Fattet L, Yang J. Molecular pathways: linking tumor microenvironment to epithelial-mesenchymal transition in metastasis. Clin Cancer Res. 2015;21:962–968. doi: 10.1158/1078-0432.CCR-13-3173. [DOI] [PMC free article] [PubMed] [Google Scholar]
- 10.Zeng ZS, Cohen AM, Guillem JG. Loss of basement membrane type IV collagen is associated with increased expression of metalloproteinases 2 and 9 (MMP-2 and MMP-9) during human colorectal tumorigenesis. Carcinogenesis. 1999;20:749–755. doi: 10.1093/carcin/20.5.749. [DOI] [PubMed] [Google Scholar]
- 11.Cui C, Merritt R, Fu L, Pan Z. Targeting calcium signaling in cancer therapy. Acta Pharm Sin B. 2017;7:3–17. doi: 10.1016/j.apsb.2016.11.001. [DOI] [PMC free article] [PubMed] [Google Scholar]
- 12.Martin TA, Jiang WG. Loss of tight junction barrier function and its role in cancer metastasis. Biochim Biophys Acta. 2009;1788:872–91. doi: 10.1016/j.bbamem.2008.11.005. [DOI] [PubMed] [Google Scholar]
- 13.Stephens JM, Elks CM. Oncostatin M. Potential implications for malignancy and metabolism. Curr Pharm Des. 2017;23:3645–3657. doi: 10.2174/1381612823666170704122559. [DOI] [PubMed] [Google Scholar]
- 14.Strell C, Entschladen F. Extravasation of leukocytes in comparison to tumor cells. Cell Commun Signal. 2008;6:10. doi: 10.1186/1478-811X-6-10. [DOI] [PMC free article] [PubMed] [Google Scholar]
- 15.Bugge TH, Suh TT, Flick MJ, Daugherty CC, Rømer J, Solberg H, Ellis V, Danø K, Degen JL. The receptor for urokinase-type plasminogen activator is not essential for mouse development or fertility. J Biol Chem. 1995;270:16886–16894. doi: 10.1074/jbc.270.28.16886. [DOI] [PubMed] [Google Scholar]
- 16.Andreasen PA, Kjøller L, Christensen L, Duffy MJ. The urokinase-type plasminogen activator system in cancer metastasis: a review. Int J Cancer. 1997;72:1–22. doi: 10.1002/(sici)1097-0215(19970703)72:1<1::aid-ijc1>3.0.co;2-z. [DOI] [PubMed] [Google Scholar]
- 17.Sidenius N, Blasi F. The urokinase plasminogen activator system in cancer: recent advances and implication for prognosis and therapy. Cancer Metastasis Rev. 2003;22:205–222. doi: 10.1023/a:1023099415940. [DOI] [PubMed] [Google Scholar]
- 18.Zhang Z, Pan J, Li L, Wang Z, Xiao W, Li N. Survey of risk factors contributed to lymphatic metastasis in patients with oral tongue cancer by immunohistochemistry. J Oral Pathol Med. 2011;40:127–134. doi: 10.1111/j.1600-0714.2010.00953.x. [DOI] [PubMed] [Google Scholar]
- 19.Gröne J, Weber B, Staub E, Heinze M, Klaman I, Pilarsky C, Hermann K, Castanos-Velez E, Röpcke S, Mann B, Rosenthal A, Buhr HJ. Differential expression of genes encoding tight junction proteins in colorectal cancer: frequent dysregulation of claudin-1, -8 and -12. Int J Colorectal Dis. 2007;22:651–659. doi: 10.1007/s00384-006-0197-3. [DOI] [PubMed] [Google Scholar]
- 20.Ashikari D, Takayama KI, Obinata D, Takahashi S, Inoue S. CLDN8, an androgen-regulated gene, promotes prostate cancer cell proliferation and migration. Cancer Sci. 2017;108:1386–1393. doi: 10.1111/cas.13269. [DOI] [PMC free article] [PubMed] [Google Scholar]
- 21.Xu J, Yang Y, Hao P, Ding X. Claudin 8 contributes to malignant proliferation in human osteosarcoma U2OS cells. Cancer Biother Radiopharm. 2015;30:400–404. doi: 10.1089/cbr.2015.1815. [DOI] [PubMed] [Google Scholar]
- 22.LaPak KM, Burd CE. The molecular balancing act of p16(INK4a) in cancer and aging. Mol Cancer Res. 2014;12:167–183. doi: 10.1158/1541-7786.MCR-13-0350. [DOI] [PMC free article] [PubMed] [Google Scholar]
- 23.Zhao R, Choi BY, Lee MH, Bode AM, Dong Z. Implications of genetic and epigenetic alterations of CDKN2A (p16(INK4a)) in cancer. EBioMedicine. 2016;8:30–39. doi: 10.1016/j.ebiom.2016.04.017. [DOI] [PMC free article] [PubMed] [Google Scholar]
- 24.Su PF, Huang WL, Wu HT, Wu CH, Liu TY, Kao SY. p16(INK4A) promoter hypermethylation is associated with invasiveness and prognosis of oral squamous cell carcinoma in an age-dependent manner. Oral Oncol. 2010;46:734–739. doi: 10.1016/j.oraloncology.2010.07.002. [DOI] [PubMed] [Google Scholar]
- 25.Padhi SS, Roy S, Kar M, Saha A, Roy S, Adhya A, Baisakh M, Banerjee B. Role of CDKN2A/p16 expression in the prognostication of oral squamous cell carcinoma. Oral Oncol. 2017;73:27–35. doi: 10.1016/j.oraloncology.2017.07.030. [DOI] [PubMed] [Google Scholar]
- 26.Ziober AF, Patel KR, Alawi F, Gimotty P, Weber RS, Feldman MM, Chalian AA, Weinstein GS, Hunt J, Ziober BL. Identification of a gene signature for rapid screening of oral squamous cell carcinoma. Clin Cancer Res. 2006;12:5960–5971. doi: 10.1158/1078-0432.CCR-06-0535. [DOI] [PubMed] [Google Scholar]
- 27.van Hooff SR, Leusink FK, Roepman P, Baatenburg de Jong RJ, Speel EJ, van den Brekel MW, van Velthuysen ML, van Diest PJ, van Es RJ, Merkx MA, Kummer JA, Leemans CR, Schuuring E, Langendijk JA, Lacko M, De Herdt MJ, Jansen JC, Brakenhoff RH, Slootweg PJ, Takes RP, Holstege FC. Validation of a gene expression signature for assessment of lymph node metastasis in oral squamous cell carcinoma. J. Clin. Oncol. 2012;30:4104–4110. doi: 10.1200/JCO.2011.40.4509. [DOI] [PubMed] [Google Scholar]
- 28.Wang W, Lim WK, Leong HS, Chong FT, Lim TK, Tan DS, Teh BT, Iyer NG. An eleven-gene molecular signature for extra-capsular spread in oral squamous cell carcinoma serves as a prognosticator of outcome in patients without nodal metastases. Oral Oncol. 2015;51:355–362. doi: 10.1016/j.oraloncology.2014.12.012. [DOI] [PubMed] [Google Scholar]
- 29.Qiu Z, Sun W, Gao S, Zhou H, Tan W, Cao M, Huang W. A 16-gene signature predicting prognosis of patients with oral tongue squamous cell carcinoma. PeerJ. 2017;5:e4062. doi: 10.7717/peerj.4062. [DOI] [PMC free article] [PubMed] [Google Scholar]
Associated Data
This section collects any data citations, data availability statements, or supplementary materials included in this article.


