Abstract
Arachidonic acid (AA) and its metabolites are involved in the development and progression of inflammation and tumors in various tissues. We investigated the protein-protein interaction network (PPIN) of key enzymes in AA metabolism and their interacting proteins, as well as their expression patterns in different types of esophageal disease, involving esophagitis, Barrett’s esophagus, adenocarcinoma and squamous cell carcinoma. PPINs were constructed to illustrate the key enzymes and their interacting proteins along the metabolic cascade. The network also showed key enzymes that could connect or cross-talk with at least one partner protein. The inflammation-related gene RELA (NF-kB) was found to interact with both PLA2G4A and ALOX5. Expression levels of the PPIN proteins, as well as their expression correlations, in different esophageal diseases were analyzed and integrated into the PPIN to illustrate a dynamic change. At least six significant pairs of expression relationships were identified across different esophageal diseases. The expression levels of eight enzymes (ALOX5, ALOX5AP, CYP2C8, CYP4F11, LTA4H, PLA2G4A, CYP2D6, PTGES2) correlated with the survival time of ESCC patients. In summary, we constructed an AA metabolic PPIN to explore AA metabolism-related gene expression patterns in esophageal diseases, showing their dynamic change and potential for therapeutic targeting from inflammation to cancer.
Keywords: Arachidonic acid metabolism, protein-protein interaction network, esophageal cancer
Introduction
Arachidonic acid (AA) is released from phospholipids by phospholipase A2, and converted to endogenous bioactive eicosanoids, such as prostaglandins, leukotrienes, and other bioactive products, through the action of three classes of key enzymes: cyclooxygenase, lipoxygenase, and cytochrome P450 (CYP). The immediate product of ALOX5 is leukotriene A4 (LTA4), which is enzymatically converted into either leukotriene B4 (LTB4) by LTA4 hydrolase (LTA4H), or leukotriene C4 (LTC4) by LTC4 synthase (LTC4S). Cyclooxygenases, such as COX-1 (PTGS1) and COX-2 (PTGS2), generate prostanoids that can be further subdivided into three main groups: the prostaglandins (PGs), prostacyclin (PGI2), and thromboxanes (TXs). CYP epoxygenases (CYP-EOs) convert arachidonic acid to epoxyeicosatrienoic acids (EETs). CYP hydroxylases (CYP-HOs) metabolize arachidonic acid to hydroxyeicosatetraenoic acids (HETEs) [1-3].
Eicosanoids derived from the arachidonic acid cascade and their catabolic key enzymes, have been implicated in the pathogenesis of a variety of human diseases, as well as tumor promotion, progression and metastasis [4-6]. Over-expression of PLA2G4A promotes proliferation of colorectal cancer cells [7], and increased expression of PLA2G4A occurs in the progression of Barrett’s esophageal mucosa to adenocarcinoma [8]. Inhibition of ALOX5 by F3 suppresses vascular endothelial growth factor (VEGF)-induced tube formation and chemoinvasion of endothelial cells in vitro [9]. On the other hand, deletion of ALOX5 in the tumor microenvironment promotes lung cancer progression and metastasis through regulating T cell recruitment [10]. An exaggerated activity of the LTA4H enzyme frequently coexists with, and is believed to contribute to the pathogenesis of a variety of diseases associated with neutrophils, including sepsis, cystic fibrosis, non-steroid-dependent asthma, and chronic obstructive pulmonary disease [11]. The expression and functional roles of other key enzymes related to AA metabolism in tumors have been summarized in several reviews [12-15].
Protein-protein interaction network (PPIN)-based analyses have become more prevalent due to the greater availability of high-throughput data [16]. The PPIN is able to illustrate more information at a glance, to identify the key genes or predict drug targets [17]. Network-based computational approaches aim to systematically integrate measurements from high-throughput experiments to gain a global understanding of cellular function.
The esophagus is an open organ, connecting with the mouth and stomach, and easily suffers from reflux. Reflux esophagitis causes dysplasia and metaplasia, and abnormal esophageal mucosa metaplasia can predispose individuals to various kinds of esophageal disease, including carcinoma [18,19]. Considering these characteristics, the esophagus provides a good model to study the dynamic changes of AA metabolism in the disease process. We assumed that the key enzymes of AA metabolism, and their interacting proteins, could decide the metabolic direction and trend of AA, when considering their expression levels and the expression correlation strength. In this study, we applied PPIN-based analyses of key enzymes required for AA metabolism, to illustrate a dynamic view of the change for AA metabolism-related genes in different esophageal diseases.
Methods and materials
Identification of the AA metabolism pathway and its key enzymes
By searching the PubMed literature and taking KEGG map00590 (arachidonic acid metabolism pathway) as the model, the key metabolic enzymes in AA metabolism were identified and shown for convenient illustration.
Construction of the PPIN for AA metabolism
The latest human protein-protein interaction data were obtained from several databases, such as HPRD (http://www.hprd.org/), BioGRID (http://thebiogrid.org/), DIP (http://dip.doe-mbi.ucla.edu/dip/Main.cgi), and IntAct (http://www.ebi.ac.uk/intact/). Physical protein interactions were collected from published papers and confirmed by low-throughput or high-throughput experiments, providing high confidence for future analyses, such as disease research integrated with the human PPIN [20]. The protein interaction dataset from different databases was integrated manually to reduce redundancy, and obtain a unique dataset containing all known published human protein-protein interactions. This unique PPI dataset had 20,815 unique proteins and 288,496 interactions, and was considered as the parental PPI network from which new or child PPI networks were constructed.
Cytoscape software is a powerful free software, for visualization, data integration and analysis of PPINs, with its diverse application of plugins [21]. For visualization, PPINs are presented with the nodes as the proteins and the edges as their interactions. First, the AA metabolism enzymes (genes) were mapped to the parental PPIN, and their first class directly-interacting proteins were extracted to construct the sub-network, which we called “Full-PPIN”. Second, to better illustrate the proteins between AA metabolic enzymes, only key enzymes and their connecting proteins were extracted to construct a more direct PPI sub-network, which we named “Core-PPIN”. Third, AA metabolic enzymes linked through only one partner protein were indicated in a smaller PPI sub-network, which we named “compact-PPIN”.
Generation of the functional annotation map
Functional enrichment analysis of the AA metabolism PPI network was performed using the ClueGO & CluePedia plugin to identify the enriched Gene Ontology (GO) “Biological Process” term, which also creates a network of functionally and hierarchically organized GO/pathway terms [22]. Only the GO terms with a P-value less than 0.001 were considered as significant. To indicate the relationship between GO terms, a kappa score reflecting the overlapping gene number of terms was set to 0.3 as the threshold to link the terms in the network.
Subcellular localization of the AA metabolism PPIN components
Information of subcellular localization for proteins in the AA metabolism PPIN was obtained from the HPRD database, which was imported into the network as a node attribute. If some proteins were annotated as having multiple locations, all locations were noted, e.g. if a protein translocated from the cytoplasm into the nucleus, these locations were merged as cytoplasm/nucleus. Cerebral, a Cytoscape plug-in, was used to distribute the protein nodes in the AA metabolism PPI network into multiple layers according to their subcellular localization, generating a pathway-like graph [23].
Expression pattern of proteins in the AA metabolism PPIN in esophageal disease
The expression profiles of three esophageal diseases, in the Gene Expression Omnibus (GEO) database (https://www.ncbi.nlm.nih.gov/geo/), were chosen to study the dynamic changes of the AA metabolism PPIN, with the detailed information shown in (Table 1). Expression data from the GEO was analyzed by using GEO2R to calculate the fold-change of proteins in the Full-PPIN. GEO2R is an interactive web tool that allows users to compare two or more groups of samples in a GEO Series in order to identify genes that are differentially expressed across different experimental conditions [24].
Table 1.
Brief description of applied GEO data
| Accession number | Experimental design | Disease stage or treatment | References |
|---|---|---|---|
| GSE33426 | Three-dimensional tumor profiling reveals minimal mRNA heterogeneity in esophageal squamous cell carcinoma | Esophageal squamous cell carcinoma | PMID: 22280838 |
| GSE24931 | Bile acids promote adenocarcinoma in a novel transgenic mouse model of Barrett’s esophagus | Esophageal adenocarcinoma | PMID: 22264787 |
| GSE9768 | Identification of genes modulated by acid and bile in a Barrett’s esophagus cell line | Barrett’s esophagus cell line exposure to acid, a mixture of primary bile acids and deoxycholic acid, respectively | NA |
Moreover, the expression relationship was also analyzed by a custom R program to calculate the Pearson correlation coefficient of every two genes in the compact-PPIN. The fold-change and expression correlation coefficient were integrated into the compact-PPIN as the node attribute and edge attribute, respectively, to illustrate the dynamic changes of the AA metabolism PPI network in different esophageal diseases. The Pearson correlation coefficient matrix was clustered by Cluster 3.0 and visualized by TreeView software.
DNA mutations in AA metabolism enzyme genes
The mutations in the DNA sequences of AA metabolism enzyme genes in esophageal cancers were acquired from the cBioPortal database (http://www.cbioportal.org/), which provides visualization, analysis and download of large-scale cancer genomics data sets [25]. Currently, there are four datasets of DNA sequences in esophageal cancer that are available, and their detailed information is shown in Supplementary Table 1.
Gene expression and survival analyses
Esophageal carcinoma expression data (TCGA_ESCA_exp_HiSeq-2015-02-24) was downloaded from TCGA (https://cancergenome.nih.gov/), which contains the level 3 expression of 89 ESCC cases by RNA-seq. The X-tile 3.6.1 program was applied to define the optimal cutoff point for the expression level for AA metabolism enzymes to classify ESCC patients into high expressing and low expressing groups, following the Kaplan-Meier and log-rank test survival analyses by GraphPad Prism5.
Results
Construction of the PPIN involved in AA metabolism
Since AA and its metabolites are well known to play important roles in inflammation and cancer, the AA metabolism pathway has received more attention in recent years, and consists of several key or the rate-limiting enzymes. A detailed scheme for the canonical AA metabolism pathway is provided in Supplementary Figure 1.
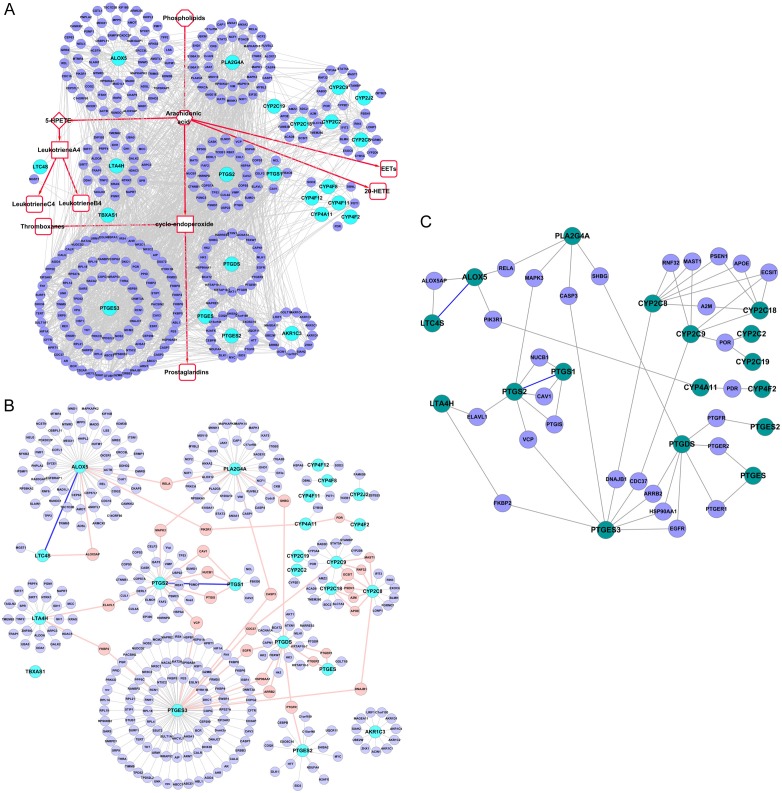
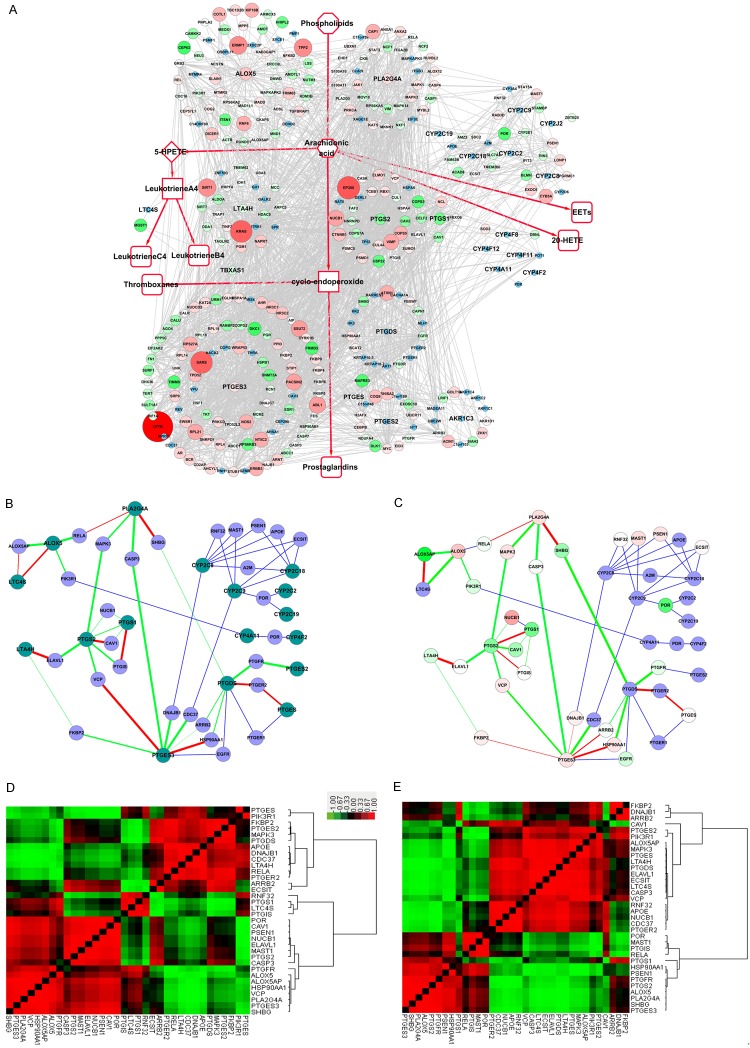
In this study, the AA metabolism PPI network was constructed along with the metabolic processes, comprised of the AA metabolism key enzymes with their known interacting proteins. We refer to this AA metabolism PPI network as the “Full-PPIN”, as it also shows the interactions between non-enzymes, as well, and contained 347 nodes and 2170 edges (Figure 1A). The top three genes having the highest number of interacting proteins were PTGES3 (91), ALOX5 (55) and PLA2G4A (36).
Figure 1.
Protein-protein interaction network (PPIN) of the canonical AA metabolism pathway. A. “Full-PPIN”, shows the interactions between known interactions in the network, as well as the non-enzymatic proteins. B. “Core-PPIN”, shows only key enzymes and their connecting proteins, reducing the redundant connections. C. “Compact-PPIN”, shows key AA metabolic enzymes linked through only one partner protein. Key AA metabolism enzymes are indicated in deep green, whereas the interacting proteins (non-enzymes and the linker) are shown in blue.
To reduce the number of redundant connections, only key enzymes and their connecting proteins were extracted to construct a more direct PPI sub-network, which we refer to as the “core-PPIN” (Figure 1B). In this way, we found key AA metabolism enzymes linked with other non-enzymatic proteins, clearly indicated as the pink nodes in Figure 1B. This suggests some key AA metabolism enzymes might connect or cross-talk through at least one partner protein.
For better illustration, the key AA metabolism enzymes linked through only one partner protein are indicated in the smaller PPI sub-network, referred to as the “compact-PPIN” (Figure 1C), where the key AA metabolism enzymes are indicated in deep green, while the linkers are shown in blue. Interestingly, we found that ALOX5 directly interacts with LTC4S. RELA (an NF-kB subunit) interacts with both PLA2G4A and ALOX5, suggesting RELA could potentially regulate these two key enzymes to promote or balance AA metabolism. These linker proteins between key AA metabolism enzymes might serve as switch proteins, determining the trend or the orientation of AA and its metabolites by their co-expression correlation strength.
Functional enrichment of the PPIN involved in AA metabolism
Many proteins have multiple functions, so we could not rule out the possibility that the AA metabolic proteins participate in other functions unrelated to AA metabolism. To examine this possibility, GO “Biological Process” enrichment analyses of the Full-PPIN were performed, resulting in 141 enriched GO terms with 965 edges, to construct a functional annotation map in which the nodes were no longer proteins, but rather their enriched GO terms, with the edges suggesting significant overlap of enriched proteins between two GO terms (Figure 2).
Figure 2.
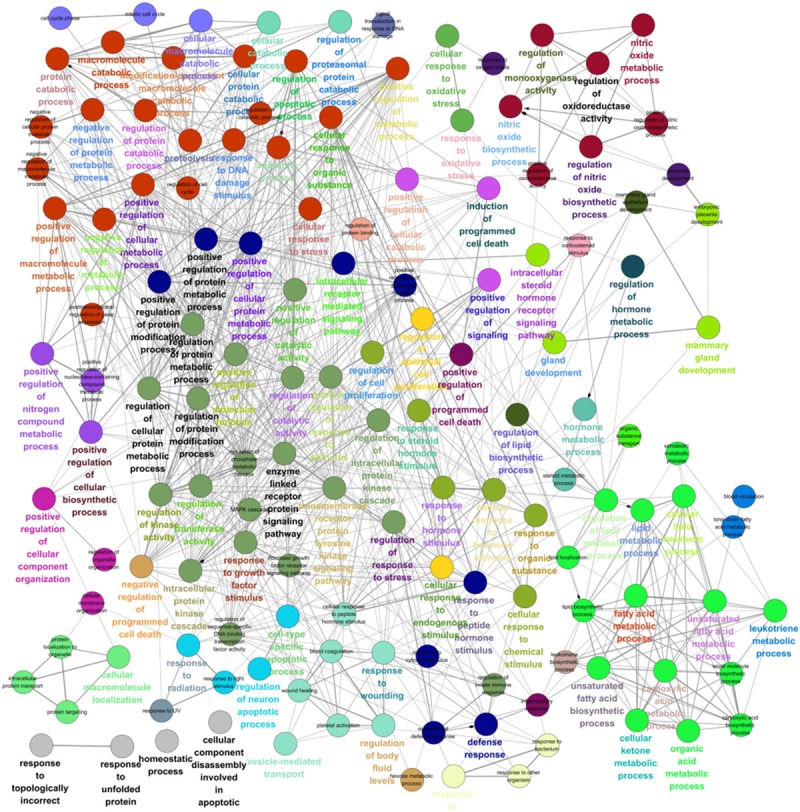
Gene Ontology (GO) “Biological Process” enrichment analyses of the “Full-PPIN”. Functionally-grouped network with terms as nodes linked based on their kappa score (≥0.3). Functionally-related groups partially overlap. Similar GO terms are labeled in the same or similar color. The four interesting functional groups are indicated. I: GO terms related to lipid metabolism, II: Signal transduction-related; III: Metabolic- or catabolic-associated GO terms, IV: Stimulus-related.
Not surprisingly, we found a group of GO terms related to lipid metabolism, such as “lipid metabolic process”, “fatty acid metabolic process”, “lipid biosynthetic process,” and “regulation of lipid metabolic process”. Many of the proteins in the AA metabolism PPIN participate in signal regulation or signal transduction. For example, “enzyme-linked receptor protein signaling pathway”, “response to growth factor stimulus”, “regulation of catalytic activity”, “regulation of response to stress”, “regulation of kinase activity”, and “regulation of transferase activity”. A large functional group contained several metabolic or catabolic-associated GO terms, such as “negative regulation of protein metabolic process”, “regulation of protein catabolic process”, and “positive regulation of cellular metabolic process”. There were also significant GO terms suggesting that AA metabolism might be affected by various stimuli, such as “response to steroid hormone stimulus”, “cellular response to hormone stimulus”, and “response to organic substance”. These significant GO terms indicate AA and its metabolites could be involved in multiple cellular functions. Potentially interesting GO terms are listed in Table 2.
Table 2.
Interesting significant GO terms for the SMYD3 knockdown PPI network
| Significant GO list | Term name | P-value corrected with Bonferroni |
|---|---|---|
| Lipid metabolism-related terms | ||
| GO:0006629 | Lipid metabolic process | 1.06E-8 |
| GO:0006631 | Fatty acid metabolic process | 2.99E-11 |
| GO:0008610 | Lipid biosynthetic process | 2.18E-4 |
| GO:0019216 | Regulation of lipid metabolic process | 5.81E-4 |
| GO:0044255 | Cellular lipid metabolic process | 6.20E-9 |
| Signal regulation-related terms | ||
| GO:0007167 | Enzyme-linked receptor protein signaling pathway | 4.75E-6 |
| GO:0070848 | Response to growth factor stimulus | 1.32E-4 |
| GO:0050790 | Regulation of catalytic activity | 4.67E-5 |
| GO:00801340 | Regulation of response to stress | 1.10E-5 |
| GO:00435490 | Regulation of kinase activity | 0.002 |
| GO:00513380 | Regulation of transferase activity | 5.07E-4 |
| GO:00305180 | Intracellular steroid hormone receptor signaling pathway | 4.89E-4 |
| GO:00230560 | Positive regulation of signaling | 0.009 |
| GO:00071690 | Transmembrane receptor protein tyrosine kinase signaling pathway | 1.84E-5 |
| Metabolic or catabolic-associated terms | ||
| GO:00512480 | Negative regulation of protein metabolic process | 4.28E-5 |
| GO:00421760 | Regulation of protein catabolic process | 3.55E-4 |
| GO:00313250 | Positive regulation of cellular metabolic process | 9.07E-10 |
| GO:00197520 | Carboxylic acid metabolic process | 9.23E-11 |
| GO:00442570 | Cellular protein catabolic process | 7.64E-7 |
| Stimulus-related terms | ||
| GO:00485450 | Response to steroid hormone stimulus | 1.05E-5 |
| GO:00328700 | Cellular response to hormone stimulus | 2.20E-8 |
| GO:00100330 | Response to organic substance | 5.24E-17 |
| GO:00094160 | Response to light stimulus | 0.008 |
| GO:00069740 | Response to DNA damage stimulus | 2.05E-4 |
| GO:00714950 | Cellular response to endogenous stimulus | 2.99E-9 |
Subcellular layers of proteins in the PPI sub-network
Proper subcellular localization of protein is extremely crucial because it guarantees the appropriate physiological context for their functions, such as signal transduction, transcription regulation, protein modification, and complex formation. The AA metabolism Full-PPIN was separated into 9 layers (Figure 3). The top four subcellular locations with percentage were the following: membrane (11.5%), cytoplasm (26.2%), cytoplasm/nucleus (29.6%), and nucleus (10.9%). These results show the proteins involved in AA metabolism are distributed from extracellular sites to intracellular sites, and into the nucleus. This suggests that AA metabolism might be regulated by various signals from different cellular parts. Most key enzymes were distributed in the cytoplasm. It is interesting to find that six enzymes (ALOX5, LTA4H, PTGS2, PTGES2, PTGES3 and PLA2G4A) are located in the cytoplasm/nucleus, suggesting that these key enzymes not only catalyze the formation of AA metabolites in the cytoplasm, but also translocate into nucleus for other functions, such as those identified by our functional enrichment results.
Figure 3.
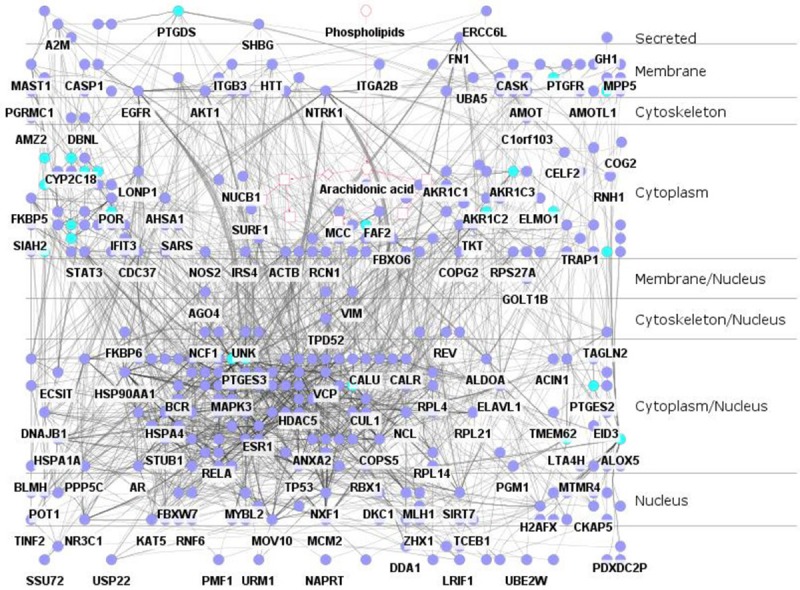
Subcellular layers within the Full-PPIN. The network was separated into 9 layers. Key AA metabolism enzymes are indicated in dark green.
Dynamic expression pattern of the AA metabolism PPIN in esophageal disease
PPI networks in living cells are not static, but dynamically varying in different tissues, even in different stages of the same tissue. In this study, three GEO datasets containing four esophageal disease stages or treatments were obtained. We analyzed the fold-change in expression of proteins in the AA metabolic network, as well as the expression correlation coefficient of each pair of proteins. Next, the fold-change and correlation coefficient were integrated into the key AA metabolic enzyme network as node attributes and edge attributes, respectively, to illustrate the dynamic changes of the network in different types of esophageal disease.
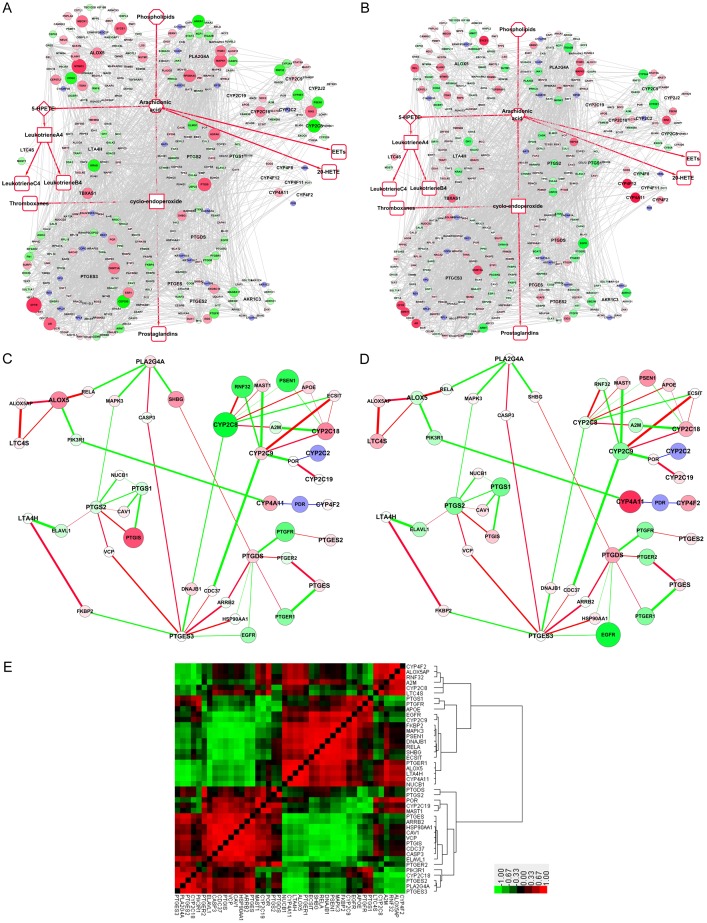
In the GSE9768 dataset (Donnellan C and Hardie L, unpublished), the Barrett’s esophagus cell line CP-A hTERT was treated with a 15-minute exposure to a mixture of primary bile acids or deoxycholic acid (DAC) (all at pH 4.5). After 2 h of acid treatment, the CFTR (cystic fibrosis transmembrane conductance regulator) gene increased 3.29-fold, the highest up-regulated differential in the network, whereas CYP2C8 (cytochrome P450 family 2 subfamily C member 8) was downregulated 3.55-fold, the most down-regulated differential in the network (Figure 4A). Among the upregulated key AA metabolic enzymes, ALOX5 increased the highest, with a 1.93-fold increase, suggesting a strong to convert arachidonic acid to 5-HPETE to leukotrienes. After 6 h of acid treatment, ALOX5 was decreased, whereas CYP4F12 and CYP4A11 were significantly increased. Other CYPs, such as CYP2C18, CYP2C19, CYP4F2 and CYP2D6, were slightly upregulated, suggesting conversion of arachidonic acid to EETs or 20-HETE (Figure 4B). Correlation analysis was performed for each pair of key AA metabolism enzymes in the compact-PPIN. Pearson correlation coefficients were integrated into the network based on the expression change. The red line indicates the positive correlations, while the green line suggests a negative correlation. The lines are thicker with higher correlation coefficients. ALOX5AP strongly correlated with both ALOX5 and LTC4S, while ALOX5 itself also positively correlated with LTC4S (Figure 4C, 4D). These results suggest that the transformation from arachidonic acid to 5-HPETE to leukotrienes is enhanced after treatment with primary bile acids. The correlations are illustrated by heatmap to provide a full view (Figure 4E). There are at least three large blocks of significant correlation in the heatmap as indicated.
Figure 4.
Expression changes and correlations of AA metabolism PPIN genes, in the GSE9768 dataset, before and after treatment with acid. A. Fold change of AA metabolism in the Full-PPIN after 2 h treatment. B. Fold change of AA metabolism in the Full-PPIN after 6 h treatment. Green and red nodes represent proteins encoded by down- and up-regulated genes, respectively. Blue nodes represent interacting proteins that were not differentially expressed or were undetected in the microarray. C. Expression correlation between before and after the treatment with acid, using the fold-change following 2 h treatment as the background. D. Expression correlation of the compact-PPIN after treatment with acid, using the fold-change following 6 h treatment as the background. Red lines indicate positive correlations, while green lines suggest negative correlations. Lines are thicker when the correlation coefficients are higher. E. Heatmap of expression correlation after treatment with acid. Red blocks indicate positive correlations, while green blocks suggest negative correlations.
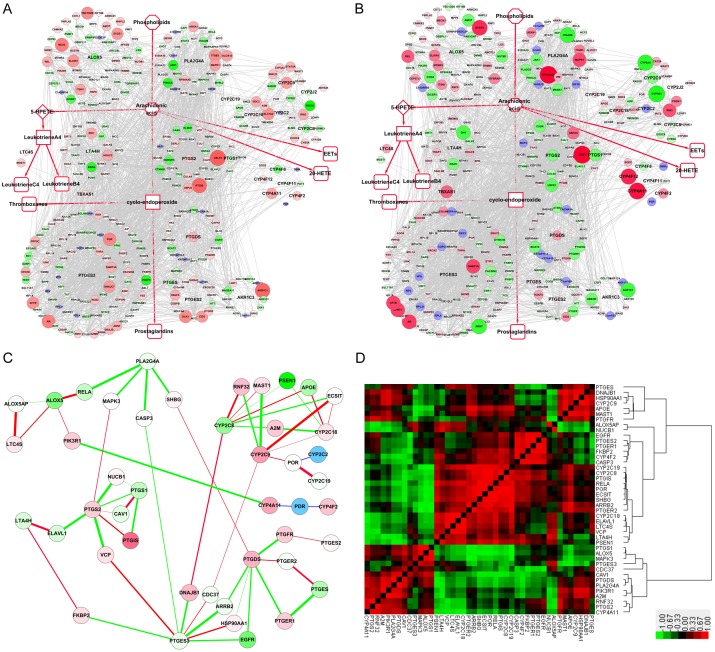
The third treatment in GSE9768 was with deoxycholic acid (DAC) for 2 and 6 h. At 2 h, CELF2 increased the highest at 4.28-fold, with PTGS2 (1.32 folds) and PTGDS (2.03-fold) also increased, indicating enhanced conversion of AA to prostaglandins (Figure 5A). At 6 h, only CYP4A11 and CYP4F12 were increased, being elevated by 3.3- and 3.0-fold, respectively (Figure 5B). The expression level of LTA4H dropped almost 25-fold (Figure 5B). In correlation analyses, ALOX5P significantly correlated with LTC4S, and ALOX5 significantly correlated with RELA, though both of them were decreased after DAC treatment (Figure 5C). The heat map shows that positive correlation and negative correlation almost just half in ratio (Figure 5D).
Figure 5.
Expression changes and correlations of the AA metabolism PPIN in the GSE9768 dataset after treatment with deoxycholic acid (DAC). A, B. Fold change of the AA metabolism “Full-PPIN” after DAC treatment for 2 h and 6 h, respectively. C. Expression correlation of genes, after treatment with acid, using the 2 h treatment as the background. D. Heatmap of expression correlation after treatment with DAC. Red block indicates positive correlations, whereas the green block suggests negative correlations.
In the GSE9768 dataset, the cells were also treated with a mixture of primary bile acids for 2 h. PTGIS (prostaglandin I2 synthase) was upregulated the highest, changing 3.23-fold, followed by PLA2G5 (2.88 fold-change) (Supplementary Figure 1). PLA2G4A also increased slightly, suggesting treatment with primary bile acids is a useful stimulus to produce AA. Though ALOX5 was downregulated, TBXAS1 increased 1.73-fold, suggesting thromboxanes would be increased (Supplementary Figure 2).
In the GSE33426 dataset, Yan et al. microdissected discrete sub-regions of esophageal squamous cell carcinoma (ESCC) and analyzed the transcriptomes throughout the three-dimensional tumor space [26]. Several mRNAs encoding proteins in the AA metabolism network were upregulated, including most of the key AA metabolism enzymes, such as PLA2G4A, ALOX5, LTA4H, PTGS and PTGES3. These results indicate that all AA metabolic pathways are activated in ESCC (Figure 6A). In normal esophageal cells, many key enzymes significantly correlated with the “switching protein”. For example, ALOX5 connected strongly with ALOX5AP, RELA and PIK3R1 in non-cancer esophageal cells. MAPK3 significantly correlated with PLA2G4A and PTGS2, whereas only ALOX5AP negatively correlated with LTA4S (Figure 6B). In ESCC cells from the GSE33426 dataset, the correlation between ALOX5 with ALOX5AP, RELA and PIK3R1 was slightly decreased, whereas the correlation between PIK3R1 and CYP2C9 was increased. On the other hand, the relationships of CYP2C8 and RNF32, and CYP2C18 and PSEN1 turned from positive to negative (Figure 6C). The heat map results, showing a full view of the relationships in GSE33426, suggest that the negative correlations were reduced, and positive correlations increased when normal tissue was compared to ESCC tissue, indicating the relationship of proteins in the network are strengthened during ESCC carcinogenesis (Figure 6D).
Figure 6.
Expression changes and correlation of the AA metabolism PPIN in the GSE33426 dataset of esophageal squamous cell carcinoma (ESCC). A. Fold change of the AA metabolism Full-PPIN of ESCC. B, C. Expression correlation of proteins in the compact-PPIN in normal esophageal tissue and ESCC, respectively. D, E. Expression correlation of proteins in the compact-PPIN in normal esophageal tissue and ESCC, respectively.
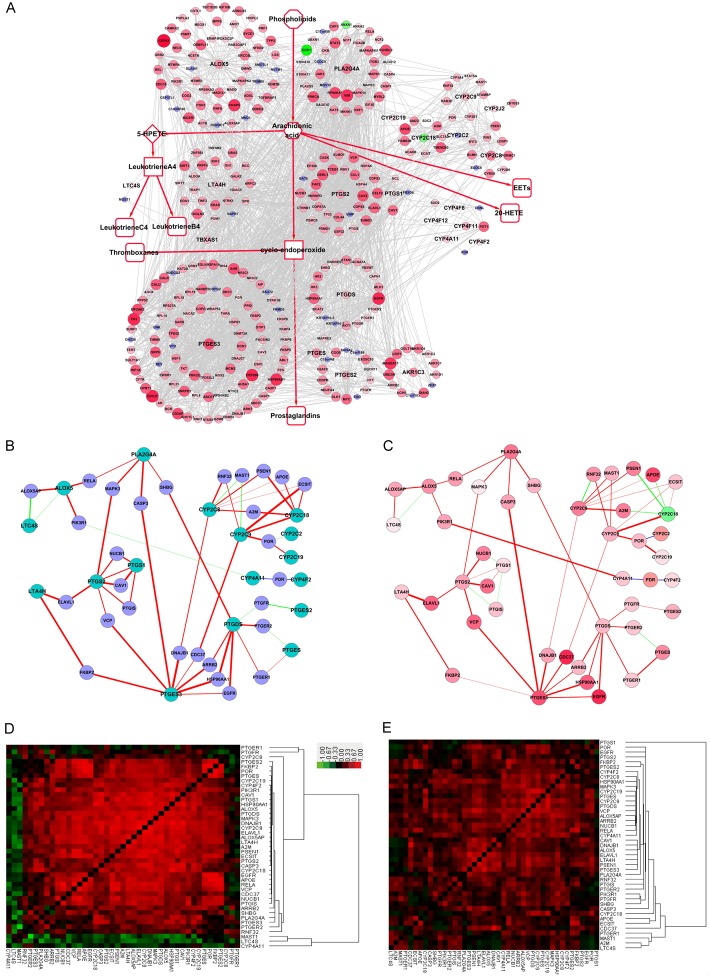
In the GSE24931 dataset, Quante et al. compared Barrett’s esophagus (BE) and esophageal adenocarcinoma (EAC) tissue with normal squamous epithelium in a mouse model [27]. The CFTR gene (cystic fibrosis transmembrane conductance regulator) increased the most at 9.15-fold, followed by EP300 (E1A binding protein p300) at 6.03-fold. Of the key enzymes, PLA2G4A, ALOX5 and PTGES3 were also significantly upregulated. Interestingly, ALOX5AP, an important activator of ALOX5, was the most downregulated gene, at -3.83-fold (Figure 7A). In normal tissue in GSE24931, ALOX5 positively correlated with LTC4S, with similar correlations occurring between VCP and PTGES3, and PTGS2 and CAV1 (Figure 7B). However, the correlations of these three pairs turned from positive to negative in esophageal cancer. On the other hand, the correlation between PTGES3 and DNAJB1 turned from negative to slightly positive, with both genes slightly upregulated (Figure 7C). In the heat map, both normal and cancer tissues show a clear block pattern (Figure 7D, 7E). In the cancer data from GSE24931, nearly all of the negative correlations were clustered in a more concentrated fashion than that in normal stage. Among the correlation analyses in the three datasets, we found six pairs of significant correlations (correlation coefficients all above 0.5) that were consistent in different esophageal diseases (Table 3), and involved two key enzymes, LTA4H and PTEGES, with LTA4H significantly correlating with both ALOX5AP and NUCB1. These results show that the expression of these enzymes, as well as their interacting proteins, vary throughout the progression of esophageal disease. Among the correlation analyses in the three dataset, we found six pairs of significant correlations (correlation coefficients all above 0.5) were consistent in different esophageal diseases (Table 3). It involved two key enzymes, LTA4H and PTEGES, with LTA4H both significantly correlating with ALOX5AP and NUCB1.
Figure 7.
Expression changes and correlations in the AA metabolism PPIN from the GSE24931 dataset of esophageal adenocarcinoma (EAC). A. Fold change in the AA metabolism Full-PPIN of EAC. B, C. Expression correlation of proteins in the compact-PPIN for normal esophageal tissue and EAC, respectively. D, E. Expression correlation of proteins in the compact-PPIN for normal esophageal tissue and EAC, respectively.
Table 3.
Expression correlation pairs in the series of esophageal datasets
| Gene 1 | Gene 2 | Significance correlation coefficient | |||
|---|---|---|---|---|---|
|
| |||||
| GSE9768 (acid treatment) | GSE9768 (DAC treatment) | GSE24931 (adenocarcinoma) | GSE33426 (squamous cell carcinoma) | ||
| ALOX5AP | LTA4H | 0.62 | 0.81 | 0.88 | 0.52 |
| CAV1 | CDC37 | 0.98 | 0.73 | 0.86 | 0.58 |
| ELAVL1 | VCP | 0.89 | 0.95 | 0.90 | 0.58 |
| LTA4H | NUCB1 | 0.96 | 0.89 | 0.99 | 0.56 |
| PSEN1 | RELA | 0.94 | 0.94 | 0.65 | 0.57 |
| PTGES | VCP | 0.94 | 0.60 | 0.97 | 0.68 |
DNA mutations in AA metabolism enzyme genes in esophageal cancers
Since many studies have indicated that, except for expression levels, single nucleotide polymorphisms (SNPs) of key AA metabolism enzymes critically influence function or risk in esophageal cancer (summarized in Supplementary Table 2) [28-31]. Four datasets from the cBioportal database were used to determine the mutation rates of these AA metabolism enzymes in esophageal cancer. A total of 562 clinical cases were subjected to whole genome DNA sequencing. Among these datasets, the mutation percentages for these key enzyme genes are rather low, less than 3% (Supplementary Figures 3, 4, 5, 6), with many key enzymes not displaying any mutations. These results suggest some mutations correlate with the risk of esophageal cancer, but their expression level might be more crucial for altering AA metabolism, at least based on the current available data.
Survival analyses of key AA metabolism enzymes in ESCC
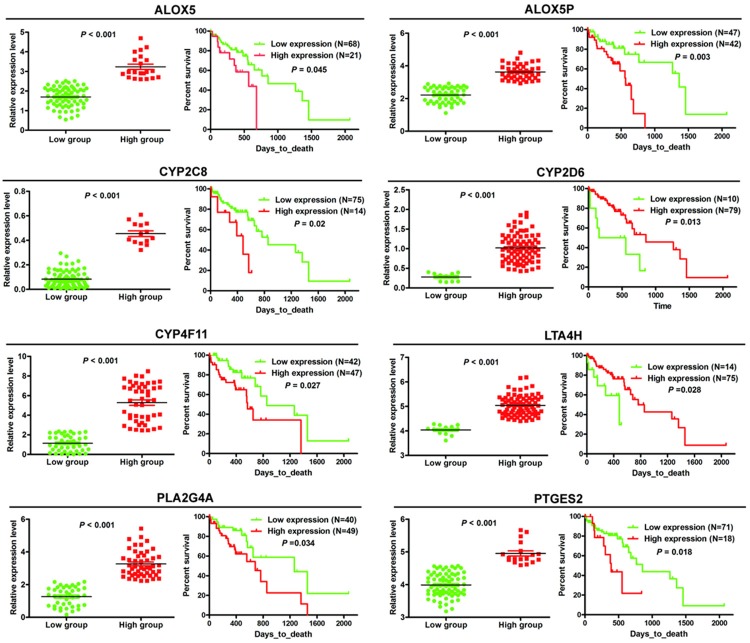
To test the clinical significance of changes in key AA metabolism enzymes in ESCC, we performed survival analyses using publicly available data from TCGA. The results demonstrated a significant correlation between the expression level of 8 enzymes (ALOX5, ALOX5AP, CYP2C8, CYP2D6, CYP4F11, LTA4H, PLA2G4A, PTGES2) and survival time of ESCC patients (Figure 8). ESCC patients with lower expression of ALOX5, ALOX5AP, CYP2C8, CYP4F11, PLA2G4A and PTGES2, or higher LTA4H and CYP2D6 expression had longer survival (Figure 8).
Figure 8.
Expression level of 8 key enzymes significantly correlate with survival of ESCC patients. ESCC patients were divided into two groups according to the expression level of these key enzymes, as optimized by the X-tile program.
Discussion
A wide array of chronic inflammatory conditions pre-dispose susceptible cells to neoplastic transformation. In general, the longer the inflammation persists, the higher the risk of cancer. AA and its metabolites play important role in both physiology and pathology stage of human life. Esophageal cancer is the eighth most common cancer and the sixth most common cause of cancer-related death worldwide, with an estimated 477,900 new cases and 375,000 deaths for 2015 in China [32]. Previous researchers have analyzed the expression level of genes involved in the leukotriene synthesis pathway in normal and pathological tissues [33,34]. These previous studies do not provide a full view of their functional links and how they interact. In this study, we have extended these analyses, by constructing a PPIN based on key AA metabolism enzymes and integrating their expression level and correlation into a network, to show that proteins interacting with many key enzymes should impact the activities of these enzymes in AA metabolism. For example, decreases in ALOX5AP should impede translocation of ALOX5 from the cytoplasm to the cell membrane, thereby inhibiting ALOX5 activation [35]. In the PPIN, we show how AA metabolic enzymes might connect or cross-talk through at least one partner protein, which might serve as switch protein to determine the trend or the orientation of AA and its metabolites. For example, ALOX5AP is also directly linked with LTC4S. It has been reported that ALOX5AP knockdown reduces conversion of LTA4 to LTC4, suggesting a role in the regulation of the activity of LTC4S [36]. The critical role of NF-kB (RELA is one of its units) in inflammation and cancer has been long recognized [37], but the mechanism of how NF-kB regulates AA metabolism has not been studied. In this study, we find NF-kB interacts with both PLA2G4A and ALOX5, which provides important clues to analyze how NF-kB signaling regulation AA metabolism.
Many previous biological networks have focused on static networks, which merely reflect the activities of cellular proteins under one specific condition or at one time point. It has been recognized that cellular systems are highly responsive to environmental cues, and the PPIN in a cell changes under different physiological conditions or at different pathological stages [38]. In this study, we constructed not only the static PPI network for AA metabolism, but also the dynamic network by considering their expression profiles in different kinds of esophageal disease. We found expression of many key enzymes is consistently dysregulated, suggesting that AA metabolism responds to stimulation or environmental changes, as well as their independent role in AA metabolism for substantial promotion in the progression of esophageal disease. ALOX5 is upregulated in most cases of esophageal disease in this study, which catalyzes two steps in the biosynthesis of leukotrienes, lipid mediators of inflammation derived from arachidonic acid. Leukotrienes function in normal host defense, and have roles in many disease states where acute or chronic inflammation is part of the pathophysiology [39]. Changes in protein expression might reduce or increase interactions between proteins, leading to deviation from the normal physiological state. Therefore, dynamic PPIN construction is based on alterations in co-expression, which reflects the dynamics changes of PPIs between different physiological states. Pearson correlation coefficient is a popular correlation method to measure the coexpression of coding genes between each pair of interacting proteins in expression profiles [40]. We not only calculated the Pearson correlation coefficients of paired interacting proteins, but also for each pair of proteins in the network, to illustrate the potential intrinsic correlations for proteins involved in AA metabolism. Interestingly, we found at least six significant pairs of protein-protein correlations in different esophageal diseases. Many studies have focused on polymorphisms of ALOX5AP and LTA4H to identify their susceptibility in various diseases involving inflammation, such as asthma, coronary artery disease, atherosclerosis and cancers [41,42], but their correlation of expression has seldom been investigated. It is reasonable to presume that when a definite number of phospholipids are converted into AA, the amounts of final product (leukotrienes, prostaglandins) are not equal, and would be determined by the expression level (fold-change) of key enzymes, as well as its correlated strength with their interacting proteins. We found ALOX5AP levels significantly correlate with LTA4H, suggesting it might coordinate the activities of both ALOX5 and LTA4H in the production of LTA4. Niphakis et al. found the lipid-binding protein NUCB1 (nucleobindin-1) may facilitate the intracellular transfer of fatty acid amides for delivery to metabolic enzymes, such as FAAH and PTGS2 [43]. A similar mechanism exists for the biosynthesis of leukotrienes, where the non-enzymatic ALOX5AP facilitates transfer of AA to ALOX5. A significant correlation between LTA4H and NUCB1 is uniquely identified in this study, suggesting NUCB1 could positively regulate LTA4H in the biosynthesis of LTA4 [43]. Such dynamic a change in AA metabolism in esophageal disease suggests an intricate control mechanism to allow the timing and amplitude of AA metabolism, responding to be fine-tuned and kept within an appropriate range.
The expression level of 8 key enzymes (ALOX5, ALOX5AP, CYP2C8, CYP4F11, LTA4H, PLA2G4A, CYP2D6, PTGES2) correlates with the survival of ESCC patients. Patients with lower expression of ALOX5, ALOX5AP, CYP2C8, CYP4F11, PLA2G4A and PTGES2, and patients with higher LTA4H and CYP2D6 expression have longer survival. Inhibitors of these enzymes are currently being tested for treatment of diseases involving AA metabolism. Kim et al. found that inhibition of PLA2G4A by AVX235 results in decreased vascularization and perfusion, and subsequent inhibition of tumor growth, suggesting PLA2G4A inhibition may be a potential new therapeutic option for triple-negative, basal-like breast cancer [44]. Nimesulide, a PTGES2 inhibitor, can suppress ESCC cell growth and promote apoptosis, accompanied by a decrease in PGE2 production. The selective ALOX5 inhibitor AA861 has a similar effect and down-regulates LTB4, further indicating that the ALOX5 pathway is also related to ESCC, and may be another promising therapeutic target [45]. Some small molecules could inhibit more than one target in the AA metabolism network. Derivatives of 3-aryl isocoumarin inhibit ALOX5 in vitro and PGE2 production in HeLa cells [46]. The inhibitor BRP-187 prevents ALOX5/ALOX5AP interaction at the nuclear envelope of human leukocytes to inhibit ALOX5 product formation. In vivo, BRP-187 exhibits significant effectiveness in zymosan-induced murine peritonitis, suppressing leukotriene levels in peritoneal exudates, as well as vascular permeability and neutrophil infiltration [47]. These results indicate that the key enzymes might be promising targets in the treatment of various of diseases, from inflammation to cancer. In summary, we constructed an AA metabolism PPI network to explore related enzyme expression patterns in esophageal diseases, indicating their dynamic changes.
Acknowledgements
This work was supported by grants from the National Natural Science Foundation of China (No. 81360331, 81672473 and 81502138), the Science and Technology Program of Guangdong (No. 2014A030310390, No. 2017A030313181), the Department of Education, Guangdong Government under the Top-tier University Development Scheme for Research and Control of Infectious Diseases (2016034).
Disclosure of conflict of interest
None.
Supporting Information
References
- 1.Brash AR. Arachidonic acid as a bioactive molecule. J Clin Invest. 2001;107:1339–1345. doi: 10.1172/JCI13210. [DOI] [PMC free article] [PubMed] [Google Scholar]
- 2.Bapna M, Chauhan LS. The ambidextrous cyclooxygenase: an enduring target. Inflamm Allergy Drug Targets. 2015;13:387–392. doi: 10.2174/1871528114666150401105545. [DOI] [PubMed] [Google Scholar]
- 3.Panigrahy D, Kaipainen A, Greene ER, Huang S. Cytochrome P450-derived eicosanoids: the neglected pathway in cancer. Cancer Metastasis Rev. 2010;29:723–735. doi: 10.1007/s10555-010-9264-x. [DOI] [PMC free article] [PubMed] [Google Scholar]
- 4.Knab LM, Grippo PJ, Bentrem DJ. Involvement of eicosanoids in the pathogenesis of pancreatic cancer: the roles of cyclooxygenase-2 and 5-lipoxygenase. World J Gastroenterol. 2014;20:10729–10739. doi: 10.3748/wjg.v20.i31.10729. [DOI] [PMC free article] [PubMed] [Google Scholar]
- 5.Tuncer S, Banerjee S. Eicosanoid pathway in colorectal cancer: recent updates. World J Gastroenterol. 2015;21:11748–11766. doi: 10.3748/wjg.v21.i41.11748. [DOI] [PMC free article] [PubMed] [Google Scholar]
- 6.Greene ER, Huang S, Serhan CN, Panigrahy D. Regulation of inflammation in cancer by eicosanoids. Prostaglandins Other Lipid Mediat. 2011;96:27–36. doi: 10.1016/j.prostaglandins.2011.08.004. [DOI] [PMC free article] [PubMed] [Google Scholar]
- 7.Zheng Z, He X, Xie C, Hua S, Li J, Wang T, Yao M, Vignarajan S, Teng Y, Hejazi L, Liu B, Dong Q. Targeting cytosolic phospholipase A2α in colorectal cancer cells inhibits constitutively activated protein kinase B (AKT) and cell proliferation. Oncotarget. 2014;5:12304–12316. doi: 10.18632/oncotarget.2639. [DOI] [PMC free article] [PubMed] [Google Scholar]
- 8.Lagorce-Pagès C, Paraf F, Wendum D, Martin A, Fléjou JF. Expression of inflammatory secretory phospholipase A2 and cytosolic phospholipase A2 in premalignant and malignant Barrett’s oesophagus. Virchows Arch. 2004;444:426–435. doi: 10.1007/s00428-004-1003-7. [DOI] [PubMed] [Google Scholar]
- 9.Kim TY, Kim J, Choo HY, Kwon HJ. Inhibition of 5-lipoxygenase suppresses vascular endothelial growth factor-induced angiogenesis in endothelial cells. Biochem Biophys Res Commun. 2016;478:1117–1122. doi: 10.1016/j.bbrc.2016.08.078. [DOI] [PubMed] [Google Scholar]
- 10.Poczobutt JM, Nguyen TT, Hanson D, Li H, Sippel TR, Weiser-Evans MC, Gijon M, Murphy RC, Nemenoff RA. Deletion of 5-lipoxygenase in the tumor microenvironment promotes lung cancer progression and metastasis through regulating T cell recruitment. J Immunol. 2016;196:891–901. doi: 10.4049/jimmunol.1501648. [DOI] [PMC free article] [PubMed] [Google Scholar]
- 11.Paige M, Wang K, Burdick M, Park S, Cha J, Jeffery E, Sherman N, Shim YM. Role of leukotriene A4 hydrolase aminopeptidase in the pathogenesis of emphysema. J Immunol. 2014;192:5059–5068. doi: 10.4049/jimmunol.1400452. [DOI] [PMC free article] [PubMed] [Google Scholar]
- 12.Ekambaram P, Lambiv W, Cazzolli R, Ashton AW, Honn KV. The thromboxane synthase and receptor signaling pathway in cancer: an emerging paradigm in cancer progression and metastasis. Cancer Metastasis Rev. 2011;30:397–408. doi: 10.1007/s10555-011-9297-9. [DOI] [PMC free article] [PubMed] [Google Scholar]
- 13.Panigrahy D, Greene ER, Pozzi A, Wang DW, Zeldin DC. EET signaling in cancer. Cancer Metastasis Rev. 2011;30:525–540. doi: 10.1007/s10555-011-9315-y. [DOI] [PMC free article] [PubMed] [Google Scholar] [Retracted]
- 14.Go RE, Hwang KA, Choi KC. Cytochrome P450 1 family and cancers. J Steroid Biochem Mol Biol. 2015;147:24–30. doi: 10.1016/j.jsbmb.2014.11.003. [DOI] [PubMed] [Google Scholar]
- 15.Moore GY, Pidgeon GP. Cross-talk between cancer cells and the tumour microenvironment: the role of the 5-lipoxygenase pathway. Int J Mol Sci. 2017:18. doi: 10.3390/ijms18020236. [DOI] [PMC free article] [PubMed] [Google Scholar]
- 16.Lotfi Shahreza M, Ghadiri N, Mousavi SR, Varshosaz J, Green JR. A review of network-based approaches to drug repositioning. Brief Bioinform. 2017 doi: 10.1093/bib/bbx017. [Epub ahead of print] [DOI] [PubMed] [Google Scholar]
- 17.Zhang Q, Li J, Xue H, Kong L, Wang Y. Network-based methods for identifying critical pathways of complex diseases: a survey. Mol Biosyst. 2016;12:1082–1089. doi: 10.1039/c5mb00815h. [DOI] [PubMed] [Google Scholar]
- 18.Souza RF. Reflux esophagitis and its role in the pathogenesis of Barrett’s metaplasia. J Gastroenterol. 2017;52:767–776. doi: 10.1007/s00535-017-1342-1. [DOI] [PMC free article] [PubMed] [Google Scholar]
- 19.O’Sullivan KE, Phelan JJ, O’Hanlon C, Lysaght J, O’Sullivan JN, Reynolds JV. The role of inflammation in cancer of the esophagus. Expert Rev Gastroenterol Hepatol. 2014;8:749–760. doi: 10.1586/17474124.2014.913478. [DOI] [PubMed] [Google Scholar]
- 20.Yi S, Lin S, Li Y, Zhao W, Mills GB, Sahni N. Functional variomics and network perturbation: connecting genotype to phenotype in cancer. Nat Rev Genet. 2017;18:395–410. doi: 10.1038/nrg.2017.8. [DOI] [PMC free article] [PubMed] [Google Scholar]
- 21.Su G, Morris JH, Demchak B, Bader GD. Biological network exploration with Cytoscape 3. Curr Protoc Bioinformatics. 2014;47:8.13.1–24. doi: 10.1002/0471250953.bi0813s47. [DOI] [PMC free article] [PubMed] [Google Scholar]
- 22.Bindea G, Galon J, Mlecnik B. CluePedia Cytoscape plugin: pathway insights using integrated experimental and in silico data. Bioinformatics. 2013;29:661–3. doi: 10.1093/bioinformatics/btt019. [DOI] [PMC free article] [PubMed] [Google Scholar]
- 23.Barsky A, Gardy JL, Hancock RE, Munzner T. Cerebral: a Cytoscape plugin for layout of and interaction with biological networks using subcellular localization annotation. Bioinformatics. 2007;23:1040–1042. doi: 10.1093/bioinformatics/btm057. [DOI] [PubMed] [Google Scholar]
- 24.Barrett T, Wilhite SE, Ledoux P, Evangelista C, Kim IF, Tomashevsky M, Marshall KA, Phillippy KH, Sherman PM, Holko M, Yefanov A, Lee H, Zhang N, Robertson CL, Serova N, Davis S, Soboleva A. NCBI GEO: archive for functional genomics data sets--update. Nucleic Acids Res. 2013;41:D991–995. doi: 10.1093/nar/gks1193. [DOI] [PMC free article] [PubMed] [Google Scholar]
- 25.Gao J, Aksoy BA, Dogrusoz U, Dresdner G, Gross B, Sumer SO, Sun Y, Jacobsen A, Sinha R, Larsson E, Cerami E, Sander C, Schultz N. Integrative analysis of complex cancer genomics and clinical profiles using the cBioPortal. Sci Signal. 2013;6:pl1. doi: 10.1126/scisignal.2004088. [DOI] [PMC free article] [PubMed] [Google Scholar]
- 26.Yan W, Shih JH, Rodriguez-Canales J, Tangrea MA, Ylaya K, Hipp J, Player A, Hu N, Goldstein AM, Taylor PR, Emmert-Buck MR, Erickson HS. Identification of unique expression signatures and therapeutic targets in esophageal squamous cell carcinoma. BMC Res Notes. 2012;5:73. doi: 10.1186/1756-0500-5-73. [DOI] [PMC free article] [PubMed] [Google Scholar]
- 27.Quante M, Bhagat G, Abrams JA, Marache F, Good P, Lee MD, Lee Y, Friedman R, Asfaha S, Dubeykovskaya Z, Mahmood U, Figueiredo JL, Kitajewski J, Shawber C, Lightdale CJ, Rustgi AK, Wang TC. Bile acid and inflammation activate gastric cardia stem cells in a mouse model of Barrett-like metaplasia. Cancer Cell. 2012;21:36–51. doi: 10.1016/j.ccr.2011.12.004. [DOI] [PMC free article] [PubMed] [Google Scholar]
- 28.Liu F, Wei WQ, Cormier RT, Zhang ST, Qiao YL, Li XQ, Zhu ST, Zhai YC, Peng XX, Yan YX, Wu LJ, He D, He Y. Association of single nucleotide polymorphisms in the prostaglandin-endoperoxide synthase 2 (PTGS2) and phospholipase A2 group IIA (PLA2G2A) genes with susceptibility to esophageal squamous cell carcinoma. Asian Pac J Cancer Prev. 2014;15:1797–1802. doi: 10.7314/apjcp.2014.15.4.1797. [DOI] [PubMed] [Google Scholar]
- 29.Zhu W, Wei BB, Shan X, Liu P. -765G>C and 8473T>C polymorphisms of COX-2 and cancer risk: a meta-analysis based on 33 case-control studies. Mol Biol Rep. 2010;37:277–288. doi: 10.1007/s11033-009-9685-1. [DOI] [PubMed] [Google Scholar]
- 30.Zhao D, Zhang X, Guo Y, Tan W, Lin D. Cyclooxygenase-2 Gly587Arg variant is associated with differential enzymatic activity and risk of esophageal squamous-cell carcinoma. Mol Carcinog. 2009;48:934–941. doi: 10.1002/mc.20543. [DOI] [PubMed] [Google Scholar]
- 31.Guo Y, Zhang X, Tan W, Miao X, Sun T, Zhao D, Lin D. Platelet 12-lipoxygenase Arg261Gln polymorphism: functional characterization and association with risk of esophageal squamous cell carcinoma in combination with COX-2 polymorphisms. Pharmacogenet Genomics. 2007;17:197–205. doi: 10.1097/FPC.0b013e328010bda1. [DOI] [PubMed] [Google Scholar]
- 32.Chen W, Zheng R, Zeng H, Zhang S, He J. Cancer statistics in China, 2015. CA Cancer J Clin. 2016;66:115–132. doi: 10.3322/caac.21338. [DOI] [PubMed] [Google Scholar]
- 33.Xia W, Xie L, Cao B, Cheng S, Wan H, Liu H. Genes involved in leukotriene synthesis pathway are dynamically regulated during lung development in Rhesus monkeys. Prostaglandins Leukot Essent Fatty Acids. 2017;122:1–6. doi: 10.1016/j.plefa.2017.06.008. [DOI] [PubMed] [Google Scholar]
- 34.Alkhamees OA, Alroujayee AS, Abuohashish HM, Alrojayee FS, Ahmed MM. Possible involvement of the lipoxygenase and leukotriene signaling pathways in cisplatin-mediated renal toxicity. Cancer Chemother Pharmacol. 2017;80:55–64. doi: 10.1007/s00280-017-3331-8. [DOI] [PubMed] [Google Scholar]
- 35.Häfner AK, Gerstmeier J, Hörnig M, George S, Ball AK, Schröder M, Garscha U, Werz O, Steinhilber D. Characterization of the interaction of human 5-lipoxygenase with its activating protein FLAP. Biochim Biophys Acta. 2015;1851:1465–1472. doi: 10.1016/j.bbalip.2015.08.010. [DOI] [PubMed] [Google Scholar]
- 36.Basavarajappa D, Wan M, Lukic A, Steinhilber D, Samuelsson B, Rådmark O. Roles of coactosin-like protein (CLP) and 5-lipoxygenase-activating protein (FLAP) in cellular leukotriene biosynthesis. Proc Natl Acad Sci U S A. 2014;111:11371–11376. doi: 10.1073/pnas.1410983111. [DOI] [PMC free article] [PubMed] [Google Scholar]
- 37.Xia Y, Shen S, Verma IM. NF-κB, an active player in human cancers. Cancer Immunol Res. 2014;2:823–830. doi: 10.1158/2326-6066.CIR-14-0112. [DOI] [PMC free article] [PubMed] [Google Scholar]
- 38.Chen B, Fan W, Liu J, Wu FX. Identifying protein complexes and functional modules--from static PPI networks to dynamic PPI networks. Brief Bioinform. 2014;15:177–194. doi: 10.1093/bib/bbt039. [DOI] [PubMed] [Google Scholar]
- 39.Rådmark O, Werz O, Steinhilber D, Samuelsson B. 5-Lipoxygenase, a key enzyme for leukotriene biosynthesis in health and disease. Biochim Biophys Acta. 2015;1851:331–339. doi: 10.1016/j.bbalip.2014.08.012. [DOI] [PubMed] [Google Scholar]
- 40.Wang J, Peng X, Peng W, Wu FX. Dynamic protein interaction network construction and applications. Proteomics. 2014;14:338–352. doi: 10.1002/pmic.201300257. [DOI] [PubMed] [Google Scholar]
- 41.Merhi M, Demirdjian S, Hariri E, Sabbah N, Youhanna S, Ghassibe-Sabbagh M, Naoum J, Haber M, Othman R, Kibbani S, Chammas E, Kanbar R, Bayeh HE, Chami Y, Abchee A, Platt DE, Zalloua P, Khazen G. Impact of inflammation, gene variants, and cigarette smoking on coronary artery disease risk. Inflamm Res. 2015;64:415–422. doi: 10.1007/s00011-015-0821-1. [DOI] [PubMed] [Google Scholar]
- 42.Amirian ES, Ittmann MM, Scheurer ME. Associations between arachidonic acid metabolism gene polymorphisms and prostate cancer risk. Prostate. 2011;71:1382–1389. doi: 10.1002/pros.21354. [DOI] [PMC free article] [PubMed] [Google Scholar]
- 43.Niphakis MJ, Lum KM, Cognetta AB 3rd, Correia BE, Ichu TA, Olucha J, Brown SJ, Kundu S, Piscitelli F, Rosen H, Cravatt BF. A global map of lipid-binding proteins and their ligandability in cells. Cell. 2015;161:1668–1680. doi: 10.1016/j.cell.2015.05.045. [DOI] [PMC free article] [PubMed] [Google Scholar]
- 44.Kim E, Tunset HM, Cebulla J, Vettukattil R, Helgesen H, Feuerherm AJ, Engebraten O, Malandsmo GM, Johansen B, Moestue SA. Anti-vascular effects of the cytosolic phospholipase A2 inhibitor AVX235 in a patient-derived basal-like breast cancer model. BMC Cancer. 2016;16:191. doi: 10.1186/s12885-016-2225-1. [DOI] [PMC free article] [PubMed] [Google Scholar]
- 45.Shi HY, Lv FJ, Zhu ST, Wang QG, Zhang ST. Dual inhibition of 5-LOX and COX-2 suppresses esophageal squamous cell carcinoma. Cancer Lett. 2011;309:19–26. doi: 10.1016/j.canlet.2011.05.010. [DOI] [PubMed] [Google Scholar]
- 46.Ramanan M, Sinha S, Sudarshan K, Aidhen IS, Doble M. Inhibition of the enzymes in the leukotriene and prostaglandin pathways in inflammation by 3-aryl isocoumarins. Eur J Med Chem. 2016;124:428–434. doi: 10.1016/j.ejmech.2016.08.066. [DOI] [PubMed] [Google Scholar]
- 47.Garscha U, Voelker S, Pace S, Gerstmeier J, Emini B, Liening S, Rossi A, Weinigel C, Rummler S, Schubert US, Scriba GK, Çelikoğlu E, Çalışkan B, Banoglu E, Sautebin L, Werz O. BRP-187: A potent inhibitor of leukotriene biosynthesis that acts through impeding the dynamic 5-lipoxygenase/5-lipoxygenase-activating protein (FLAP) complex assembly. Biochem Pharmacol. 2016;119:17–26. doi: 10.1016/j.bcp.2016.08.023. [DOI] [PubMed] [Google Scholar]
Associated Data
This section collects any data citations, data availability statements, or supplementary materials included in this article.


