

Abstract
Background
The aim of this study was to investigate the association between plasma levels of homocysteine and the occurrence and progression of rectal cancer.
Material/Methods
The 320 study participants included healthy controls (n=80). and patients with rectal tumors (n=240), including 155 patients with rectal cancer, Stage I (n=32), Stage II (n=38), Stage III (n=50), and Stage IV (n=35), and patients with low-risk rectal adenomas (n=31), and high-risk rectal adenomas (n=54). All study participants had fasting blood samples taken, and plasma levels of homocysteine and carcinoembryonic antigen (CEA) were measured and compared. Receiver operating characteristic (ROC) curves were prepared to determine whether single, combined, or series levels of the two markers were diagnostic.
Results
A significantly increasing trend in the plasma levels of homocysteine from the healthy controls, to the individuals with low-risk rectal adenoma, high-risk rectal adenoma, and Stage I–IV rectal cancer were found. There were no statistically significant differences in the area under the curve (AUC) between the two single factors of plasma homocysteine and CEA. The AUC showed that the use of combined or parallel measurement of plasma CEA and homocysteine had the greatest diagnostic associations.
Conclusions
Plasma levels of homocysteine were significantly associated with occurrence and progression of rectal cancer. The combined use of measurement of plasma homocysteine and CEA levels might have the potential to increase the diagnostic efficiency of screening for early rectal cancer.
MeSH Keywords: Carcinoembryonic Antigen, Homocysteine, Rectal Neoplasms
Background
Worldwide, colorectal cancer is the second most common form of cancer diagnosed in women and the third most common cancer in men [1]. Although the incidence and mortality rates of this type of cancer are now declining due to the development of novel diagnostic methods and treatments, early-stage rectal cancer is still difficult to diagnose [2–5]. Colonoscopy, followed by biopsy and histopathology, are considered to be the gold standard for the diagnosis of rectal cancer. However, these invasive techniques are painful for patients, and the quality of the results can depend on the ability and experience of the endoscopist [6]. Diagnostic or prognostic biomarkers can be detected in the blood samples that are routinely obtained in the clinic and in hospital, and venepuncture for blood sampling is a less invasive procedure for the detection of diagnostic or prognostic biomarkers that may be associated with the presence of rectal cancer [7,8]. Currently, there are several non-specific serum and plasma tumor markers, including carcinoembryonic antigen (CEA) and carbohydrate antigen 19-9 (CA19-9), which have been widely used in the diagnosis and post-treatment follow-up of patients with gastric cancer [9]. CEA is also the most commonly used serum and plasma marker for tumors of the gastrointestinal tract. However, both CA19-9 and CEA have been shown to have low sensitivity and low specificity as cancer biomarkers [9].
Methylation of regulatory portions of tumor suppressor genes is a common feature of human cancers [10,11]. There is evidence to support that the process of carcinogenesis of rectal tumors might be initiated by the activation of proto-oncogenes by hypomethylation or hypermethylation of their promoter regions, or through inactivation of tumor-suppressor genes by hypermethylation [12]. Homocysteine was chosen for this study based the findings from previously published studies that have shown that increased plasma homocysteine levels were associated with in vitro cell proliferation rates in a variety of tumor types [13,14], as well as with oxidative damage to cells [15].
Hyperhomocysteinemia can increase the overproduction of oxygen free radicals through homocysteine oxidation and can inhibit DNA methylation in tissues through a simultaneous increase in intracellular S-adenosyl-L-homocysteine (SAH) [16,17]. Therefore, on the basis of previously published studies, there is support for the potential role of detection of increased levels of homocysteine in some cancers, including rectal cancer, with the possible a correlation between plasma levels of homocysteine and occurrence and progression of rectal cancer.
The association between plasma homocysteine level and the occurrence and progression of rectal cancer is a recent topic of interest a previously published study has proposed homocysteine as a new tumor marker since it reflects the proliferation rate of tumor cells and also tumor cell death [17]. Therefore, the aim of this study was to investigate the association between plasma levels of homocysteine, and the more commonly used plasma biomarker, CEA, and the occurrence and progression of rectal cancer.
Material and Methods
Subjects studied
A controlled clinical study was conducted between May 2015 and June 2017. The study participants were recruited from the Department of Gastroenterology, Department of General Surgery, Department of Oncology, and the Physical Examination Centre of Qilu Hospital, a teaching hospital of Shandong University in Shandong, China.
The study included patients with rectal adenomas, as these are known to be the precursors of most large bowel cancers [18–21]. Colorectal adenomas are classified as low-risk and high-risk adenomatous polyps based on the NCCN 2017 guidelines. In the 2017 edition of the NCCN guidelines, the tumor diameter greater than 1cm, or high grade dysplasia called advanced adenoma, defined as follows: polyps or lesion diameter greater than 10 mm; villous adenoma, villous adenoma or mixed structure >25%; with high grade intraepithelial neoplasia; one of the above 3 conditions then the diagnosis of high-risk adenoma. Rectal cancer can be divided into four stages based on results of preoperative examinations, including imaging, and on postoperative pathology, including the examination of lymph nodes. In this study, rectal cancer was staged as Stage I–IV, according to the tumor, node, metastasis (TNM) staging system of the International Union Against Cancer (UICC) [22].
The 320 study participants included healthy controls (n=80). and patients with rectal tumors (n=240), including 155 patients with rectal cancer, Stage I (n=32), Stage II (n=38), Stage III (n=50), and Stage IV (n=35), and patients with low-risk rectal adenomas (n=31), and high-risk rectal adenomas (n=54). All study participants provided written informed consent before being enrolled into the study.
Study inclusion and exclusion criteria
All participants included in the study had no history of heart disease, renal impairment (normal serum creatinine and aspartate aminotransferase), respiratory disorders, liver disease (normal glutamic oxaloacetic transaminase or glutamic pyruvate transaminase >40 IU/L), diabetes mellitus (antidiabetic drug history or fasting plasma glucose concentration ≥7.0 mmol/l or 2-hour post-prandial plasma glucose ≥11.1 mmol/l), no gastrointestinal disorders, cancer and metabolic diseases. Study participants had normal blood chemistry results and no weight change exceeding ±4 kg within the previous year. Women who were pregnant or who were breastfeeding were excluded from the study. Participants were excluded if they had a history of cardiovascular or cerebrovascular disease, endocrine disease, any other malignancies, renal disease, hepatic insufficiency, current intake of any medication that could potentially influence the concentration of homocysteine, including treatment with H2 antagonists, proton pump inhibitors, metformin, phenytoin, or methotrexate.
Data collection
The age and gender of all study participants were recorded. Fasting venous blood samples were drawn and collected in vacutainer tubes. These blood samples underwent an enzymatic cycling assay and electrochemiluminescence, which measured the level of homocysteine and carcinoembryonic antigen (CEA) in the plasma. These plasma assays were performed, and the results were provided, by the Department of Laboratory Medicine at Qilu Hospital, affiliated with Shandong University. The concentration of plasma homocysteine was determined using an enzymatic cycling assay on an automatic immunity biochemical analyzer (Roche Cobas 8000) (Roche Diagnostics GmbH, Mannheim, Germany) using reagents and calibrators (Beijing Strong Biotechnologies, Inc., China). The concentration of CEA was determined using an electrochemiluminescence automatic immunoassay system (Roche Cobas e601) (Roche Diagnostics GmbH, Mannheim, Germany) using reagents and calibrators (Beijing Strong Biotechnologies, Inc., China).
The normal laboratory range for plasma homocysteine was 0–14 μmol/l, and hyperhomocysteinemia was defined as a homocysteine concentration ≥14 μmol/l [23]. The laboratory normal range for plasma CEA was 0–5 ng/ml.
Statistical analysis
All experimental data were analyzed using SPSS software version 22.0 (SPSS Inc., Chicago, IL, USA) and the statistical software package available for Windows, R-3.3.2. Data for plasma homocysteine and age were presented as the mean ± standard deviation (SD). Differences between the two groups, plasma homocysteine and CEA, were assessed using a t-test. Differences between multiple groups were assessed using analysis of variance (ANOVA). Differences between two adjacent groups were analyzed using the least significant difference (LSD) method. Logistic regression analysis was used to analyze the trend in P-values. Study participant gender was presented by percentage, and their differences were assessed using the chi-squared test (χ2 test). A statistically significant difference was considered to be P<0.05.
Results
The association between plasma homocysteine levels and the occurrence of rectal cancer
Table 1 shows the association between plasma homocysteine levels and the occurrence of rectal cancer, compared with the healthy control individuals. Study participants with rectal tumors had significantly increased levels of plasma homocysteine compared with the healthy controls (P<0.05). Further comparisons were made in plasma homocysteine levels, including between the two groups of patients with rectal adenoma and rectal cancer; between the three groups of patients that included healthy controls, patients with rectal adenoma and with rectal cancer (Table 2). Study participants with rectal cancer had significantly increased levels of homocysteine compared with patients with rectal adenoma (P<0.05) and compared with healthy controls (P<0.05).
Table 1.
Age, gender, and plasma homocysteine levels in the two groups studied, including the healthy controls, cases of rectal tumor.
| Characteristics | Healthy (n=80) | Tumor (n=240) | Chi square value/t value | p Value |
|---|---|---|---|---|
| Gender | 0.282 | 0.595 | ||
| No. of male (%) | 47 (23.7) | 151 (76.3) | ||
| No. of female (%) | 33 (27.0) | 89 (73.0) | ||
| Age (yr) | 51.18±12.53 | 57.05±11.77 | 3.681 | <0.001 |
| Hcy (μmol/L) | 11.17±2.67 | 15.77±4.92 | 10.582 | <0.001 |
Values with a different superscript letter have statistically significant differences between the groups. P<0.05.
Table 2.
Age, gender, and plasma homocysteine levels in the three groups studied, including the healthy controls, cases of rectal adenoma, and rectal cancer.
| Characteristics | Healthy (n=80) | Adenoma (n=85) | Cancer (n=155) | Chi square value/ t value | p Value |
|---|---|---|---|---|---|
| Gender | 0.916 | 0.632 | |||
| No. of male (%) | 47 (23.7) | 51 (25.8) | 100 (50.5) | ||
| No. of female(%) | 33 (27.0) | 34 (27.9) | 55 (45.1) | ||
| Age (yr) | 51.19±12.53 | 55.02±10.88 | 58.17±12.12 | 9.188 | <0.001 |
| Hcy (μmol/L) | 11.17±2.67a | 13.66±3.35b | 16.93±5.25c | 51.304 | <0.001 |
Values with a different superscript letter (a, b, c) have statistically significant differences between the groups. P<0.05.
Study participants included normal control subjects, and patients with rectal adenoma were divided into two groups that included patients with low-risk adenomas and patients with high-risk adenomas. Patients with rectal cancer were divided into four groups, Stage I–IV. Plasma homocysteine levels of these seven groups were compared, and the results are shown in Table 3. Patients with Stage I rectal cancer had significantly increased levels of homocysteine compared with healthy controls (P<0.05). The results shown in Table 2 and Table 3 were consistent with those shown in Table 1.
Table 3.
Age, gender, and plasma homocysteine levels in healthy controls and patients with rectal adenoma (low-risk and high-risk) and rectal cancer (Stage I–IV).
| Characteristics | Healthy (n=80) | Low-risk (n=31) | High-risk (n=54) | Stage I (n=32) | Stage II (n=38) | Stage III (n=50) | Stage IV (n=35) | Chi square value/ t value | p Value |
|---|---|---|---|---|---|---|---|---|---|
| Gender | 1.403 | 0.966 | |||||||
| No. of male (%) | 47 (23.7) | 19 (9.6) | 32 (16.2) | 19 (9.6) | 25 (12.6) | 33 (16.7) | 23 (11.6) | ||
| No. of female (%) | 33 (27.0) | 12 (9.8) | 22 (18.0) | 13 (10.7) | 13 (10.7) | 17 (13.9) | 12 (9.8) | ||
| Age (yr) | 51.19 ±12.53 | 56.58 ±11.73 | 54.13 ±10.37 | 57.03 ±10.21 | 60.50 ±13.23 | 57.40 ±12.05 | 57.77 ±12.76 | 3.521 | 0.002 |
| Hcy (μmol/L) | 11.17 ±2.67a | 13.12 ±3.25b | 13.97 ±3.40b | 14.45 ±4.65b | 16.64 ±4.70c,d | 17.19 ±5.47d | 19.15 ±5.21e | 21.893 | <0.001 |
Values with a different superscript letter (a, b, c, d, e) have statistically significant differences between the groups. P<0.05.
The findings of these results indicated that increased levels of plasma homocysteine were significantly associated with the occurence of rectal cancer. The findings showed that the optimal, or critical, value for the plasma homocysteine level that distinguished between patients with rectal lesions and healthy controls was 14.45 μmol/l; the optimal, or critical, value for the plasma homocysteine level that distinguished between patients with rectal cancer and rectal adenoma was 15.4 μmol/l (Figures 1, 2; Tables 4, 5). In this study, a plasma homocysteine concentration ≥14 μmol/l was used to define hyperhomocysteinemia [24]. Therefore, the findings of this study showed that hyperhomocysteinemia was significantly associated with the occurrence of rectal cancer.
Figure 1.
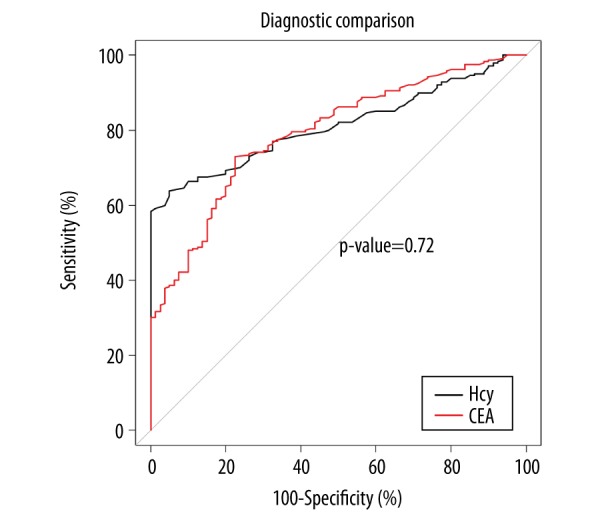
Receiver operating characteristic (ROC) curve of plasma levels of homocysteine and carcinoembryonic antigen (CEA) between the healthy controls and the groups of patients with rectal tumors (rectal adenoma and rectal cancer). There were no statistically significant differences in the area under the curve (AUC) between plasma homocysteine and carcinoembryonic antigen (CEA) (p=0.72). Additional parameters, including the optimal critical value, the 95% confidence interval (CI), specificity, and sensitivity, are presented in Table 4.
Figure 2.
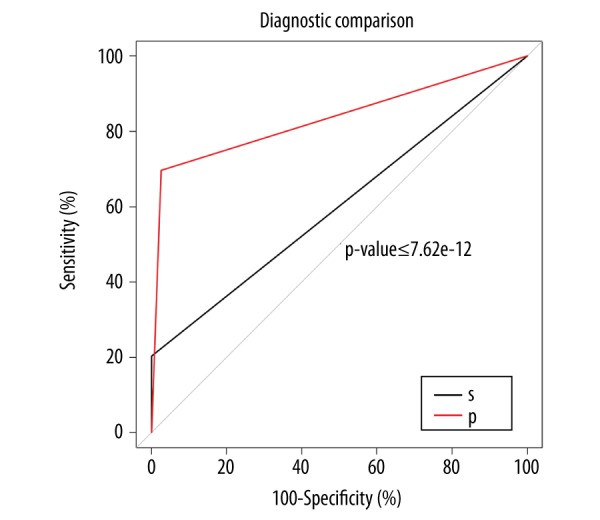
Diagnostic efficiency of detection of combined plasma homocysteine and carcinoembryonic antigen (CEA) levels between the healthy controls and the groups of patients with rectal tumors (rectal adenoma and rectal cancer). S – series diagnosis. Plasma homocysteine ≥14.45 μmol/l and carcinoembryonic antigen (CEA) ≥5 ng/ml were associated with the presence of rectal tumors. P – parallel diagnosis. Plasma homocysteine ≥14.45 μmol/l or CEA ≥5 ng/ml were associated with the presence of rectal tumors. The area under the curve (AUC) for parallel diagnosis was greater than the series diagnosis. Additional parameters, including the optimal critical value, the 95% confidence interval (CI), specificity, and sensitivity, are presented in Table 4.
Table 4.
The parameters of the diagnostic methods between rectal tumors and healthy controls: the content of this table is supplemental data to Figure 1 and Figure 2.
| Parameters | Hcy | CEA | Parallel diagnosis | Series diagnosis |
|---|---|---|---|---|
| AUC | 0.707 | 0.688 | 0.711 | 0.518 |
| Optimal critical value | 14.45 mmol/l | 1.45 ng/ml | 0.50 | 0.50 |
| 95% CI | 0.627–0.787 | 0.606–0.769 | 0.655–0.767 | 0.498–0.537 |
| Specificity (%) | 98.75 | 77.50 | 97.50 | 100 |
| Sensitivity (%) | 43.53 | 60.00 | 44.71 | 3.53 |
Table 5.
The parameters of the diagnostic methods between rectal cancer and rectal adenoma: the content of this table is supplemental data to Figure 3 and Figure 4.
| Parameters | Hcy | CEA | Parallel diagnosis | Series diagnosis |
|---|---|---|---|---|
| AUC | 0.701 | 0.754 | 0.743 | 0.617 |
| Optimal critical value | 15.40 mmol/l | 3.93 ng/ml | 0.50 | 0.50 |
| 95% CI | 0.635–0.768 | 0.694–0.814 | 0.684–0.801 | 0.579–0.655 |
| Specificity (%) | 74.11 | 91.76 | 97.65 | 71.76 |
| Sensitivity (%) | 57.42 | 54.83 | 25.81 | 76.77 |
The association between plasma homocysteine levels and the progression of rectal cancer
The plasma levels of homocysteine between the three groups (healthy controls, rectal adenoma and rectal cancer) were compared (Table 2). There was a significant and increasing trend of plasma homocysteine levels between the three groups (P<0.001, with a significant overall trend (P<0.001). These findings supported an association between plasma homocysteine levels and progression of rectal cancer from normal, to rectal adenoma, to rectal cancer. To verify this finding, further comparisons were made between the seven groups of individuals studied (the healthy controls, patients with low-risk and high-risk adenomas, and patients with Stage I–IV rectal cancer) (Table 3). Comparison of the plasma homocysteine levels in the seven groups showed a significantly increasing trend (P<0.001) from normal control subjects, to patients with low-risk and high-risk adenomas, and to patients with Stage I–IV rectal cancer.
Plasma homocysteine and carcinoembryonic antigen (CEA) levels and the detection of rectal cancer
To analyze whether the measurement of plasma homocysteine had potential diagnostic value in screening patients for rectal cancer, the receiver operating characteristic (ROC) curves were prepared and used in two scenarios, between the individuals with rectal tumor and the healthy controls (Figures 1, 2), and between the patient groups with rectal cancer and rectal adenoma (Figures 3, 4). In the former, the ROC curve was used determine single factor diagnostic association, for carcinoembryonic antigen (CEA) or homocysteine. There were no statistically significant differences in area under the curve (AUC) between the two single factors of plasma homocysteine and CEA, which were 0.707 and 0.688, respectively.
Figure 3.
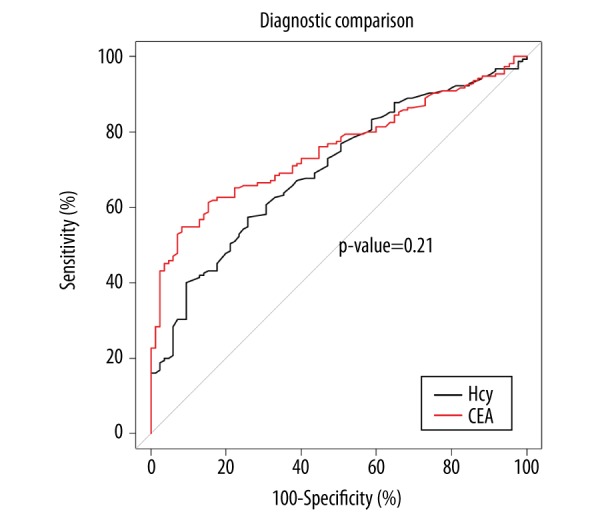
Receiver operating characteristic (ROC) curve of homocysteine and carcinoembryonic antigen (CEA) levels between the patient groups with rectal cancer and rectal adenoma. There were no statistically significant differences in the area under the curve (AUC) between plasma levels of homocysteine and carcinoembryonic antigen (CEA) (p=0.21). Additional parameters, including the optimal critical value, the 95% confidence interval (CI), specificity, and sensitivity, are presented in Table 5.
Figure 4.
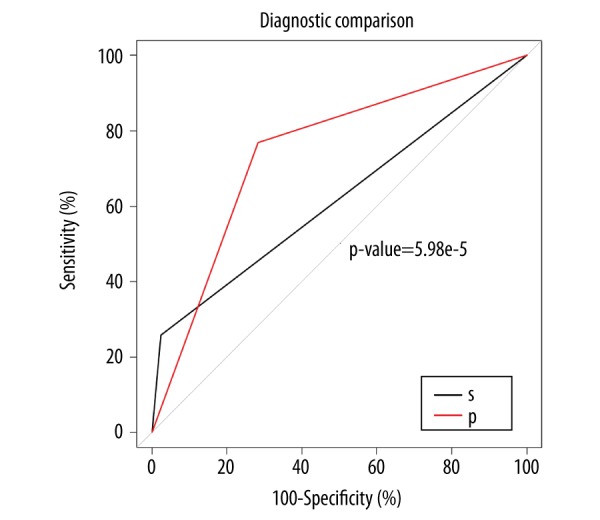
Diagnostic efficiency of the combination of plasma homocysteine and carcinoembryonic antigen (CEA) levels between the patient groups with rectal cancer and rectal adenoma S – series diagnosis. Plasma homocysteine ≥15.40 μmol/l and carcinoembryonic antigen (CEA) ≥5 ng/ml were associated with the presence of rectal cancer. P – parallel diagnosis. Plasma homocysteine ≥15.40 μmol/l or CEA ≥5 ng/ml were associated with the presence of rectal cancer. The area under the curve (AUC) for parallel diagnosis was greater than the series diagnosis. Additional parameters, including the optimal critical value, the 95% confidence interval (CI), specificity, and sensitivity, are presented in Table 5.
Additional parameters were assessed for the diagnostic associations of plasma homocysteine and CEA, including the optimal critical value (14.45 mmol/l and 1.45 ng/ml, respectively), with the 95% confidence interval (CI), specificity, and sensitivity shown in Table 4. There were no statistically significant differences in the AUC between the two kinds of single factor markers, plasma homocysteine and CEA (P>0.05). These results might indicate that both biomarkers, homocysteine and CEA, had the same diagnostic value in screening for rectal tumor.
To further investigate the study findings on the value of the combined biomarkers, homocysteine and CEA, their parallel use in diagnosis and series diagnosis were analyzed, with the findings shown in Figure 2. From this analysis, a plasma level of CEA ≥5 ng/ml was associated with the presence of a rectal lesion, including rectal cancer. When combining plasma homocysteine and CEA levels to make the parallel diagnosis, plasma homocysteine ≥14.45 μmol/l, or CEA ≥5 ng/ml were associated with the presence of rectal tumor, and the AUC was 0.711. When combining homocysteine and CEA values to make the series diagnosis, plasma homocysteine levels ≥14.45 μmol/l, and plasma CEA levels ≥5 ng/ml were associated with as rectal tumor, and the AUC was 0.518. The AUC of parallel diagnosis was greater compared with the other forms of series diagnosis. In the latter, te AUC of plasma homocysteine and plasma CEA levels were 0.701 and 0.754, respectively.
Additional parameters for homocysteine and CEA levels were included the optimal critical value (15.40 mmol/l and 3.93 ng/ml, respectively), with the 95% CI, specificity, sensitivity, shown in Table 5. There were no statistically significant differences in the AUC between two kinds of single factor plasma marker (P>0.05). When combining plasma homocysteine and CEA levels to make the parallel diagnosis, plasma homocysteine ≥15.40 μmol/l or plasma CEA ≥5 ng/ml were associated with the presence of rectal cancer, and the AUC was 0.743. When combining plasma homocysteine and CEA levels to make the series diagnosis, plasma homocysteine ≥15.40 μmol/l and plasma CEA ≥5 ng/ml were associated with the presence of rectal cancer, and the AUC was 0.617, as shown in Figure 4. The AUC of the parallel plasma marker diagnosis was greater than the series diagnosis.
Discussion
Homocysteine is an intermediate compound required in the trans-sulfuration synthesis pathway of cysteine from methionine. Methionine synthase is encoded by the MTR gene and catalyzes the remethylation of homocysteine to methionine to maintain adequate intercellular folate levels, required for DNA synthesis, methylation, and homeostasis [29]. Although the association between plasma levels of homocysteine and the development of rectal cancer has been previously studied, the findings of previously published studies have been inconsistent and inconclusive, with some study findings showing a significant association [24,25], while other studies showed no association [26–28]. Therefore, the aim of this study was to investigate the association between plasma levels of homocysteine and the occurrence and progression of rectal cancer. The study included seven study groups, normal control subjects, patients with low-risk and high-risk adenomas, and patients with Stage I–IV rectal cancer. The findings of this study showed that plasma levels of homocysteine were significantly associated with occurrence and progression of rectal cancer, but the combined use of measurement of plasma homocysteine and CEA levels were more significantly associated with this progression.
In the present study, the results of the plasma homocysteine levels, when compared in each group studied are presented in Tables 1–3. The findings of increasing release of homocysteine into the plasma in patients with rectal tumor (adenoma and rectal cancer) might be explained as being due to impaired metabolic function, poor nutrition or inadequate absorption, particularly of folic acid, which affects the methionine cycle. Furthermore, due to the rapid proliferation of tumor cells, more folic acid and vitamin B12 might be consumed, resulting in reduced concentrations of folic acid and vitamin B12, which further affects the metabolism of homocysteine and increases the levels of homocysteine in plasma. Previously published studies have indicated that the increase in plasma levels of homocysteine was not only related to a decrease in folate and vitamin B12, but also to the methionine-dependent proliferation rate of cancer cells in tumors of the gastrointestinal system [30]. A recently published meta-analysis of epidemiological studies indicated a relationship between homocysteine and rectal cancer, but these findings are difficult to interpret due to the very large degree of heterogeneity across studies (OR, 1.40; 95% CI, 1.19–1.66) [31]. Also, there are many potential confounding factors for any clinical study on rectal cancer, including patient age, gender, total cholesterol levels, blood pressure, creatinine, and smoking, which might be associated with elevated levels of plasma homocysteine. In the present study, although study participants were recruited according to strict inclusion and exclusion criteria to rule out the possible influences of those confounding factors on the relationship between plasma homocysteine levels and rectal cancer.
This study had several limitations, including the relatively small number of subjects in each group of study participants, which might have been a confounding factor in the results. For example, the study results presented in Table 3 showed that there are no statistically significant differences in plasma homocysteine levels between some of the groups, including patients with Stage II and III rectal cancer, between Stage I rectal cancer and high-risk rectal adenoma, and between Stage I rectal cancer and low-risk rectal adenoma. The trend of statistical significance between the groups in the seven groups studied (normal control subjects, patients with low-risk and high-risk adenomas, and patients with Stage I–IV rectal cancer) was not clear (P>0.05). Also, this study was designed as a case-controlled study, and it was only possible to observe the relationship between plasma homocysteine levels and rectal cancer at a single point in time. Therefore, the long-term effects on plasma homocysteine levels in these study participants was not assessed in this study.
Currently, the most commonly used diagnostic plasma biomarkers for rectal cancer rectal cancer markers are CEA and carbohydrate antigen 19-9 (CA19-9), even though they have low sensitivity and specificity in screening for early rectal cancer [31,32]. Some studies have suggested that the sensitivity and specificity of CEA are 68.60% and 59.30%, respectively and CA19-9 has been reported to have a sensitivity of 55.90% and a specificity of 60.50% [33]. In this study, the comparative results using area under the curve (AUC) analysis in four types of diagnostic approach are shown in Figures 1–4, and in Table 5. These results suggest that both plasma biomarkers, homocysteine and CEA, had the same diagnostic value in screening for rectal cancer. The implications of these findings are that the use of the combination of homocysteine and CEA might increase the diagnostic efficiency of screening patients for early rectal cancer. However, the findings from this preliminary study require further investigation using large-scale, controlled studies.
Conclusions
The findings of this study showed that plasma levels of homocysteine were significantly associated with occurrence and progression of rectal cancer and that the combined use of measurement of plasma homocysteine and carcinoembryonic antigen (CEA) levels might have the potential to increase the diagnostic efficiency of screening for early rectal cancer. Also, these results might provide a new approach to screening for early rectal cancer using routine blood samples. Future, large-scale, controlled, multicenter studies are required to validate the findings of this preliminary study. Also, further studies on the role of homocysteine in carcinogenesis of tumors of the gastrointestinal tract might improve the understanding of the mechanisms underlying the development and progression of rectal cancer.
Footnotes
Source of support: Grants from the National Natural Science Foundation of China (Grant No. 81471020), Shandong Medical and Health Technology Development Project (Grant No. 2014WS0148), and Shandong University Basic Scientific Research Funding (Qilu Hospital Clinical Research Project) (Grant No. 2014QLKY21) to Dr. Kexin Wang
Conflict of interests
None.
References
- 1.Jemal A, Bray F, Center MM, et al. Global cancer statistics. Cancer J Clin. 2011;61:69–90. doi: 10.3322/caac.20107. [DOI] [PubMed] [Google Scholar]
- 2.Li T, Mo X, Fu L, et al. Molecular mechanisms of long noncoding RNAs on gastric cancer. Oncotarget. 2016;7(8):8601–12. doi: 10.18632/oncotarget.6926. [DOI] [PMC free article] [PubMed] [Google Scholar]
- 3.Mocellin S, Pasquali S. Diagnostic accuracy of endoscopic ultrasonography (EUS) for the preoperative locoregional staging of primary gastric cancer. Cochrane Database Syst Rev. 2015;2(2):CD009944. doi: 10.1002/14651858.CD009944.pub2. [DOI] [PMC free article] [PubMed] [Google Scholar]
- 4.Hashad D, Elbanna A, Ibrahim A, Khedr G. Evaluation of the role of circulating long non-coding RNA H19 as a promising novel biomarker in plasma of patients with gastric cancer. J Clin Lab Anal. 2016;30(6):1100–5. doi: 10.1002/jcla.21987. [DOI] [PMC free article] [PubMed] [Google Scholar]
- 5.Morimoto N, Takeuchi H, Nishida Y, et al. Clinical application of the DiversiLab microbial typing system using repetitive sequence-based PCR for characterization of Helicobacter pylori in Japan. J Clin Lab Anal. 2015;29(3):250–53. doi: 10.1002/jcla.21758. [DOI] [PMC free article] [PubMed] [Google Scholar]
- 6.Park JY, von Karsa L. Prevention strategies for gastric cancer: A global perspective. Clin Endosc. 2014;47:478–89. doi: 10.5946/ce.2014.47.6.478. [DOI] [PMC free article] [PubMed] [Google Scholar]
- 7.Kalnina Z, Meistere I, Kikuste I, et al. Emerging blood-based biomarkers for detection of gastric cancer. World J Gastroenterol. 2015;21(41):11636–53. doi: 10.3748/wjg.v21.i41.11636. [DOI] [PMC free article] [PubMed] [Google Scholar]
- 8.Wu W, Yong WW, Chung MCM. A simple biomarker scoring matrix for early gastric cancer detection. Proteomics. 2016;16(22):2921–30. doi: 10.1002/pmic.201600194. [DOI] [PubMed] [Google Scholar]
- 9.Shimada H, Noie T, Ohashi M, et al. Clinical significance of serum tumor markers for gastric cancer: A systematic review of the literature by the Task Force of the Japanese Gastric Cancer Association. Gastric Cancer. 2014;17(1):26–33. doi: 10.1007/s10120-013-0259-5. [DOI] [PubMed] [Google Scholar]
- 10.Akilzhanova A, Nurkina Z, Momynaliev K, et al. Genetic profile and determinants of homocysteine levels in kazakhstan patients with breast cancer. Anticancer Res. 2013;33:4049–60. [PubMed] [Google Scholar]
- 11.Chen FP, Lin CC. Higher plasma homocysteine is associated with increased risk of developing colorectal polyps. Nutr Cancer. 2012;65(2):195–201. doi: 10.1080/01635581.2013.756532. [DOI] [PubMed] [Google Scholar]
- 12.Laird PW. DNA methylation and cancer. Hum Mol Genet. 1994;3:1487–95. doi: 10.1093/hmg/3.suppl_1.1487. [DOI] [PubMed] [Google Scholar]
- 13.Yu L, Chen J. Association of MTHFR Ala222Val (rs1801133) polymorphism and breast cancer susceptibility: An updated meta-analysis based on 51 research studies. Diagn Pathol. 2012;7:171–81. doi: 10.1186/1746-1596-7-171. [DOI] [PMC free article] [PubMed] [Google Scholar]
- 14.Jiao Z, Li D. Lack of association between MHTFR Glu429Ala polymorphism and breast cancer susceptibility: A systematic review and meta-analysis of 29 research studies. Tumour Biol. 2013;34:1225–33. doi: 10.1007/s13277-013-0665-7. [DOI] [PubMed] [Google Scholar]
- 15.Zhu BT. On the mechanism of homocysteine pathophysiology and pathogenesis: A unifying hypothesis. Histol Histopathol. 2002;17:1283–91. doi: 10.14670/HH-17.1283. [DOI] [PubMed] [Google Scholar]
- 16.Choi SW, Mason JB. Folate status: Effects on pathways of colorectal carcinogenesis. J Nutr. 2002;132:2413S–18S. doi: 10.1093/jn/132.8.2413S. [DOI] [PubMed] [Google Scholar]
- 17.Wu LL, Wu JT. Hyperhomocysteinemia is a risk factor for cancer and a new potential tumor marker. Clin Chim Acta. 2002;322:21–28. doi: 10.1016/s0009-8981(02)00174-2. [DOI] [PubMed] [Google Scholar]
- 18.Morson B. President’s address. The polyp-cancer sequence in the large bowel. Proc R Soc Med. 1974;67:451–57. [PMC free article] [PubMed] [Google Scholar]
- 19.Fearon ER. A genetic model for colorectal tumorigenesis. Cell. 1990;61:759–67. doi: 10.1016/0092-8674(90)90186-i. [DOI] [PubMed] [Google Scholar]
- 20.Atkin WS, Morson BC, Cuzick J. Long-term risk of colorectal cancer after excision of rectosigmoid adenoma. N Engl J Med. 1992;326:658–62. doi: 10.1056/NEJM199203053261002. [DOI] [PubMed] [Google Scholar]
- 21.Peipins LA, Sandler RS. Epidemiology of colorectal adenoma. Epidemiol. 1994;16(2):273–97. doi: 10.1093/oxfordjournals.epirev.a036154. [DOI] [PubMed] [Google Scholar]
- 22.Sobin L, Wittekind C. International Union Against Cancer (IUAC) In: Sobin LH, Gospodarowicz MK, Wittekind C, editors. TNM Classification of Malignant Tumours. 5th ed. Wiley; New York: 1997. pp. 59–62. [Google Scholar]
- 23.Selhub J, Jacques PF, Wilson PW, et al. Vitamin status and intake as primary determinants of homocysteinemia in an elderly population. JAMA. 1993;270:2693–98. doi: 10.1001/jama.1993.03510220049033. [DOI] [PubMed] [Google Scholar]
- 24.Kaji E, Kato J, Saito S, et al. Serum folate and homocysteine level are associated with colon tumorigenesis in end-stage renal disease patients. Nutr Cancer. 2011;63:202–11. doi: 10.1080/01635581.2011.523501. [DOI] [PubMed] [Google Scholar]
- 25.Miller JW, Beresford SA, Neuhouser ML, et al. Homocysteine, cysteine, and risk of incident colorectal cancer in the Women’s Health Initiative observational cohort. Am J Clin Nutr. 2013;97:827–34. doi: 10.3945/ajcn.112.049932. [DOI] [PMC free article] [PubMed] [Google Scholar]
- 26.Ashktorab H, Begum R, Akhgar A, et al. Folate status and risk of colorectal polyps in African Americans. Dig Dis Sci. 2007;52:1462–70. doi: 10.1007/s10620-006-9236-8. [DOI] [PubMed] [Google Scholar]
- 27.Le Marchand L, White KK, Nomura AM, et al. Plasma level of B vitamins and colorectal cancer risk: The multiethnic cohort study. Cancer Epidemiol Biomarkers Prev. 2009;18:2195–201. doi: 10.1158/1055-9965.EPI-09-0141. [DOI] [PMC free article] [PubMed] [Google Scholar]
- 28.Weinstein SJ, Albanes D, Selhub J, et al. One-carbon metabolism biomarkers and risk of colon and rectal cancer. Cancer Epidemiol Biomarkers Prev. 2008;17:3233. doi: 10.1158/1055-9965.EPI-08-0459. [DOI] [PMC free article] [PubMed] [Google Scholar]
- 29.Lissowska J, Gaudet MM, Brinton LA, et al. Genetic polymorphisms in the one-carbon metabolism pathway and breast cancer risk: A population-based case-control study and meta-analyses. Int J Cancer. 2007;120:2696–703. doi: 10.1002/ijc.22604. [DOI] [PubMed] [Google Scholar]
- 30.Figueiredo JC, Grau MV, Haile RW, et al. Folic acid and risk of prostate cancer: Results from a randomized clinical trial. J Natl Cancer Inst. 2009;101:432–35. doi: 10.1093/jnci/djp019. [DOI] [PMC free article] [PubMed] [Google Scholar]
- 31.Zacho J, Yazdanyar S, Bojesen SE, et al. Hyperhomocysteinemia, methylene tetrahydrofolate reductase c.677C>T polymorphism and risk of cancer: Cross-sectional and prospective studies and meta-analyses of 75,000 cases and 93,000 controls. Int J Cancer. 2011;128:644–52. doi: 10.1002/ijc.25375. [DOI] [PubMed] [Google Scholar]
- 32.Yang Y, Shao Y, Zhu M, et al. Using gastric juice lncRNA-ABHD11-AS1 as a novel type of biomarker in the screening of gastric cancer. Tumour Biol. 2016;37(1):1183–88. doi: 10.1007/s13277-015-3903-3. [DOI] [PubMed] [Google Scholar]
- 33.Wu J, Li G, Wang Z, et al. Circulating microRNA-21 is a potential diagnostic biomarker in gastric cancer. Dis Markers. 2015;2015:435656. doi: 10.1155/2015/435656. [DOI] [PMC free article] [PubMed] [Google Scholar]