

Abstract
Purpose
This study aimed to objectively grade the perception of subclinical floaters in an asymptomatic cohort.
Design
A prospective observational cohort study.
Methods
One hundred eighty-two volunteers (49 men, 133 women) with ages ranging from 17.7 to 78.6 years were recruited for floater assessment. Participants were assessed by a light box and by vitreoscope, after which they graded the floaters using a graphic classification system. They also completed a questionnaire to estimate the impact of floaters on daily life. In addition, biometric and refractive data were documented for all participants.
Results
Using the light box method, 67.6% of participants reported seeing transparent floaters, which increased to 84.1% when using the vitreoscope. Opaque floaters were seen by 15.9% (light box) and 6.5% (vitreoscope). Reported levels of floater discomfort varied between participants, with 80.2% of participants reporting no discomfort and 6.6% reporting moderate to manifest discomfort. The perceived discomfort was weakly correlated with the amount of visualized floaters (light box: Pearson r = 0.323, P < 0.001; vitreoscope: r = 0.174, P < 0.001). Both floater perception and discomfort increased with age (r = 0.203, P = 0.006; r = 0.194, P = 0.009, respectively), although neither changed with axial length or refraction (P = 0.131, P = 0.070, respectively).
Conclusions
The light box and the vitreoscope demonstrate that subclinical floaters are very common, even in nonsymptomatic subjects. The amount of perceived floaters in this cohort correlates only weakly with floater-related discomfort.
Key Words: vitreous floaters, vitreous opacities, ocular biometry, vitreoscope
The perception of floaters is a widely reported phenomenon in ophthalmic patients, and the onset of new floater symptoms is a common cause of acute presentation to emergency ophthalmic services.1 On the basis of the symptoms alone, it is not possible to determine the etiology of floaters,2 as there seems to be a distinction between physiological, nonclinical floaters that people tolerate well and the floaters that distress patients and lead to clinical presentations. It is unclear, however, whether the difference lies in the floaters or in the perceptions of the patient. Moreover, the baseline characteristics and the prevalence of vitreous floaters are not known for nonclinical populations.
Most floaters are caused by mobile particles suspended in the vitreous of the eye, a highly acellular extracellular matrix consisting predominantly of water (98%–99%).3,4 Vitreous displays gel-like properties that are conferred by collagens and glycosaminoglycans. The sparse cellular content is comprised of hyalocytes, fibrocytes, macrophages, laminocytes, Muller, and microglial cells.4 With age, the vitreous gel degenerates to a more liquid state (synchysis), from 20% liquefaction at the age of 18 to more than 50% at the age of 80.4 This is accompanied by an increase in the number of optically dense structures in the vitreous (syneresis).5 These structures, often described as tracts, septa, lamellae, membranes, and fine bundles, seem to be composed of collagen material and progressively increase in density and irregularity.6
The perception of floaters stems both from direct visualization of material condensations and from liquefied vitreal pockets hindering the passage of light through the eye. The perception of floaters increases with age and has been reported more frequently in myopes.7 It has been hypothesized that this is due to a retinal magnification effect that makes small floaters appear more pronounced.7
The purpose of this study was to assess a cohort of healthy participants who did not present to ophthalmological services with floater complaints, to characterize the subjective perception of their floaters, and to determine possible demographic or refractive associations. Participants were assessed with 2 types of light to maximize the chance of floater perception. On the basis of what they saw, volunteers graded their floaters on a chart based on floater morphology and opacity. Refractive and biometry data were collected to test the hypothesis that floater perceptions are more frequent in myopic conditions. A short questionnaire on the impact of floaters on daily life was also given to determine whether there was any correlation between the number of perceived floaters and annoyance of floaters in daily life.
MATERIALS AND METHODS
Participant Recruitment
Participants were recruited predominantly from employees and students of Antwerp University Hospital and the University of Antwerp. Participants did not present with a primary complaint of floaters. Exclusion criteria were a distance corrected visual acuity less than 0.5 (Snellen decimal), a history of ocular surgery, mean spherical equivalent outside the range of −10 diopters (D) to +10 D, and hard contact lens use. The study adhered to the tenets of the Declaration of Helsinki and received approval from the ethical committee of Antwerp University Hospital (Ref. nr. 7/6/24). Signed informed consent was obtained from all volunteers before testing. No slit lamp fundoscopy was performed on the participants, and participants assessed their floaters without cycloplegia to optimize floater perception.
Assessment of Floater Perception
Floater perception was assessed using a light box and a purpose-built “vitreoscope.” In the light box method, the subject was positioned to view a uniformly lit light box (Kenro Limited, Swindon, UK) (Fig. 1A). The participant was requested to move his/her eyes in random directions and then to refixate centrally to elicit the floaters. The light box emulated the light intensity of a bright day, which also typically exacerbates floater perception. After assessment, the participant then classified the observed floaters for each eye separately with the grading scale discussed later.
FIGURE 1.
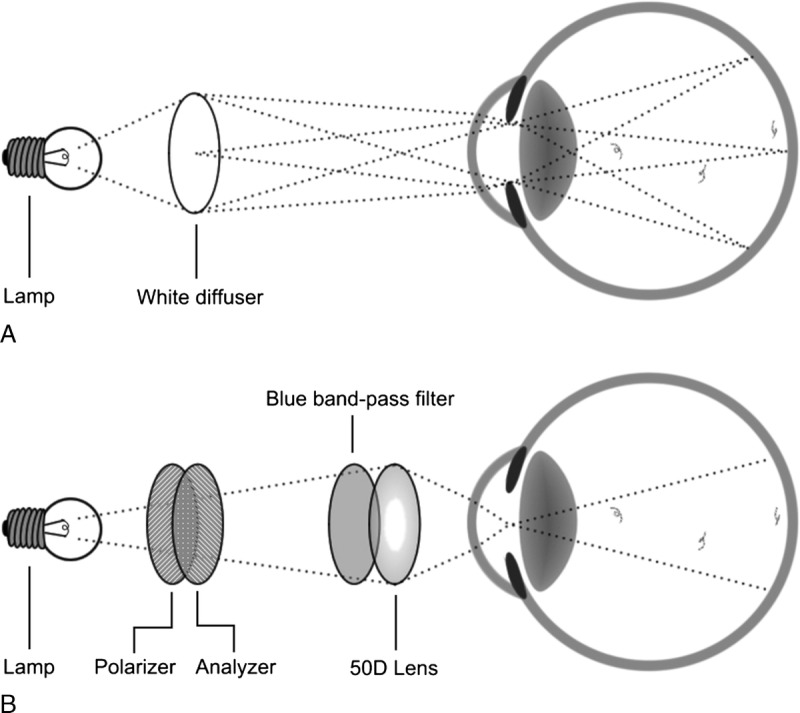
Schematic of light box and vitreoscope assessments.
The vitreoscope is a modified halogen desk light similar to a blue-field entoscope (Fig. 1B).8 The apparatus consists of a single 50 D convex lens that projects an image of the halogen light source onto the pupil plane of the eye, which results in uniform illumination of the vitreous and the retina (ie, “Maxwellian view”).9 The apparatus includes a blue dichroic filter to improve floater contrast and a pair of rotatable polarizers to control light intensity. Similar to the light box assessment, subjects were tested monocularly, asked to look in random directions and then refixate. The patients then classified their floaters again on the grading scale.
Floater Classification
To grade the perceived floaters, we designed a classification system that assisted subjects in indicating what they observed (Fig. 2). The system categorizes floaters under 3 main headings: transparent floaters, opaque floaters, and others. Transparent floaters are described as delicate, see-through structures but with clearly defined shapes. The shapes may be described as cells (C), strands (S), and membranes (M) (Table 1). The quantity of floaters was graded from 0 to 3, although half-measure increments could also be used at the participants’ request.
FIGURE 2.
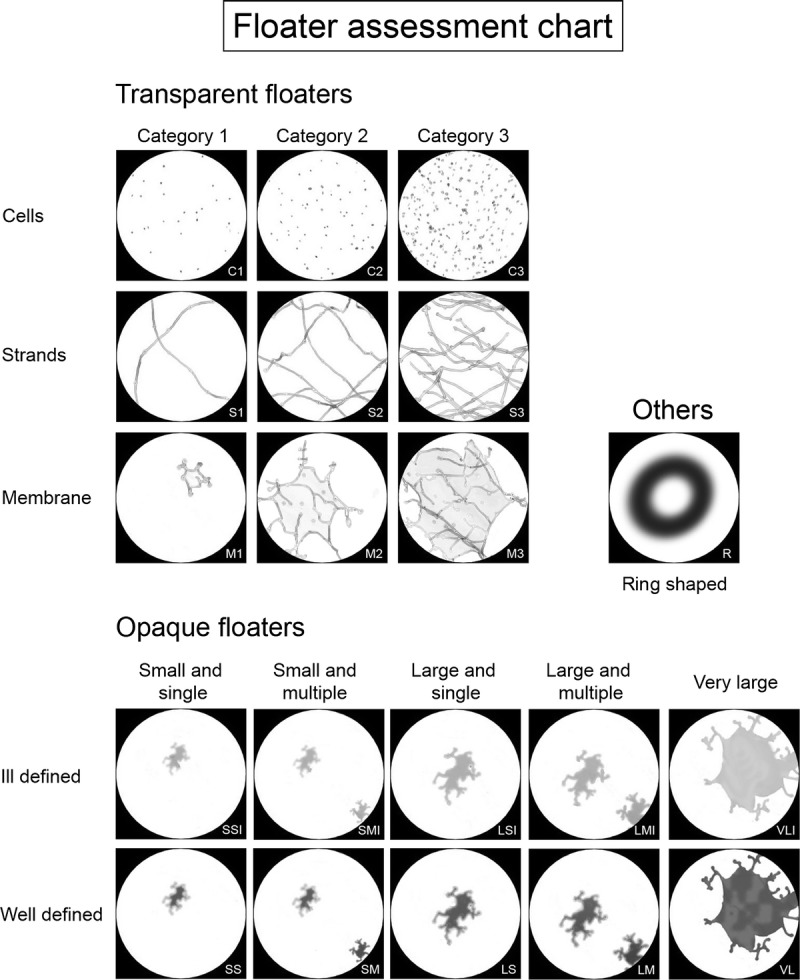
Floater classification system.
TABLE 1.
Abbreviations and Descriptions of Floater Categories
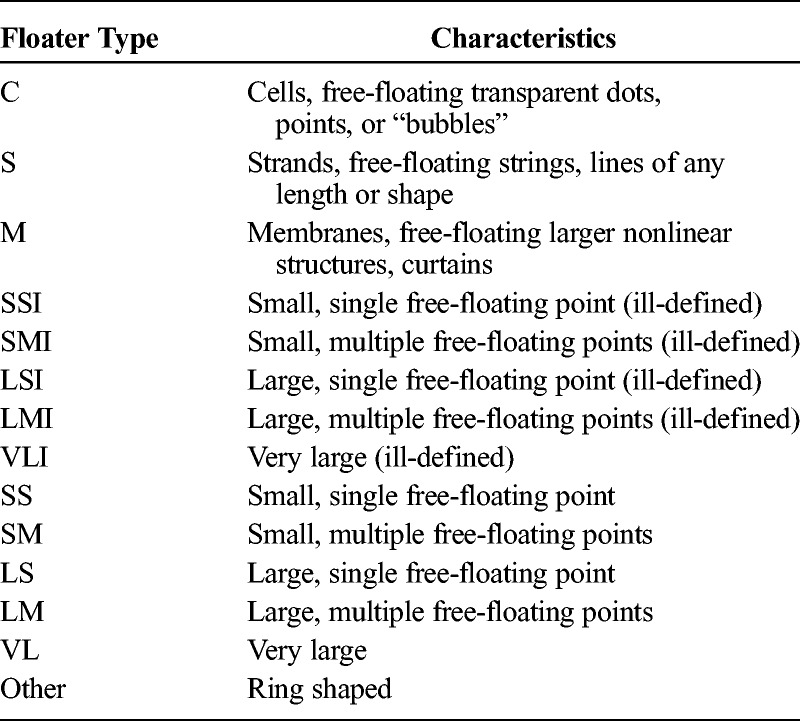
Opaque floaters are optically dense structures varying in size and morphology. These floaters were further graded based on size and number (Fig. 2, Table 1). Opaque floaters are also described based on contrast and may be well-defined (sharp, dark edges) or ill-defined (fuzzy, indistinct edges). Ill-defined floaters are denoted by the addition of “I” to the classification (Fig. 2, Table 1). Finally, the category “Others” was added to account for ring-shaped floaters.
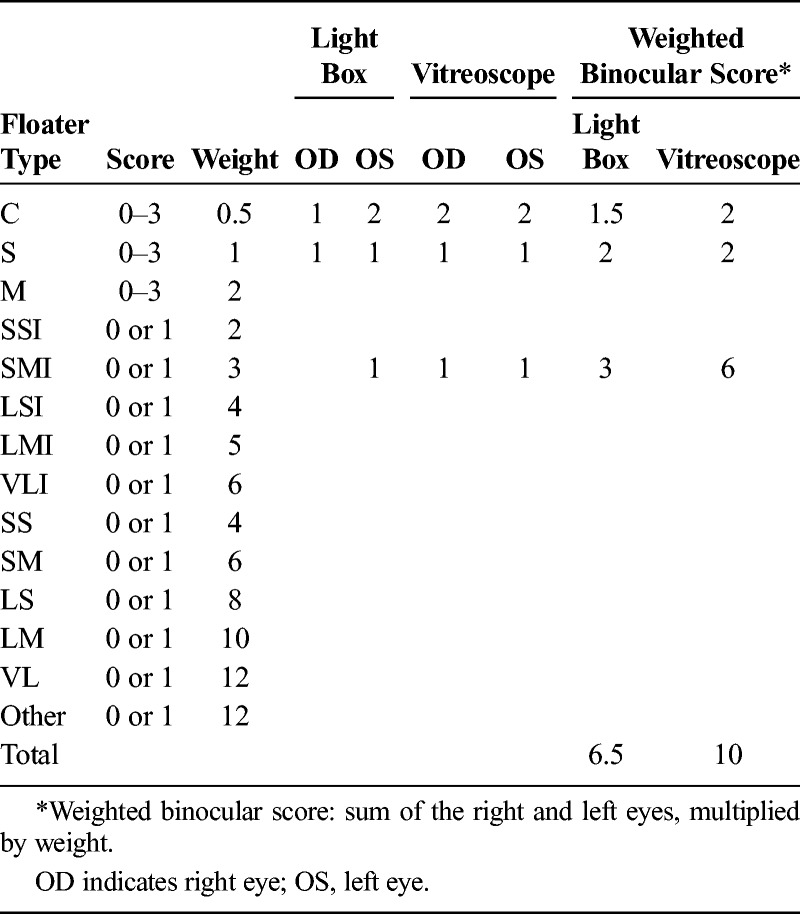
After both the light box and vitreoscope assessments, participants were asked to grade what they had seen by choosing combinations of the floater types that most closely resembled their floaters. Upon completion of grading, scores were multiplied by weighing factors and added to obtain a final floater score (Table 2). Both assessment methods could either be considered separately or combined into a total average value. Similarly, the scores for left and right eyes could be combined or considered separately.
TABLE 2.
Example Calculation of Weighted Binocular Floater Score
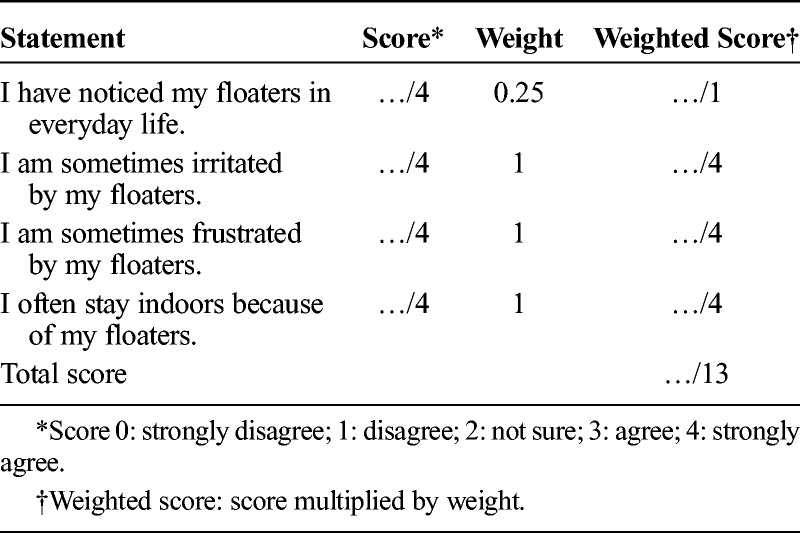
The degree to which participants were disturbed by floater symptoms was assessed with a short questionnaire (Table 3). On the basis of the responses, participants were categorized as having no discomfort (score ≤ 1), mild discomfort (1 < score ≤ 4), moderate discomfort (4 < score ≤ 7), or manifest discomfort (score > 7). Questions were weighted equally except for Q1: “I have noticed my floaters in everyday life,” which was deemed to be of a lesser importance, as noticing floaters does not equate to annoyance.
TABLE 3.
Short Floater Questionnaire
Biometry
Spherical equivalent refraction was obtained with an ARK-700 autorefractometer (Nidek, Gamagori, Japan), supplemented by the IOLMaster (Version 2, Carl Zeiss, Jena, Germany) to measure axial length.
Statistics
All calculations were performed using SPSS 20 (IBM Corp, Armonk, NY) and Excel 2010 (Microsoft Corp, WA).
RESULTS
Participant Demographics
A total of 182 participants underwent floater assessment, 49 men and 133 women. The cohort was predominantly white, with only 6 nonwhite participants. The mean participant age was 41.5 ± 13.6 years (range, 17.7–78.6 years).
Reported Floaters in the Cohort
Transparent floaters were the most prevalent floater type, with 67.6% of participants reporting a score of 1 or higher for cells, strands, and/or membranes during light box assessment (Table 4). The most common morphology within the transparent floater group was strands, reported in 46.7% of subjects, followed by the cell morphology (33.0%) and membranes (6.6%). During light box assessment, 15.9% of subjects reported seeing opaque floaters, most of which were ill-defined (11.5%) rather than well-defined (4.4%; Fig. 3A).
TABLE 4.
Prevalence of Floater Types in 182 Right Eyes (%)
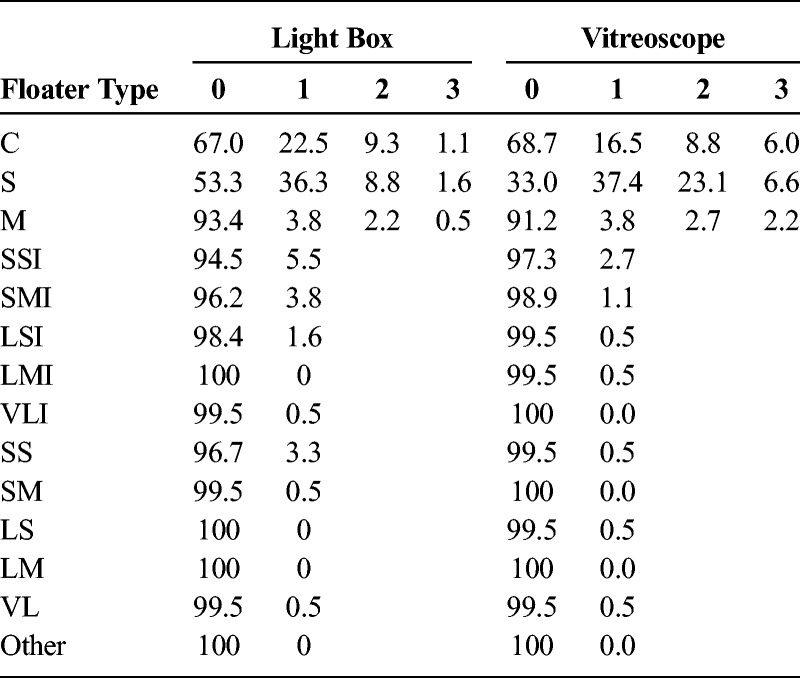
FIGURE 3.
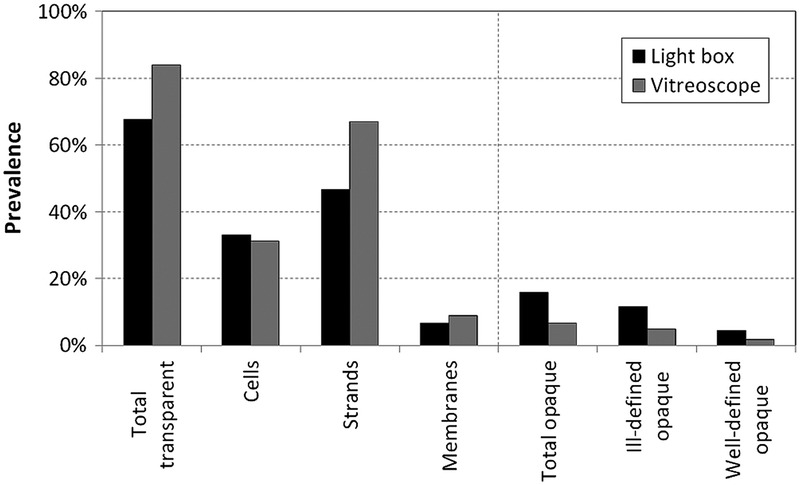
Prevalence of transparent and opaque floaters using light box and vitreoscope.
The vitreoscope significantly increased the visibility of transparent floaters, which were detected by 84.1% of subjects (score ≥ 1; Table 4). Using this method, 67.0% of participants reported strand-shaped floaters (+20.3% compared with the light box; P < 0.001, Wilcoxon signed-rank test), but the perception of cells or membranes was not significantly different from the light box method, at 31.3% and 8.8%, respectively (−1.7%, P = 0.372; +2.2%, P = 0.211). Using the vitreoscope, fewer subjects observed opaque floaters, with 4.9% of subjects reporting well-defined floaters and 1.6% reporting ill-defined floaters (Fig. 3B). No subject reported the ring-shaped morphology by either detection method.
Floater Discomfort Assessment
There was considerable variation in floater discomfort reported by participants. On the questionnaire, most subjects were found to have no floater disturbance (80.2%). The rest of the cohort reported mild disturbance (13.2%), moderate disturbance (5.5%), and manifest disturbance (1.1%). No subject recruited in the cohort had attended ophthalmic services for medical advice regarding floaters.
The findings of the light box assessment showed a small but statistically significant correlation to the questionnaire score after exclusion of 1 outlier (Pearson r = 0.323, P < 0.001; Fig. 4A). The vitreoscope assessment also showed a small correlation to the reported symptoms, again after the exclusion of 1 outlier with a floater score of 24 (Pearson r = 0.174, P < 0.001; Fig. 4B).
FIGURE 4.
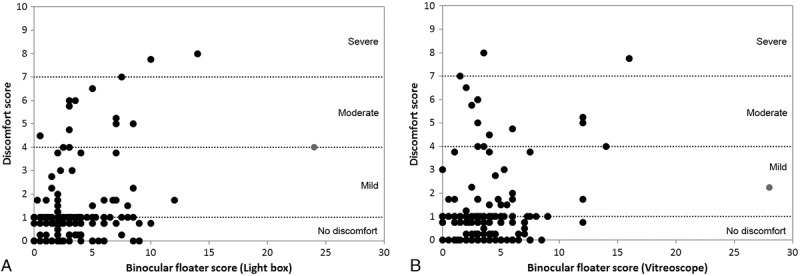
Floater discomfort score plotted as a function of weighted binocular floater score for the light box (A) and the vitreoscope (B). The outliers excluded from correlation analysis are indicated by the gray marker. Dotted lines indicate the discomfort levels.
Finally, a generalized linear model was used to analyze the correlation between floater discomfort score and floater type detected by light box. This yielded no significant relationships (P > 0.05). Only the “cell” (C) and the “small, multiple, and well-defined” (SM) types had P values close to the significance level (P = 0.071 and P = 0.054, respectively).
Correlation with Age, Axial Length, or Refraction
The weighted binocular floater scores measured by light box increased significantly with subject age (excluding 1 outlier, Pearson r = 0.203, P = 0.006; Fig. 5A). The same was found for the floater discomfort score (r = 0.194, P = 0.009; Fig. 5B). When only right eyes were examined, no significant correlation was found between monocular floater score and axial length or spherical equivalent, even after correction for age (first-order correlation coefficient, P = 0.131, P = 0.070, respectively).
FIGURE 5.
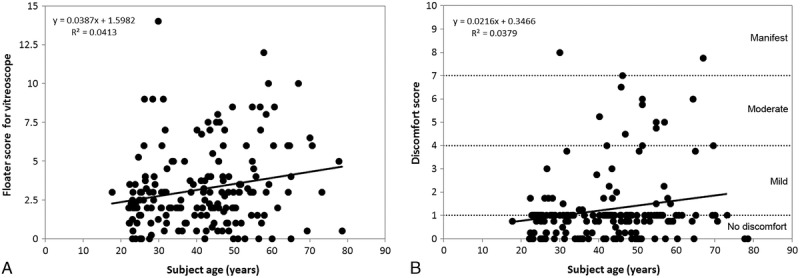
A, Weighted binocular floater score determined with the light box as a function of age. B, Floater discomfort score as a function of age.
Comparing age and right eye biometry of subjects with no floater discomfort (ie, discomfort score ≤ 1) and subjects with floater discomfort (ie, score > 1) showed a significant difference for subject age (unpaired t test, P = 0.047) but not for any biometric parameter. Although in this analysis, the binocular floater discomfort score was used to separate the (monocular) right eye biometry into 2 groups for comparison, this result is still expected to be accurate given the strong correlations that are known to exist between the biometry of fellow eyes.
DISCUSSION
Visual disturbance from floaters can affect quality of life even if it does not directly affect objective visual acuity.7 The lack of correlation between patient perception and change in measureable visual acuity is a significant problem in treating symptomatic floater patients. Without a significant decline in visual acuity, surgeons are reluctant to intervene, despite the potential to alleviate symptoms.10 The failing for this situation lies not in patient perception, but in the lack of appropriate assessment tools to investigate the nature of this type of complaint, as visual acuity is ill equipped as a measure for floater-related visual impairment. This issue is also seen in a number of reports on floater interventions that use levels of patient satisfaction to gauge the outcome of the procedure.10–14 Although satisfaction is certainly an important outcome, it is difficult to quantify and highly subjective. The potential for a placebo influence is also difficult to define. There is, therefore, a need for a metric to quantify vitreous floaters. The proposed system constitutes a first step toward such a metric.
It is also important to emphasize that the light box and vitreoscope methods each present floaters to the subject in a different way, with the light box emitting diffuse light to enhance the view of floaters in close proximity to the retina and the vitreoscope visualizing floaters that pass through the cone of incident light, regardless of their distance to the retina. In practice, the field of view of the vitreoscope is relatively narrow in comparison with that of the light box, which reduces the volume of the light cone between the crystalline lens and the retina used for floater detection (Fig. 1B). This accounts for the 32.4% of subjects that reported seeing fewer floaters in the vitreoscope, although they should theoretically report more. For this reason, we recommend that both methods be used side by side to optimize floater detection.
As seen in Figure 3, perception of vitreous floaters may be considered a very common phenomenon in the general population. Using the light box and vitreoscope assessment, we found that 84% of participants detected some form of floaters. Despite this high prevalence of floaters on assessment, most subjects were either asymptomatic or not particularly disturbed by their floaters. This was also reinforced by the fact that not a single participant in this cohort felt the need to consult an ophthalmologist for floater assessment. This is in contrast with the often severe complaints of symptomatic floater patients.7
We could not confirm any correlation between floater score and biometry, which would exclude axial length and any other biometric parameter as risk factors for floaters. The increase in floater perception and floater discomfort with age, which has been suggested both theoretically5 and clinically,15 was confirmed by our results. No patients reported seeing ring-shaped floaters, for example Weiss rings, which may be because the participants recruited were from the general population and not presenting for clinical floater assessment.
Because our findings reveal such a high prevalence of floaters in the population, this study raises the question as to whether the floaters of symptomatic patients are fundamentally different to those of the general population. Symptomatic patients may have different biometry, floater density, or floater position to the asymptomatic population, although this has not yet been described. Another source of potential difference may be in patient personality, employment, everyday lighting conditions, and others. Clinical verification of the grading system in symptomatic floater patients and a comparison with fundoscopy should therefore be the subject of a follow-up study.
ACKNOWLEDGMENTS
The authors thank Nadia Zakaria, Jeroen Claeys, and Greet Vandeweyer for their support in collecting the data.
Footnotes
The authors have no funding or conflicts of interest to declare.
REFERENCES
- 1. Hollands H, Johnson D, Brox AC, et al. Acute-onset floaters and flashes. JAMA. 2009; 302: 2243– 2249. [DOI] [PubMed] [Google Scholar]
- 2. Sebag J. Floaters and the quality of life. Am J Ophthalmol. 2011; 152: 3– 4. [DOI] [PubMed] [Google Scholar]
- 3. Swann D. Biochemistry of the vitreous. In: Schepens CL, Neentens A (eds) The Vitreous and Vitreoretinal Interface. Springer Press, New York; 1987: 59– 72. [Google Scholar]
- 4. Bishop PN. Structural macromolecules and supramolecular organisation of the vitreous gel. Prog Retin Eye Res. 2000; 19: 323– 344. [DOI] [PubMed] [Google Scholar]
- 5. Ponsioen TL, Hooymans JMM, Los LI. Remodelling of the human vitreous and vitreoretinal interface—a dynamic process. Prog Retin Eye Res. 2010; 29: 580– 595. [DOI] [PubMed] [Google Scholar]
- 6. Los LI. The rabbit as an animal model for post-natal vitreous matrix differentiation and degeneration. Eye (Lond). 2008; 22: 1223– 1232. [DOI] [PubMed] [Google Scholar]
- 7. Wagle AM, Lin WY, Yap TP, et al. Utility values associated with vitreous floaters. Am J Ophthalmol. 2011; 152: 60– 65. [DOI] [PubMed] [Google Scholar]
- 8. Sinclair SH, Loebl M, Riva CE. Blue field entopic phenomenon in cataract patients. Arch Ophthalmol. 1981; 97: 1092– 1095. [DOI] [PubMed] [Google Scholar]
- 9. Leibowitz H. The use and calibration of the Maxwellian view in visual instrumentation. Am J Psychol. 1954; 67: 530– 532. [PubMed] [Google Scholar]
- 10. Schiff WM, Chang S, Mandava N, et al. Pars plana vitrectomy for persistent visually significant vitreous opacities. Retina. 2000; 20: 591– 596. [DOI] [PubMed] [Google Scholar]
- 11. Wilkinson CP. Safety of vitrectomy for floaters—how safe is safe? [Editorial]. Am J Ophthalmol. 2011; 151: 919– 920. [DOI] [PubMed] [Google Scholar]
- 12. Tan HS, Mura M, Lesnik Oberstein SY, et al. Safety of vitrectomy for floaters. Am J Ophthalmol. 2011; 151: 995– 998. [DOI] [PubMed] [Google Scholar]
- 13. Schulz-Key S, Carlsson JO, Crafoord S. Longterm follow-up of pars plana vitrectomy for vitreous floaters: complications, outcomes and patient satisfaction. Acta Ophthalmol. 2011; 89: 159– 165. [DOI] [PubMed] [Google Scholar]
- 14. de Nie KF, Crama A, Tilanus MAD, et al. Pars plana vitrectomy for disturbing primary vitreous floaters: clinical outcome and patient satisfaction. Graefes Arch Clin Exp Ophthalmol. 2012. [DOI] [PubMed] [Google Scholar]
- 15. Sendrowski DP, Bronstein MA. Current treatment for vitreous floaters. Optometry. 2010; 81: 157– 161. [DOI] [PubMed] [Google Scholar]