

Abstract
Objective
Quantify the impact of diabetes status on healthy and disabled years of life for older adults in the U.S. and provide a baseline from which to evaluate ongoing national public health efforts to prevent and control diabetes and disability.
Research Design and Methods
20,008 adults aged 50 years and older followed from 1998 to 2012 in the Health and Retirement Study, a prospective biannual survey of a nationally representative sample adults. Diabetes and disability status (defined by mobility loss, difficulty with instrumental activities [IADL], and/or difficulty with activities of daily living [ADL]) were self-reported. We estimated incidence of disability, remission to non-disability, and mortality. We developed a discrete-time Markov simulation model with a 1-year transition cycle to predict and compare lifetime disability-related outcomes between persons with and without diabetes. Data represent the U.S. population in 1998.
Results
From age 50, diabetic adults died 4.6 years earlier, developed disability six to seven years earlier and spent about one to two more years in a disabled state than non-diabetic adults. With increasing baseline age, diabetes was associated with significant (p<0.05) reductions in the number of total and disability-free life years, but the absolute difference in years between those with and without diabetes was less than at younger baseline age. Diabetic men spent about twice as much of their remaining years disabled (20% to 24% of remaining life across the 3 disability definitions) as men without diabetes (12% to 16% of remaining life across the 3 disability definitions). Similar associations between diabetes status and disability-free and disabled years were observed among women.
Conclusions
Diabetes is associated with a substantial reduction in non-disabled years, to a greater extent than the reduction of longevity.
INTRODUCTION
Diabetes is one of the most common public health threats in the U.S., affecting 12% of adults and carrying an estimated lifetime probability of 40%(1; 2). Furthermore, increases in life expectancy of the diabetes population have led to a large increase in the number of years spent with diabetes for the average person(1). This, combined with increased prevalence since 1985, has led to a 156% and 70% increase in the number of years that a typical community of men and women, respectively, will spend with diabetes(1).
Diabetes is known for its diverse vascular and neuropathic complications and for the associated excess risk of disability. Disability experienced among people with diabetes includes loss of mobility, and the ability to carry out instrumental and basic activities of daily living(3–6). The increased risk of disability erodes quality of life, increases morbidity, and increases the need for health services and social security resources, relative to non-diabetic peers(7). Disability-free life-years is a measure of population health that quantifies the impact of health conditions on non-disabled and disabled years(8). As such, it provides an important metric to gauge the impact of chronic conditions, as well as attempts of public health interventions to compress morbidity in the population alongside reductions in mortality.
Despite the well documented impact of diabetes on diverse forms of macrovascular morbidity(9) and mortality(10), there have been no national estimates of the years of disability-free versus disabled life years lost to the disease among U.S. adults. In these analyses, we assembled prospective cohort data on incidence of disability and mortality among a diverse, population-based sample of U.S. adults aged ≥50 years to quantify the impact of diabetes on disability-free and disabled years of life and to provide a baseline from which to evaluate the impact of national public health efforts to control and prevent diabetes.
METHODS
Population and data sources
Our analyses are based on 20,008 adults aged 50 and older enrolled in the Health and Retirement Study (HRS), a population based longitudinal cohort study(11). Respondents entered in 1998 with biennial visits in 2000, 2002, 2004, 2006, 2008, 2010, and 2012. Initial response rates ranged from 69 to 81%, and follow-up response rates were 87 to 89%(12). Reports from the 8 visits, described below, were used to estimate prevalence and incidence of diabetes, incidence of disability, mortality, and incidence transitions from diabetes and non-diabetes status to disability and mortality, as well as remission from disability to non-disabled states and mortality. The HRS is sponsored by the National Institute on Aging and performed by the Institute for Social Research at the University of Michigan. The Health Sciences Institutional Review Board at the University of Michigan approved the HRS study design. The data used for this analysis were stripped of unique personal identifiers and are publicly available. The data used for our analyses are nationally representative.
Definitions
Prevalent diabetes was defined by the survey question of whether the individual had been diagnosed by a physician with diabetes or high blood glucose. Incident diabetes was defined as the first self-report by a respondent to HRS of a diabetes diagnosis (i.e., being told by a doctor that he or she has diabetes or high blood sugar) during the study period(13). Incident diabetes cases were incorporated into analyses such that an individual who was diagnosed with diabetes after baseline was included in the diabetes group only if they did not become disabled prior to a diabetes diagnosis. If they became disabled after they were diagnosed with diabetes they were considered an incident case of disability in the diabetes group.
Mobility disability was defined as self-report of difficulty with any of the following: walking one block; climbing one flight of stairs; stooping, crouching, or kneeling; pushing or pulling a large object(14). Modifying a previously developed four state model for defining mobility disability among persons with diabetes(14), we classified a respondent’s mobility disability as severe if they reported four or five of the previously mentioned mobility measures. Similarly, instrumental activities of daily living (IADL) were defined as self-report of difficulty doing any of the following: using the telephone, taking medication, handling money, shopping, and preparing meals. Activities of daily living (ADL) were defined as self-report of difficulty doing any of the following: walking across a room, getting in and out of bed, dressing, bathing, and eating. Death was determined during exit interviews with the respondent’s proxy, family or friend, and confirmed as valid by the National Center for Health Statistics via linkage to the National Death Index (12). The year of death reported during the exit interview was used for censoring at time of death. If year was unknown, year of exit interview was used (n=126, 7%).
Estimation of Incidence
Age-specific incidence of mobility, ADL, and IADL were modeled using generalized estimating equations with a binary outcome, wherein persons with prevalent disability at baseline were excluded. All the regression models were stratified by sex and included age, piecewise age function, and diabetes status. Data were modeled with STATA version 13 (StataCorp, College Station, Texas) which accounts for the longitudinal complex survey design. Estimates were weighted to the U.S. population in 1998, followed through 2012. Regression estimates were used to determine the probability of incident disability among those with and without diabetes by age. We were unable to further stratify on race/ethnicity due to the small sample size. Therefore we adjusted for race/ethnicity by centering individual responses around the grand mean. Thus, our primary findings are adjusted for the proportion of respondents by race/ethnicity. We conducted additional analyses adjusting for the prevalence CVD to determine its effects on the primary outcomes (incidence, remission, and mortality) affecting healthy life years. These probabilities were used as inputs to the Markov models. Similarly, probability of remission from disability was calculated on a yearly basis as the persons with incident disability (for mobility, IADL, and/or ADL, respectively) who return to a state of non-disablement.
Modeling Approach
We developed a discrete-time Markov cohort simulation model with annual transition to predict and compare lifetime disability-related outcomes between persons with and without diabetes from age 50 through 100. (15) (Figure 1). The model has five states: not disabled, short-term disability, not disabled but with previous disability, permanent disability, and death. Each year, the specific proportion that moves between states (i.e., transition probabilities) was determined by the regression models.
Figure 1.
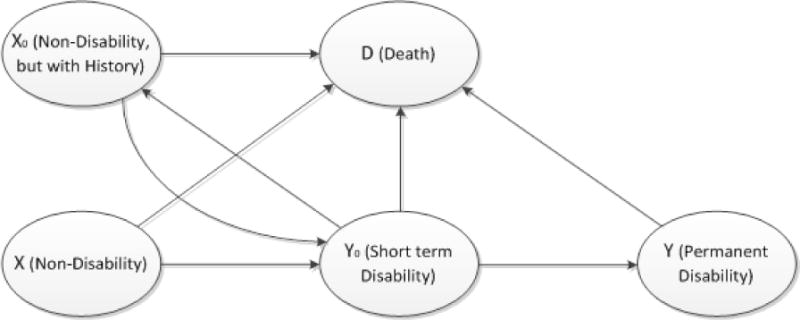
The five states Markov model
We created states of short-term disability and not being disabled but with disability history (i.e., recovered from disability) as two bridge states (i.e., connections between states) because of the high remission rates (returning to non-disabled states) observed in the data. Moreover, to simplify the model, the state of short-term disability is defined as being disability and having no remission by the end of the first year of disability onset. Therefore in the model, a person with disability onset will either recover or move to the state of permanent disability in the next year. The assumption is supported by the fact that few remissions occurred later in the study. Further, like those in the study population, individuals may have multiple episodes of short-term disability over their lifetime in the model.
On the basis of the model, we predicted 3 disability-related outcomes including the remaining lifetime risk of becoming disabled, average age of disability onset, and remaining life-years living with and without disability, among adults who reported having and not having diabetes at ages 50, 60, 70 and 80. Remaining lifetime risk was calculated as the cumulative risk of experiencing short-term or permanent disability over a lifetime. Because of the high frequency of multiple episodes of short-term disability, the average age of onset was defined as the difference between the life expectancy and mean disability-free life years. For example, from a baseline age of 50, it is possible to become disabled at age 56, recover at 58 and then become disabled again at age 64. Therefore the average age of onset was defined by taking the difference between life expectancy from age 50, and the average number of disability-free life years remaining instead of choosing the age of onset of one of the disabled episodes. The confidence intervals and p-values of the lifetime estimates were estimated using a Monte Carlo simulation of the Markov model with transition probabilities sampled from the previously described regression models. Five thousand runs were performed for each group with or without diabetes.
RESULTS
Study Population Characteristics
Among the 20,008 respondents in the analytic sample, age ranged from 50 to 105, and baseline diabetes prevalence was 14.1% among men and 12.2% among women. Among both genders, about 15%-17% of the population was non-white and 22%-23% was obese. (Table 1) Among those with a diabetes diagnosis at baseline, 8.7% were taking insulin and oral medication, 52.4% were taking oral medication only, 17.1% were taking insulin only, and 21.7% were taking no antidiabetic medications. The vast majority of all respondents who reported they had high blood pressure at baseline reported they were taking medication for high blood pressure (those with diabetes: 87%; those without diabetes 81%).
Table 1.
General characteristics of study population according to diabetes status at baseline.
| Men | Women | |||||
|---|---|---|---|---|---|---|
| Diabetes n (%) |
No Diabetes n (%) |
n total deaths* |
Diabetes n (%) |
No Diabetes n (%) |
n total deaths* |
|
| Age 50-59 | 318 (31.8) | 2225 (41.9) | 515 | 371 (26.5) | 3036 (37.3) | 482 |
| 60-69 | 504 (31.9) | 2562 (28.0) | 1098 | 537 (30.8) | 3081 (26.6) | 944 |
| 70-79 | 390 (27.2) | 1803 (21.9) | 1490 | 428 (30.0) | 2293 (23.7) | 1555 |
| 80+ | 138 (9.1) | 745 (8.2) | 847 | 208 (12.7) | 1369 (12.3) | 1401 |
| Mean age ± SE | 65.8 ± 0.4 | 63.9 ± 0.2 | – | 67.5 ± 0.3 | 65.5 ± 0.2 | – |
| Race/Ethnicity: | ||||||
| Non-Hispanic whites | 950 (79.0) | 5848 (86.6) | 3056 | 903 (70.3) | 7652 (85.6) | 3322 |
| Hispanics | 137 (9.1) | 509 (5.6) | 273 | 188 (9.9) | 650 (5.8) | 274 |
| Non-Hispanic blacks | 232 (11.9) | 830 (7.8) | 545 | 417 (19.8) | 1298 (8.6) | 721 |
| Education < HS | 473 (30.2) | 1970 (22.7) | 1475 | 686 (40.7) | 2588 (23.5) | 1739 |
| HS | 626 (48.0) | 3480 (48.5) | 1776 | 696 (47.5) | 5451 (56.9) | 2148 |
| >HS | 251 (21.8) | 1885 (28.8) | 699 | 162 (11.8) | 1740 (19.6) | 495 |
| BMI < 25 | 308 (22.1) | 2407 (31.8) | 1517 | 373 (25.2) | 4395 (46.6) | 2099 |
| 25 to < 30 | 585 (42.7) | 3485 (47.7) | 1718 | 496 (32.2) | 3197 (32.9) | 1298 |
| ≥30 | 455 (35.2) | 1427 (20.5) | 708 | 641 (42.6) | 1993 (20.5) | 900 |
| Prevalent ADL | 277 (20.6) | 909 (11.1) | 842 | 475 (29.0) | 1555 (14.9) | 1341 |
| Prevalent IADL | 245 (17.5) | 779 (9.6) | 770 | 417 (25.5) | 1326 (12.6) | 1262 |
| Prevalent mobility loss | 204 (15.2) | 537 (6.4) | 572 | 404 (25.5) | 1165 (11.2) | 1059 |
| Cardiovascular disease | ||||||
| High blood pressure | 814 (59.7) | 2853 (36.9) | 1911 | 1080 (68.4) | 4030 (38.6) | 2476 |
| Heart disease | 485 (34.6) | 1618 (20.1) | 1405 | 485 (31.7) | 1512 (14.6) | 1312 |
| Stroke | 168 (12.6) | 471 (5.7) | 494 | 181 (11.3) | 546 (5.4) | 547 |
| Arthritis | 743 (53.3) | 3283 (41.4) | 2077 | 1084 (69.0) | 5594 (54.6) | 2920 |
| Lung Disease | 105 (8.2) | 549 (6.6) | 505 | 140 (9.2) | 623 (6.0) | 523 |
| Entered Nursing Home after baseline | 24 (1.8) | 92 (1.2) | – | 52 (3.2) | 281 (2.9) | – |
ADL: Activities of daily living
IADL; Instrumental activities of daily living
Died prior to end of the study
Note: all data are self-reported, except death which is reported by proxy, friend or family, and confirmed with the National Death Index.
‘–‘ indicates cell size too small to report for confidentiality
Incidence of Diabetes, Disability and Mortality
Estimated incidence of diabetes was 1.5% per year among men and 1.3% per year among women. Annual incidence of severe mobility disability increased with age from absolute levels of 0.4% in men and 0.6% in women at age 50, roughly doubling in incidence by age 60, quadrupling by age 68, and then increased 20 times by age 87. (Data not shown) Compared to severe mobility disability, incidence of IADL and ADL disability increased similarly from age 50 to 68 and increased 26 times for women and 27 times for men by age 87. Among both men and women, disability rates (mobility, IADL, ADL) were 1.5 to 2 times higher among persons with diabetes. Disability rates were 27 to 35% higher among diabetic women than diabetic men; sex-related differences in disability were smaller among those without diabetes.
Incidence of remission from disability was more than 20% per year for most strata, (Table 2) was greater for those without diabetes than for those with diabetes, and declined substantially with age in all groups. (Data not shown, p <0.001) Mortality rates among those with diabetes were about twice as high as their non-diabetic counterparts, but the relative risk of mortality associated with diabetes decreased with increasing age. (Data not shown) Additional analyses adjusting for prevalent CVD at baseline resulted in less than 0.3 percentage point difference from the estimates unadjusted for prevalent CVD. (Appendix, Table 2a)
Table 2.
Incidence (annual % and 95% confidence interval) of major sources of morbidity affecting disability-free life years among U.S. men and women with and without diabetes.
| Men | Women | |||
|---|---|---|---|---|
| Diabetes | No Diabetes | Diabetes | No Diabetes | |
| Disability Incidence | ||||
| Severe Mobility loss | 3.3** (3.0, 3.6) | 1.7 (1.6, 1.8) | 5.0** (4.6, 5.4) | 2.6 (2.4, 2.7) |
| IADL | 3.5** (3.2, 3.8) | 2.2 (2.1, 2.4) | 4.9** (4.6, 5.3) | 2.7 (2.5, 2.8) |
| ADL | 3.8** (3.5, 4.1) | 2.3 (2.2, 2.4) | 5.1** (4.8, 5.5) | 2.9 (2.8, 3.0) |
| Mortality Rate | 4.1** (3.8, 4.4) | 2.8 (2.7, 2.9) | 4.0** (3.8, 4.3) | 2.4 (2.3, 2.5) |
| Disability Remission* | ||||
| Severe Mobility loss | 19.7** (17.6, 21.9) | 23.4 (21.7, 25.1) | 19.2 (17.3, 20.8) | 20.9 (19.8, 22.0) |
| IADL | 22.1 (20.2, 24.0) | 23.5 (22.3, 24.8) | 16.7** (15.1, 18.2) | 18.3 (17.0, 19.5) |
| ADL | 22.0** (20.3, 23.7) | 25.3 (23.9, 26.6) | 18.6** (17.3, 19.9) | 22.4 (21.3, 23.5) |
Estimated among persons with incident disability
p-value <0.001 between those with and without diabetes within sex
ADL: Activities of daily living
IADL: Instrumental activities of daily living
Note: all models were adjusted for age, race/ethnicity and sex
Disability-Free and Disabled Life Years
Across all ages and disability definitions, having diabetes was significantly associated with reduced years of total life and reduced disability-free life years compared to persons without diabetes. (Tables 3 and 4). However, there was a greater impact of diabetes on disability-free life years than on total life years, and those with diabetes spent a greater proportion of their remaining years in a disabled state, particularly among those incident at younger ages. This is illustrated in figures 2a and 2b for mobility loss disability; results were similar for ADL and IADL disability (Data not shown). From age 50, diabetic men died 4.6 years earlier, developed disability six years earlier, and spent one to one and a half more years in a disabled state than non-diabetic men. This means that diabetic men spent about twice as much of their remaining years disabled (20% to 24% of remaining life across the three disability definitions) compared to men without diabetes (12% to 16% of remaining life across the three disability definitions). With increasing baseline age, diabetes was still associated with significant reductions in the number of total and disability-free life years, but the absolute difference in years lost between those with and without diabetes was less than at younger baseline age; the exceptions to this were that by ages 60, 70, and 80, IADL disabled years were no longer significantly different between groups and by ages 70 and 80, the difference in ADL disabled years between people with and without diabetes was no longer significant.
Table 3.
Number of disability-free and disabled years by disability type among U.S. men with and without diabetes
| Diabetes | No Diabetes | |||||||
|---|---|---|---|---|---|---|---|---|
| Disability Type | Disability Onset (age) | Disability-free years (n) | Disabled Years (n) | Total Years (n) | Disability Onset (age) | Disability-free years (n) | Disabled Years (n) | Total Years (n) |
| Mobility | ||||||||
| 50 | 72.4* | 22.4* | 5.6* | 28.0* | 78.6 | 28.6 | 4.0 | 32.6 |
| 60 | 75.9* | 15.9* | 3.7* | 19.6* | 80.8 | 20.8 | 2.9 | 23.6 |
| 70 | 80.2* | 10.2* | 2.5* | 12.8* | 83.9 | 13.9 | 2.1 | 16.0 |
| 80 | 85.9* | 5.9* | 1.5* | 7.4* | 88.2 | 8.2 | 1.2 | 9.6 |
| IADL | ||||||||
| 50 | 72.2* | 22.2* | 5.8* | 28.0* | 77.5 | 27.5 | 5.0 | 32.6 |
| 60 | 75.7* | 15.7* | 3.9 | 19.6* | 80.0 | 20.0 | 3.7 | 23.6 |
| 70 | 79.9* | 9.9* | 2.9 | 12.8* | 83.1 | 13.1 | 2.9 | 16.0 |
| 80 | 85.4* | 5.4* | 2.0 | 7.4* | 87.5 | 7.5 | 2.1 | 9.6 |
| ADL | ||||||||
| 50 | 71.4* | 21.4* | 6.6* | 28.0* | 77.3 | 27.3 | 5.3 | 32.6 |
| 60 | 75.4* | 15.4* | 4.2* | 19.6* | 80.0 | 19.7 | 3.7 | 23.6 |
| 70 | 79.8* | 9.8* | 3.0 | 12.8* | 83.2 | 13.0 | 2.7 | 16.0 |
| 80 | 85.5* | 5.5* | 1.9 | 7.4* | 87.7 | 7.5 | 1.9 | 9.6 |
Indicates statistically significantly different between those with and without diabetes at p<0.05
Table 4.
Number of disability-free and disabled years by disability type among U.S. women with and without diabetes.
| Diabetes | No Diabetes | |||||||
|---|---|---|---|---|---|---|---|---|
| Disability Type | Disability Onset (age) | Disability-free years (n) | Disabled Years (n) | Total Years (n) | Disability Onset (age) | Disability-free years (n) | Disabled Years (n) | Total Years (n) |
| Mobility | ||||||||
| 50 | 71.6* | 21.6* | 9.6* | 31.2* | 78.6 | 28.6 | 7.1 | 35.7 |
| 60 | 75.8* | 15.8* | 6.7* | 22.4* | 81.2 | 21.2 | 5.3 | 26.5 |
| 70 | 80.4* | 10.4* | 4.6* | 15.0* | 84.5 | 14.5 | 3.9 | 18.3 |
| 80 | 86.1* | 6.1* | 2.8* | 8.9* | 88.7 | 8.7 | 2.5 | 11.2 |
| IADL | ||||||||
| 50 | 72.7* | 22.7* | 8.5* | 31.2* | 78.3 | 28.3 | 7.3 | 35.7 |
| 60 | 76.5* | 16.5* | 6.0* | 22.4* | 80.9 | 20.9 | 5.6 | 26.5 |
| 70 | 80.5* | 10.5* | 4.5 | 15.0* | 83.9 | 13.9 | 4.4 | 18.3 |
| 80 | 85.8* | 5.8* | 3.0 | 8.9* | 88.0 | 8.0 | 3.2 | 11.2 |
| ADL | ||||||||
| 50 | 71.3* | 21.3* | 9.9* | 31.2* | 77.6 | 27.6 | 8.0 | 35.7 |
| 60 | 75.8* | 15.8* | 6.6* | 22.4* | 80.7 | 20.7 | 5.8 | 26.5 |
| 70 | 80.3* | 10.3* | 4.7 | 15.0* | 83.9 | 13.9 | 4.4 | 18.3 |
| 80 | 85.8* | 5.8* | 3.0 | 8.9* | 88.2 | 8.2 | 3.0 | 11.2 |
Indicates statistically significantly different between those with and without diabetes at p<0.05
Figure 2a.
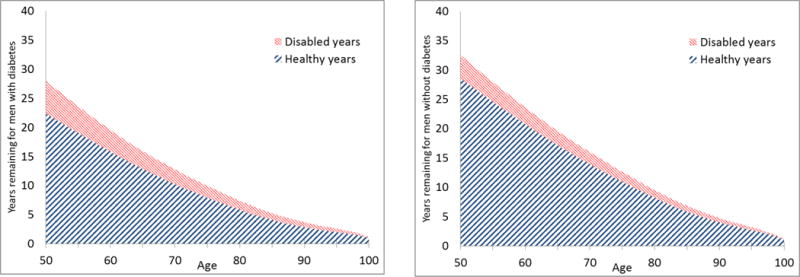
Disability-free and mobility loss disability life years remaining by age for men with and without diabetes
Figure 2b.
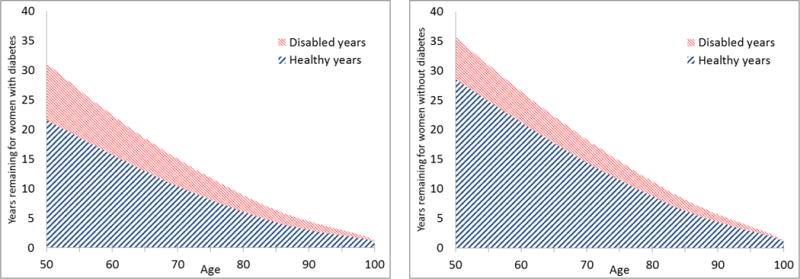
Disability-free and mobility loss disability life years remaining by age for women with and without diabetes
Similar associations between diabetes status and disability-free and disabled years were observed among women. From age 50, diabetic women had an average disability onset six to seven years earlier than non-diabetic women and lived one to two years longer in a disabled state. The largest difference was observed for mobility disability, where diabetic women from age 50 lost seven disability-free years and had 2.5 more disabled years compared to non-diabetic women. Also similar to men, women with diabetes spent about one and a half times as much of their remaining years disabled (27% to 32% across the 3 disability definitions) as women without diabetes (20%-22% across the 3 disability definitions). Similar to men, the diabetic vs non-diabetic differences in disability among women were significant and decreased with increasing age; the exceptions to this were that by ages 70 and 80, differences in IADL disabled years between all diabetic and non-diabetic adults were no longer significant, and by ages 70 and 80, the difference in ADL disabled years was no longer significant.
DISCUSSION
Using a large, nationally representative cohort of Americans aged 50 years and older, we found that diabetes is associated with a substantial deterioration of non-disabled years and this is a greater number of years than on the loss of longevity associated with diabetes. On average, a middle-aged adult with diabetes has an onset of disability six to seven years earlier than one without diabetes, spends one to two more years with disability, and loses seven years of disability-free life to the condition. Although other nationally-representative studies have reported large reductions in complications9 and mortality among the diabetic population in recent decades1, these studies, akin to our results, suggest that diabetes continues to have a substantial impact on morbidity and quality of remaining years of life.
The differences in disability-free and disabled life years between persons with and without diabetes were driven by several factors. First, persons with diabetes had considerably higher disability incidence at all ages, leading to a younger age of disability onset and more years spent in a disabled state. Second, once a diabetic person became disabled, they were less likely to revert to regular functioning, therein increasing the number of years with disability. Third, diabetes and disability were each associated with increased mortality, which has a modest contradictory effect on the first two factors (i.e., incidence and remission of disability), as the increased mortality reduces the number of years spent in both a healthy and unhealthy state. Given this combination of factors, improving the number of disability-free life years over time will depend upon identification of interventions that can reduce disability and increase remission at least as much as mortality rates are being reduced.
The association of diabetes with disability has been found to be multifactorial(4; 16; 17). Previous studies have suggested that coronary heart disease, lower extremity arterial disease, and obesity explain a particularly large proportion of the difference in disability between persons with and without diabetes(4; 16; 18). However, these factors are likely to vary by gender, and numerous other factors, including physical inactivity, inflammatory factors, insulin resistance, and diabetes-related complications (such as neuropathy, kidney disease, stroke, hyperglycemia and hypoglycemia) may intervene. Our findings related to mortality are also consistent with national estimates that among older adults, diabetes is associated with 60-70% increases in mortality rates and 4.6-5.7 years of reduced lifespans(1). We are not aware of previous estimates of the rate of remission from disability, and it is noteworthy that people with diabetes were less likely to recover from disability, which could also be an indication that their levels of disability were somewhat more severe(19). Several recent developments in the epidemiology of diabetes complications from intervention studies have made disability-free and disabled years increasingly important metrics for assessing the impact of diabetes. While rates of complications have declined, the extra years of life spent with diabetes and cumulative morbidity that follows could erode the quality of those extra years of life. Also, older adults are the fastest growing segment of the diabetic population, raising the importance of physical disability and other geriatric syndromes that may result from or be associated with diabetes(20).
In addition, and perhaps most importantly, there is increasing evidence that disability is modifiable with lifestyle interventions(14; 21). The Look AHEAD Study found that intensive lifestyle intervention results in a 50% reduced incidence of physical disability among adults with diabetes(14). Similarly, the general effectiveness of similar interventions among older and overweight adults with osteoarthritis have found that structured exercise and moderate weight loss programs can improve functional status(22). In theory, many other aspects of risk factor modification initiated through primary care, including glycemic and blood pressure control, could also affect disability risk, but there has been little evaluation of the effects of such interventions on disability. We did not adjust for other risk factors for morbidity and mortality, such as hypertension, obesity, CHD and stroke, which were largely unbalanced among people with and without diabetes at baseline so that we could determine the overall differences in remaining disability life years and disability-free life years between those with and without diabetes. However, incidence of disability, remission from disability, and mortality changed only slightly when adjusting for prevalent CVD. Assessing the contribution of the specific related reason for the differences is warranted.
There are several limitations to this study. First, diabetes was based on self-report, which means that persons with undiagnosed diabetes were classified as non-diabetic; if their disability risk is higher than true non-diabetic adults, the difference in disability-free life years between diabetic and non-diabetic adults in our analyses would be underestimated. Our disability estimates are also based on subjective reports, for which interpretation and agreement with objective measurements could vary by diabetes status. Third, we could not distinguish between secondary diagnosis of diabetes and primary diagnosis due to the self-reporting of the diagnosis. Fourth, though the incident cases of diabetes were accounted for in the age-specific probabilities input into the Markov models, those models were designed to compare people with prevalent diabetes and those without prevalent diabetes who do not develop diabetes in their lifetime. Thus the final estimates should be interpreted with the assumption that diabetes status did not change at the specified age. Although the majority of persons without diabetes at age 70 will not develop diabetes, this ignores a substantial minority of persons who become incident diabetes cases after baseline. The group of people who go on to develop diabetes later are likely to have a number of disability-free and total years remaining that is intermediate between the groups with and without diabetes. Finally, our estimates did not adjust for potential intervening and confounding factors such as obesity, coronary heart disease, and lower extremity disease. However, the objective here was to quantify the basic differences in disability-free life years by diabetes status occurring in the U.S. population.
Despite these limitations, these analyses are the first ever quantification of disability-free and disabled years experienced after age 50 for the U.S. diabetic population, which incorporates information on disability incidence, disability remission, and mortality across older ages. As such, these findings are an important baseline from which to monitor the success of future clinical and public health efforts to reduce diabetes and its complications as well as interventions aimed directly at reducing disability.
Supplementary Material
Acknowledgments
Dr. Barbara H. Bardenheier is the guarantor of this work and, as such, had full access to all the data in the study and takes responsibility for the integrity of the data and the accuracy of the data analysis. We report potential conflicts of interest: X.Z. is currently working for Merck & Co., B.H.B-none, J.L-none, M.K.A.-none, E.W.G.-none, T.T.-none, Y.J.C.-none. B.H.B. conducted the data analysis, researched data, contributed to discussion, wrote the manuscript, and reviewed and edited the manuscript. E.W.G., J.L. and X.Z. researched data, contributed to discussion, wrote the manuscript, and reviewed and edited the manuscript. M.K.A., Y.J.C. and T.T. researched data, contributed to discussion, and reviewed and edited the manuscript. We also thank Tony Pearson-Clarke for help with editing.
Footnotes
Disclaimer
The findings and conclusions in this report are those of the authors and do not necessarily represent the official position of the Centers for Disease Control and Prevention.
References
- 1.Gregg EW, Zhuo X, Cheng YJ, Albright AL, Narayan KM, Thompson TJ. Trends in lifetime risk and years of life lost due to diabetes in the USA, 1985-2011: a modelling study. The lancet Diabetes & endocrinology. 2014;2:867–874. doi: 10.1016/S2213-8587(14)70161-5. [DOI] [PubMed] [Google Scholar]
- 2.Geiss LS, Wang J, Cheng YJ, Thompson TJ, Barker L, Li Y, Albright AL, Gregg EW. Prevalence and incidence trends for diagnosed diabetes among adults aged 20 to 79 years, United States, 1980-2012. Jama. 2014;312:1218–1226. doi: 10.1001/jama.2014.11494. [DOI] [PubMed] [Google Scholar]
- 3.Nathan DM. Long-term complications of diabetes mellitus. The New England journal of medicine. 1993;328:1676–1685. doi: 10.1056/NEJM199306103282306. [DOI] [PubMed] [Google Scholar]
- 4.Gregg EW, Beckles GL, Williamson DF, Leveille SG, Langlois JA, Engelgau MM, Narayan KM. Diabetes and physical disability among older U.S. adults. Diabetes care. 2000;23:1272–1277. doi: 10.2337/diacare.23.9.1272. [DOI] [PubMed] [Google Scholar]
- 5.Wong E, Backholer K, Gearon E, Harding J, Freak-Poli R, Stevenson C, Peeters A. Diabetes and risk of physical disability in adults: a systematic review and meta-analysis. The lancet Diabetes & endocrinology. 2013;1:106–114. doi: 10.1016/S2213-8587(13)70046-9. [DOI] [PubMed] [Google Scholar]
- 6.Lu FP, Lin KP, Kuo HK. Diabetes and the risk of multi-system aging phenotypes: a systematic review and meta-analysis. PloS one. 2009;4:e4144. doi: 10.1371/journal.pone.0004144. [DOI] [PMC free article] [PubMed] [Google Scholar]
- 7.Guralnik JM, Fried LP, Salive ME. Disability as a public health outcome in the aging population. Annual review of public health. 1996;17:25–46. doi: 10.1146/annurev.pu.17.050196.000325. [DOI] [PubMed] [Google Scholar]
- 8.Health Systems Performance Assessment: Debates, Methods and Empiricism. Geneva, Switzerland: 2003. [Google Scholar]
- 9.Gregg EW, Li Y, Wang J, Burrows NR, Ali MK, Rolka D, Williams DE, Geiss L. Changes in diabetes-related complications in the United States, 1990-2010. The New England journal of medicine. 2014;370:1514–1523. doi: 10.1056/NEJMoa1310799. [DOI] [PubMed] [Google Scholar]
- 10.Gregg EW, Cheng YJ, Saydah S, Cowie C, Garfield S, Geiss L, Barker L. Trends in death rates among U.S. adults with and without diabetes between 1997 and 2006: findings from the National Health Interview Survey. Diabetes care. 2012;35:1252–1257. doi: 10.2337/dc11-1162. [DOI] [PMC free article] [PubMed] [Google Scholar]
- 11.Juster F, Suzman R. An overview of the HRS. Journal of Human Resources. 1995;30:50. [Google Scholar]
- 12.University of Michigan. Health and Retirement Study: Sample Sizes and Response Rates. 2011 [Google Scholar]
- 13.RAND. RAND HRS data, version N. Santa Monica, CA: 2014. [Google Scholar]
- 14.Rejeski WJ, Ip EH, Bertoni AG, Bray GA, Evans G, Gregg EW, Zhang Q, Look ARG. Lifestyle change and mobility in obese adults with type 2 diabetes. The New England journal of medicine. 2012;366:1209–1217. doi: 10.1056/NEJMoa1110294. [DOI] [PMC free article] [PubMed] [Google Scholar]
- 15.Ross S. Introduction to probability models. Oxford, UK: Academic Press; 2014. [Google Scholar]
- 16.Volpato S, Blaum C, Resnick H, Ferrucci L, Fried LP, Guralnik JM, Women’s H, Aging S. Comorbidities and impairments explaining the association between diabetes and lower extremity disability: The Women’s Health and Aging Study. Diabetes care. 2002;25:678–683. doi: 10.2337/diacare.25.4.678. [DOI] [PubMed] [Google Scholar]
- 17.Kalyani RR, Saudek CD, Brancati FL, Selvin E. Association of diabetes, comorbidities, and A1C with functional disability in older adults: results from the National Health and Nutrition Examination Survey (NHANES), 1999-2006. Diabetes care. 2010;33:1055–1060. doi: 10.2337/dc09-1597. [DOI] [PMC free article] [PubMed] [Google Scholar]
- 18.Gregg EW, Mangione CM, Cauley JA, Thompson TJ, Schwartz AV, Ensrud KE, Nevitt MC, Study of Osteoporotic Fractures Research G Diabetes and incidence of functional disability in older women. Diabetes care. 2002;25:61–67. doi: 10.2337/diacare.25.1.61. [DOI] [PubMed] [Google Scholar]
- 19.Hardy SE, Gill TM. Recovery from disability among community-dwelling older persons. Jama. 2004;291:1596–1602. doi: 10.1001/jama.291.13.1596. [DOI] [PubMed] [Google Scholar]
- 20.Cheng YJ, Imperatore G, Geiss LS, Wang J, Saydah SH, Cowie CC, Gregg EW. Secular changes in the age-specific prevalence of diabetes among U.S. adults: 1988-2010. Diabetes care. 2013;36:2690–2696. doi: 10.2337/dc12-2074. [DOI] [PMC free article] [PubMed] [Google Scholar]
- 21.Pahor M, Guralnik JM, Ambrosius WT, Blair S, Bonds DE, Church TS, Espeland MA, Fielding RA, Gill TM, Groessl EJ, King AC, Kritchevsky SB, Manini TM, McDermott MM, Miller ME, Newman AB, Rejeski WJ, Sink KM, Williamson JD, investigators Ls Effect of structured physical activity on prevention of major mobility disability in older adults: the LIFE study randomized clinical trial. Jama. 2014;311:2387–2396. doi: 10.1001/jama.2014.5616. [DOI] [PMC free article] [PubMed] [Google Scholar]
- 22.Messier SP. Physical activity and weight loss interventions in older adults with knee osteoarthritis. North Carolina medical journal. 2007;68:436–438. [PubMed] [Google Scholar]
Associated Data
This section collects any data citations, data availability statements, or supplementary materials included in this article.