FIGURE 3.


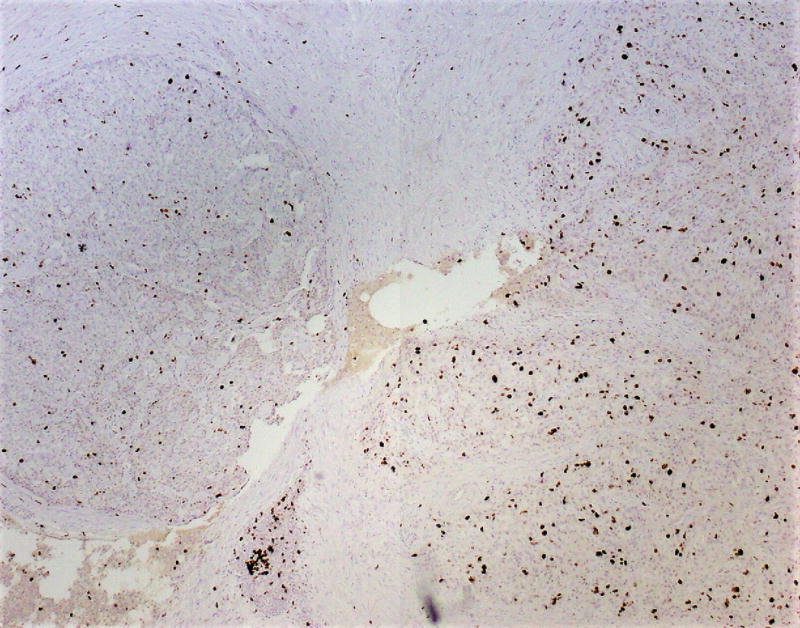
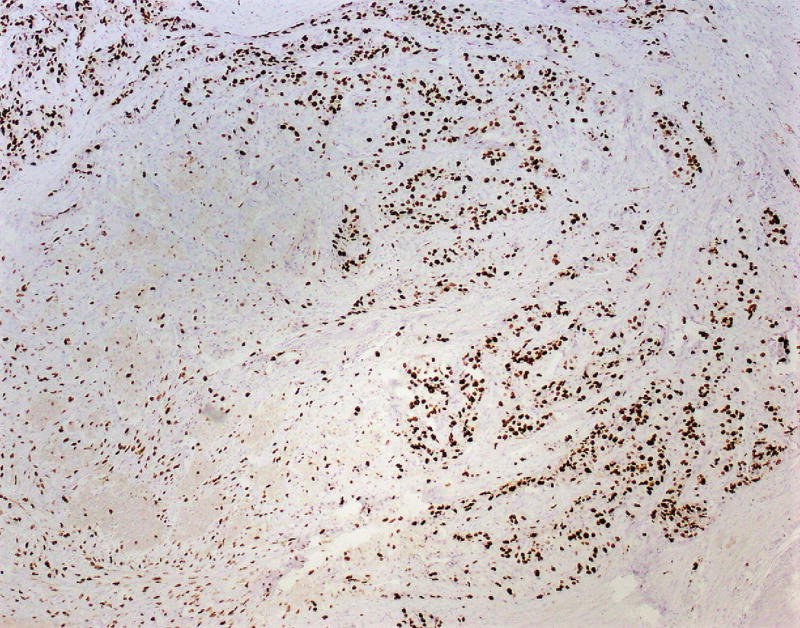
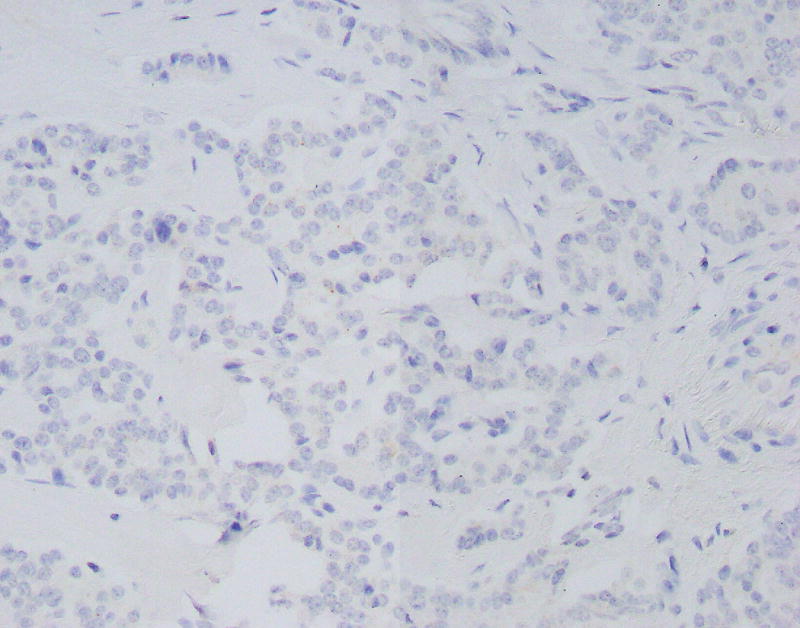
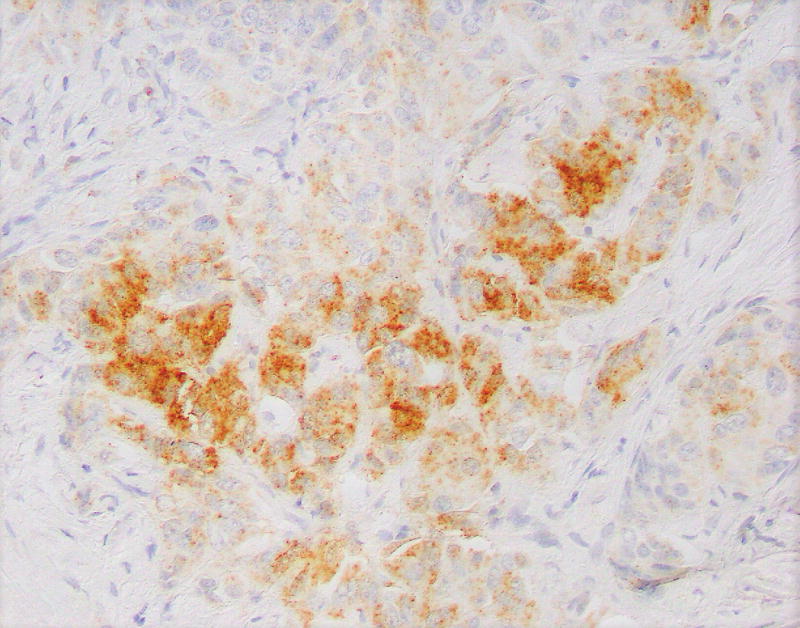
A, Ki-67 stain (low power), showing a low-grade area (left) and adjacent intermediate area (right). Proliferative indices in low power areas approached 5%, whereas the intermediate areas approached 22%. B, Ki-67 stain showing intermediate area (left) and adjacent high-grade area (right). Proliferative indices in high-grade areas approached 67%. C, Phosphorylated – Akt stain within a low-grade focus is mostly negative. D, Phosphorylated – Akt stain showing patchy strong expression in a high-grade focus of tumor.
