The inhibition of brassinosteroid biosynthesis via mutation or pharmacological approaches reduces root hydrotropic responses and H+ efflux in Arabidopsis.
Abstract
Plant roots respond to soil moisture gradients and remodel their growth orientation toward water through hydrotropism, a process vital for acclimation to a changing soil environment. Mechanisms underlying the root hydrotropic response, however, remain poorly understood. Here, we examined hydrotropism in 31 Arabidopsis (Arabidopsis thaliana) ecotypes collected from different parts of the world and grown along moisture gradients in a specially designed soil-simulation system. Comparative transcriptome profiling and physiological analyses were carried out on three selected ecotypes, Wassilewskija (Ws), Columbia (Col-0) (strongly hydrotropic), Col-0 (moderately hydrotropic), and C24 (weakly hydrotropic), and in mutant lines with altered root hydrotropic responses. We show that H+ efflux, Ca2+ influx, redox homeostasis, epigenetic regulation, and phytohormone signaling may contribute to root hydrotropism. Among phytohormones, the role of brassinosteroids (BRs) was examined further. In the presence of an inhibitor of BR biosynthesis, the strong hydrotropic response observed in Ws was reduced. The root H+ efflux and primary root elongation also were inhibited when compared with C24, an ecotype that showed a weak hydrotropic response. The BR-insensitive mutant bri1-5 displayed higher rates of root growth inhibition and root curvature on moisture gradients in vertical or oblique orientation when compared with wild-type Ws. We also demonstrate that BRI1 (a BR receptor) interacts with AHA2 (a plasma membrane H+-ATPase) and that their expression patterns are highly coordinated. This synergistic action may contribute to the strong hydrotropism observed in Ws. Our results suggest that BR-associated H+ efflux is critical in the hydrotropic response of Arabidopsis roots.
Plants have developed plastic growth responses to adjust to heterogenous and rapidly changing environmental stimuli. One critical such response is tropism, which is the reorientation of root growth that facilitates the acquisition of water and nutrients and perceives environmental cues such as gravity, light, physical touch, and moisture gradients (Hart, 1990; Eapen et al., 2005; Gilroy, 2008; Monshausen et al., 2008). Hydrotropism is the process whereby plant roots penetrate the soil in search of water, a response already documented in the 1700s (Dodart, around 1700; Sachs, 1872; Darwin, 1882; for review, see Hart, 1990). Gravitropism and phototropism have been studied extensively (Morita, 2010; Liscum et al., 2014). On the other hand, there are few studies on the mechanisms underlying hydrotropism, in particular at the molecular and genetic levels, due in large part to the difficulty of designing experimental systems that can reproducibly simulate the moisture gradients found in soils.
With the recent development and refinement of several hydrotropic experimental systems, the investigation of the molecular mechanisms underlying hydrotropism has become feasible (Takahashi and Suge, 1991; Takahashi and Scott, 1993; Eapen et al., 2003). Using such systems, relationships have been demonstrated between hydrotropism and phytohormones such as auxin (Takahashi et al., 2002; Kaneyasu et al., 2007), abscisic acid (ABA; Takahashi et al., 2002), and cytokinins (Saucedo et al., 2012) as well as cell production (Salazar-Blas et al., 2017) and other elements such as gravitropism (Takahashi et al., 2002). Most of these studies were carried out in Arabidopsis (Arabidopsis thaliana) by examining specific mutant lines or adding chemicals. Moreover, based on the ability of Arabidopsis seedlings to develop pronounced hydrotropic root curvature, forward genetic approaches have been carried out to screen and identify hydrotropism mutants in Arabidopsis. The first successful case was the isolation of a hydrotropic mutant, no hydrotropic response1 (nhr1); however, cloning of the NHR1 gene was not successful (Eapen et al., 2003). Subsequently, a series of hydrotropic Arabidopsis mutants termed mizu-kussei (miz) were isolated whose root curvature exhibited hydrotropism deficiencies, among which miz1 and miz2 were successfully cloned and characterized using a map-based approach (Kobayashi et al., 2007; Miyazawa et al., 2009; Moriwaki et al., 2011). Another mutant, altered hydrotropic response (ahr1), was described (Saucedo et al., 2012), but the AHR1 gene was not cloned.
Soil water availability is the main constraint for crop growth throughout the world, an issue greatly aggravated by climate change. A comprehensive investigation of the mechanisms of hydrotropism will contribute to the understanding of how plant roots sense and respond to moisture gradients. Despite the advances made by the studies mentioned above, our understanding of the molecular pathways and networks underpinning hydrotropism is still fragmented. In addition to mutagenic manipulations and screenings, a rich collection of Arabidopsis ecotypes harboring natural variation is a valuable resource with which to study hydrotropism at the mechanistic level. In this study, the hydrotropism response of 31 Arabidopsis ecotypes adapted to various moisture conditions around the world was characterized using a modified hydrotropic experimental system. Using this approach, we also performed a comparative transcriptome and ionome profiling of the ecotypes with the strongest Wassilewskija (Ws) and weakest (C24) hydrotropic responses as well as Col-0 (moderate hydrotropic response) and bri1-5 (a weak mutant allele of the brassinosteroid [BR] receptor gene). The transcriptomic and ionomic analyses suggest that H+ flux, redox homeostasis, and epigenetic regulation may contribute to the strong hydrotropic response observed in Ws. Furthermore, BR signaling was found to be central to the hydrotropic response in Arabidopsis (vertical orientation or oblique orientation), working in parallel to phytohormones such as auxin and ABA.
RESULTS
Evaluation of the Hydrotropic Experimental System
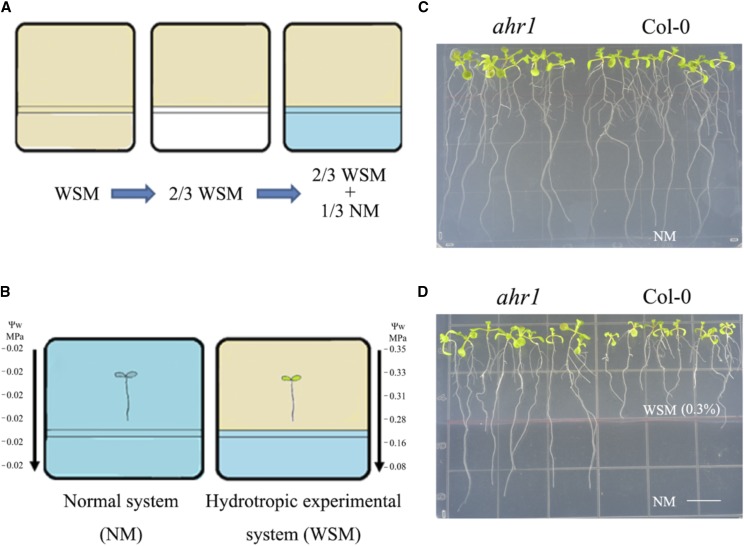
Previous mutant screens in Arabidopsis led to the isolation of several no/altered hydrotropic response mutants, including nhr1, miz1, and ahr1 (Eapen et al., 2003; Kobayashi et al., 2007; Saucedo et al., 2012). In this study, a modified hydrotropic experimental system (Fig. 1) with a different water potential gradient (from −0.35 to −0.08 MPa) was developed based on Saucedo et al. (2012). However, the water stress in our system (0.3% or 0.5% glycerol) differed from Sausedo’s system (2.5% glycerol; Fig. 1B). To evaluate the efficacy of the hydrotropic experimental system, ahr1 (an altered hydrotropic response mutant) and its background line Col-0 were used. When grown on the control NM, Col-0 and ahr1 showed the same root growth phenotypes (Fig. 1C). However, when exposed to the hydrotropic experimental system for 5 d (Fig. 1D), roots of ahr1 elongated from low water potential into high water potential, while wild-type Col-0 roots did not. This result is in agreement with those reported by Saucedo et al. (2012) and corresponds to the altered hydrotropic response phenotype reported previously for ahr1. In summary, the modified VHES with a different water potential gradient and lower glycerol is suitable for root hydrotropic studies.
Figure 1.
Description of the vertically oriented hydrotropic experimental system (VHES), and evaluation using Col-0 and the ahr1 mutant with altered hydrotropism. A and B, Diagrams illustrating the preparation and use of the system. First, the water stress medium (WSM), composed of normal medium (NM), 0.5% (v/v; for the preliminary hydrotropic response assay) or 0.3% (v/v; for further hydrotropic response assays) glycerol, and 0.1% (w/v) or 0.06% (w/v) alginic acid, respectively, was poured onto a plastic square petri plate. Following solidification, one-third of the WSM was cut away vertically and then filled with NM to the same thickness. After 1 d, a water potential gradient was set up on this agar plate. Five-day-old seedlings germinated on NM were transferred to WSM/NM in the hydrotropic experimental system. The root tips of seedlings were 1 cm above the interphase of both media. As a control, other seedlings were placed on square plates with two-thirds NM and one-third NM. C and D, The phenotypes of Col-0 and ahr1 seedlings in the NM (C) and WSM/NM (D) after 5 d.
Characterization of Hydrotropism in Arabidopsis Ecotypes
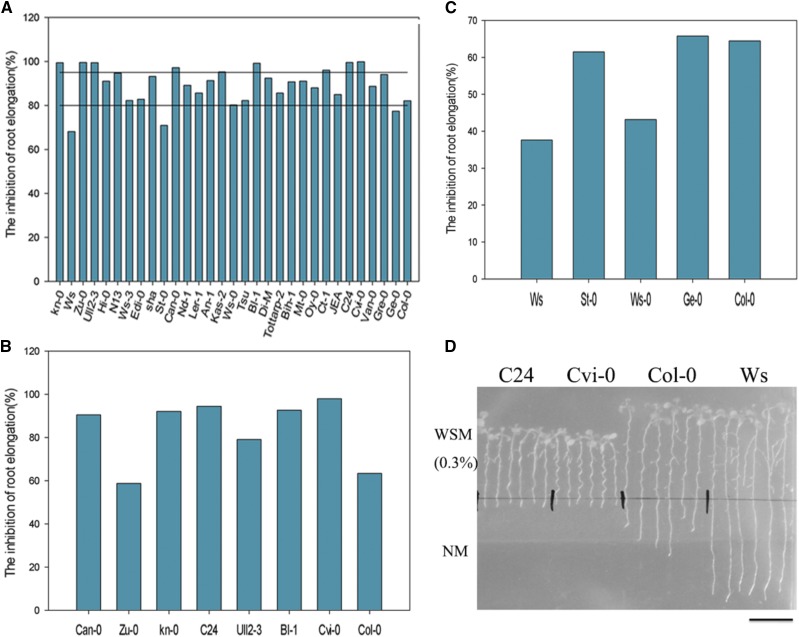
A preliminary characterization of hydrotropism in 31 Arabidopsis ecotypes was implemented in the hydrotropic experimental system with 0.5% glycerol. All Arabidopsis accessions showed suppression of root growth in the hydrotropic experimental system. However, the levels of root growth suppression varied among the accessions. After 5 d of treatment in the hydrotropic or control system, the ratio of root growth inhibition was calculated. The wild-type Col-0 showed an inhibition ratio of 82.15%. Two accessions, St-0 and Ws, displayed more positive hydrotropism than the wild type, as evident by their lower ratios of root growth inhibition: 70.89% and 68.09%, respectively. Conversely, Can-0 (97.19%), Bl-1 (99.19%), Ull2-3 (99.38%), Kn-0 (99.44%), Zu-0 (99.49%), C24 (99.5%), and Cvi-0 (99.9%) exhibited significantly higher inhibition ratios and even root growth arrest (Fig. 2; Supplemental Fig. S1). We defined hydrotropism levels in Arabidopsis ecotypes as follows: strong hydrotropism, with inhibition ratios < 75%; weak hydrotropism, with inhibition ratios > 85%; and moderate hydrotropism, with inhibition ratios between 75% and 85% (Table I). Subsequently, characterization of the hydrotropism in these 12 Arabidopsis ecotypes was performed in the hydrotropic experimental system with 0.3% glycerol. Among these accessions, C24 (94.38%) and Cvi-0 (97.97%) were the most susceptible to moisture gradients, displaying the highest ratios of root growth inhibition (Fig. 2, B–D; Supplemental Fig. S1B), whereas Ws showed the lowest inhibition ratio (37.64%; Fig. 2, C and D; Supplemental Fig. S1C). The hydrotropism of ecotypes correlated with their geographic distribution. For example, the strongly hydrotropic Ws originates from the relatively dry and cold Belarus, whereas C24 and Cvi-0 occur naturally in regions of high humidity (Portugal and Cape Verde, respectively; Table I).
Figure 2.
Characterization of hydrotropism in Arabidopsis ecotypes. A, Rates of root growth inhibition in 31 Arabidopsis ecotypes assessed in the VHES with 0.5% glycerol. The higher inhibition ratio for root elongation indicates the weaker hydrotropism of this ecotype. B and C, Rates of root growth inhibition of selected Arabidopsis ecotypes assessed in the VHES with 0.3% glycerol. D, Phenotypes of C24, Cvi-0, Col-0, and Ws seedlings in the VHES with 0.3% glycerol after 5 d. Bar = 10 mm.
Table I. The different Arabidopsis ecotypes used in this study.
The level of root hydrotropism was assessed as depicted in Figure 2.
| Accession | Stock No. | Origin | Hydrotropism Level |
|---|---|---|---|
| An-1 | CS944 | Belgium | Weak |
| Bl-1 | CS968 | Italy | Weak |
| Bih-1 | CS1030 | Czech Republic | Weak |
| Can-0 | CS1064 | Spain | Weak |
| Col-0 | CS1092 | United States | Moderate |
| Ct-1 | CS1094 | Italy | Weak |
| Cvi-0 | CS902 | Cape Verde | Weak |
| C24 | CS906 | Portugal | Weak |
| Di-M | CS919 | Russia | Weak |
| Edi-0 | CS1122 | United Kingdom | Moderate |
| Ge-0 | CS1187 | Switzerland | Moderate |
| Gre-0 | CS1210 | United States | Weak |
| Hi-0 | CS1226 | The Netherlands | Weak |
| JEA | CS76148 | France | Moderate |
| Kas-2 | CS1264 | India | Weak |
| Kn-0 | CS1286 | Lithuania | Weak |
| Ler-1 | CS1642 | Germany | Moderate |
| Mt-0 | CS1380 | Libya | Weak |
| Nd-1 | CS1630 | Germany | Weak |
| N13 | CS22491 | Russia | Weak |
| Oy-0 | CS1436 | Norway | Weak |
| Sha | CS929 | Tadjikistan | Weak |
| St-0 | CS1535 | Sweden | Strong |
| Tsu-0 | CS1564 | Japan | Moderate |
| Tottarp-2 | CS76251 | Sweden | Moderate |
| Ull2-3 | CS28791 | Sweden | Weak |
| Van-0 | CS1584 | Canada | Weak |
| Ws | CS28823 | Belarus | Strong |
| Ws-0 | CS28824 | Russia | Moderate |
| Ws-3 | CS28829 | Russia | Moderate |
| Zu-0 | CS1626 | Switzerland | Weak |
Global Analysis of RNA Sequencing Data
Three Arabidopsis ecotypes, C24, Col-0, and Ws, were chosen for transcriptomic analysis by RNA sequencing (RNA-seq), based on the phenotype characterization under control conditions (CK) or in the hydrotropic experimental system with 0.3% glycerol (water stress [WS]). For each of the six kinds of treatment processing (C24-CK, C24-WS, Col-0-CK, Col-0-WS, Ws-CK, and Ws-WS), once the low-quality reads were eliminated, over 4.7 × 10⁷ clean reads, representing 4.2 × 10⁹ nucleotides, were obtained (Supplemental Table S1). A high proportion of clean reads was aligned successfully to known Arabidopsis genes: 91.37% from C24-CK, 91.48% from C24-WS, 94.55% from Col-0-CK, 95.14% from Col-0-WS, 92.81% from Ws-CK, and 92.06% from Ws-WS. Additionally, new transcripts and alternative splicing transcripts were detected.
Identification of Differentially Transcribed Genes in the Hydrotropic Response between Arabidopsis Ecotypes
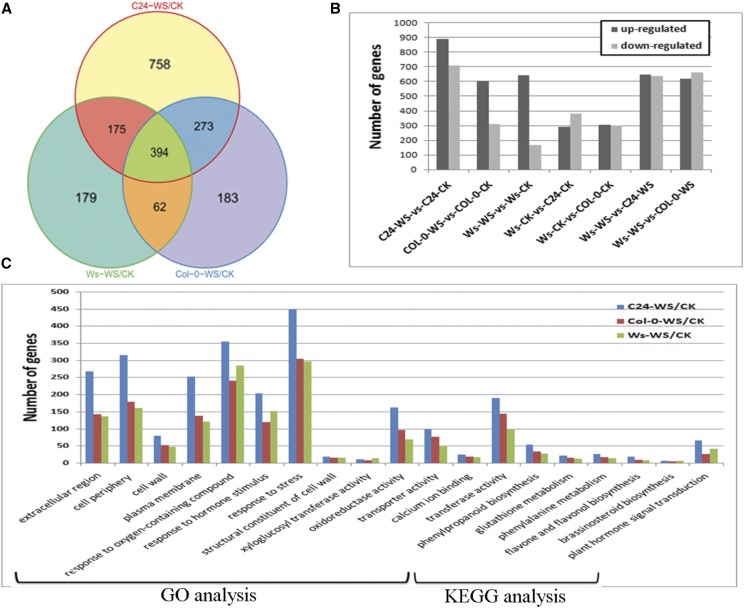
With respect to the hydrotropic response of the three Arabidopsis ecotypes, 2,024 genes in total were in the regulated category (Fig. 3A). Of these, 1,600 DTGs, including 892 up-regulated genes and 708 down-regulated genes, were discovered when C24 was exposed to the hydrotropic experimental system (Fig. 3B). A total of 912 genes displayed significant change in Col-0, of which 183 genes were exclusive to Col-0 (Fig. 3, A and B). In Ws, only 810 genes changed their expression levels. However, more than three-quarters of DTGs were up-regulated during the hydrotropic response in Ws, while only two-thirds of DTGs in Col-0 and one-half of DTGs in C24 were up-regulated. This result suggests that Ws is more adaptable to low moisture, consistent with its more vigorous roots in the hydrotropic experimental system (Fig. 3A). Therefore, we identified the DTGs between Ws and the other two accessions (Fig. 3B). In the control system, approximately 700 genes showed different transcript abundance between Ws and C24, whereas 1,288 genes showed different transcript abundance between these genotypes in the hydrotropic experimental system. Likewise, more DTGs were detected between Ws and Col-0 in the hydrotropic system than under control conditions. These specifically regulated genes in each ecotype and the DTGs among ecotypes give insight into why the three ecotypes exhibit different phenotypes in the hydrotropic experimental system. Furthermore, a subset of 17 genes was subjected to real-time quantitative PCR (RT-qPCR) to validate the RNA-seq data. These genes exhibited similar expression patterns in RT-qPCR and RNA-seq analyses (Supplemental Fig. S2).
Figure 3.
Classification of differentially transcribed genes (DTGs) during the hydrotropic response. A, Venn diagram of DTGs during the hydrotropic response among C24, Col-0, and Ws ecotypes. B, Numbers of DTGs during the hydrotropic response among C24, Col-0, and Ws ecotypes. C, Functional classification (GO) and pathway analysis (Kyoto Encyclopedia of Genes and Genomes [KEGG]) of DTGs during the hydrotropic response among C24, Col-0, and Ws ecotypes.
Functional Classification and Pathway Enrichment Analysis of DTGs Reveal a Common Mechanism of Hydrotropic Response in Arabidopsis
DTGs of each Arabidopsis ecotype undergoing a hydrotropic response were functionally classified according to Gene Ontology (GO) terms (Fig. 3C). DTGs were functionally annotated and clustered in three ontologies: cellular component, biological process, and molecular function. In the cellular component category, the components with the largest number of DTGs in all three accessions were extracellular region, cell wall, and membrane (Supplemental Fig. 3C). For example, 315 DTGs in C24-WS/C24-CK, 179 DTGs in Col-0-WS/Col-0-CK, and 161 DTGs in Ws-WS/Ws-CK were assigned to the cell periphery. Among these, metabolic enzymes (such as AT3G48520 and AT1G09750), transporters (such as AT5G49630 and AT5G59520), and calmodulin-like proteins (such as AT1G76650 and AT5G37770) were identified, indicating a fundamental role of these biological components in maintaining osmotic equilibrium and signal transduction in the hydrotropic response. In terms of biological process, a large proportion of DTGs were classified in the abiotic response and hormone stimulus categories. Although MIZ1 is important for Arabidopsis root hydrotropism, Moriwaki et al. (2010) showed that MIZ1 was not expressed in Arabidopsis roots subjected to a moisture gradient system (agar-air-K2CO3). In our transcriptome analysis, MIZ1 expression also was not detected in Arabidopsis roots under VHES. The MIZ1 protein sequence was recently added to TAIR (http://www.arabidopsis.org/servlets/TairObject?type=aa_sequence&id=1009113398), and the regulation of MIZ1 might happen at the protein level.
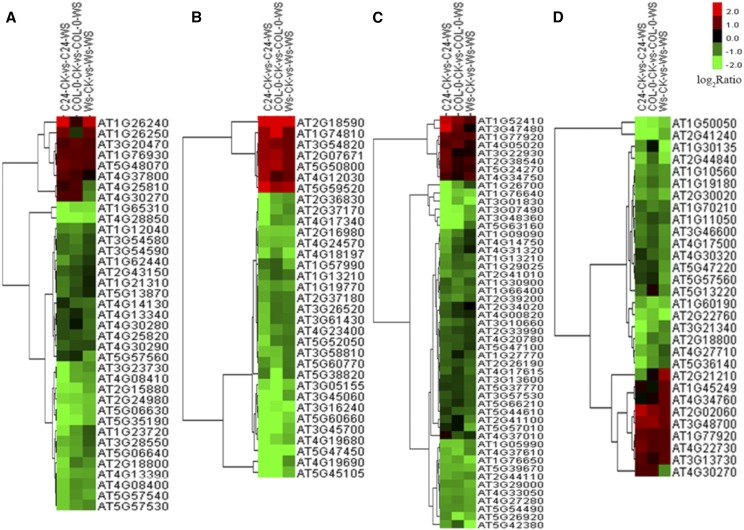
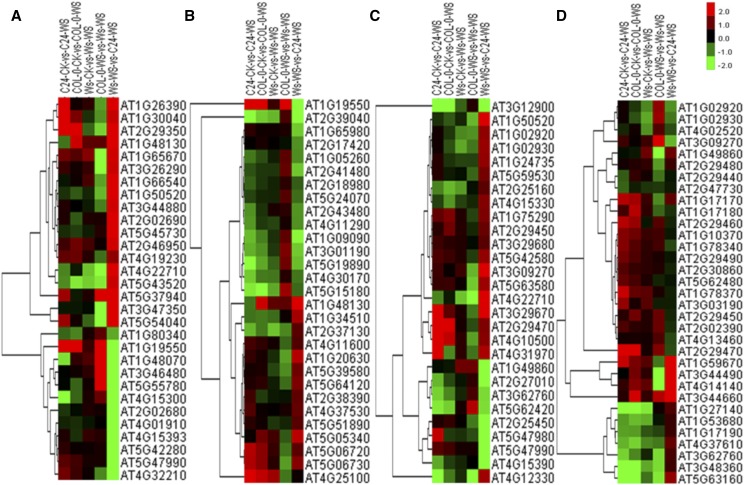
Through analysis of the molecular function categories, four classes of DTGs seem to contribute to the hydrotropic response in all three Arabidopsis ecotypes. DTGs related to cell wall, including the subterms structural constituent of cell wall, xyloglucan xyloglucosyltransferase activity, and xyloglucan endotransglucosylase activity, were enriched (Figs. 3C and 4A). For example, among the 33 genes annotated as structural constituent of cell wall in the Arabidopsis genome, the expression of 19 genes in C24, 15 genes in Col-0, and 16 genes in Ws was altered during the hydrotropic response. DTGs in other categories related to oxidoreductase activity, peroxidase activity, and antioxidant activity also were involved in the hydrotropic response (Figs. 3 and 7). This result is consistent with previous studies indicating the importance of redox homeostasis and reactive oxygen species (ROS) scavenging under abiotic stress (Apel and Hirt, 2004; Liu et al., 2014). Moreover, DTGs encoding channel proteins and transporters, especially for transmembrane water transport, were strongly associated with the hydrotropic response in the GO analysis (Figs. 3C and 4B). For example, AtTIP2;1 (AT3G16240) and AtPIP2;4 (AT5G60660) encoding aquaporins both displayed an approximately 3-fold (log2) up-regulation in the three accessions exposed to the hydrotropic experimental system. Finally, DTGs related to calcium signaling, including the terms calmodulin binding and calcium ion binding, also were enriched during the hydrotropic response (Figs. 3C and 4C).
Figure 4.
Cluster analyses of DTGs involved in shared pathways among C24, Col-0, and Ws ecotypes. DTGs involved in cell wall homeostasis (A), transporters (B), Ca2+ signaling (C), and phytohormone synthesis and signal transduction (D) are shown. In the heat maps, red indicates up-regulated genes, green indicates down-regulated genes, and black indicates a lack of significant expression change during the hydrotropic response.
Figure 7.
Cluster analyses of eDTGs involved in Ws-specific pathways. eDTGs involved in peroxidase activity (A), oxidoreductase activity (B), antioxidant metabolism (C), and transferase activity (D) are shown. Red indicates up-regulation of genes, green indicates down-regulation of genes, and black indicates a lack of significant expression change.
A pathway enrichment analysis was undertaken using the KEGG system (Fig. 3C). The results suggest that pathways involved in antioxidant metabolism, such as phenylpropanoid biosynthesis and glutathione metabolism, are vital for the hydrotropic response in the three Arabidopsis accessions used in this study (Fig. 7). It has been reported that a suite of phytohormones, including auxin (Takahashi et al., 2002; Kaneyasu et al., 2007), ABA (Takahashi et al., 2002), and cytokinins (Saucedo et al., 2012), play important roles in the hydrotropic response. In this study, the transcriptional profiles of genes related to phytohormone synthesis and signal transduction, for example AtSAUR6 (AT2G21210, involved in auxin signal transduction), AtABF2 (AT1G45249, involved in ABA signal transduction), and AtJAZ8 (AT1G30135, involved in jasmonic acid signal transduction), were affected during the hydrotropic response (Figs. 3C and 4D).
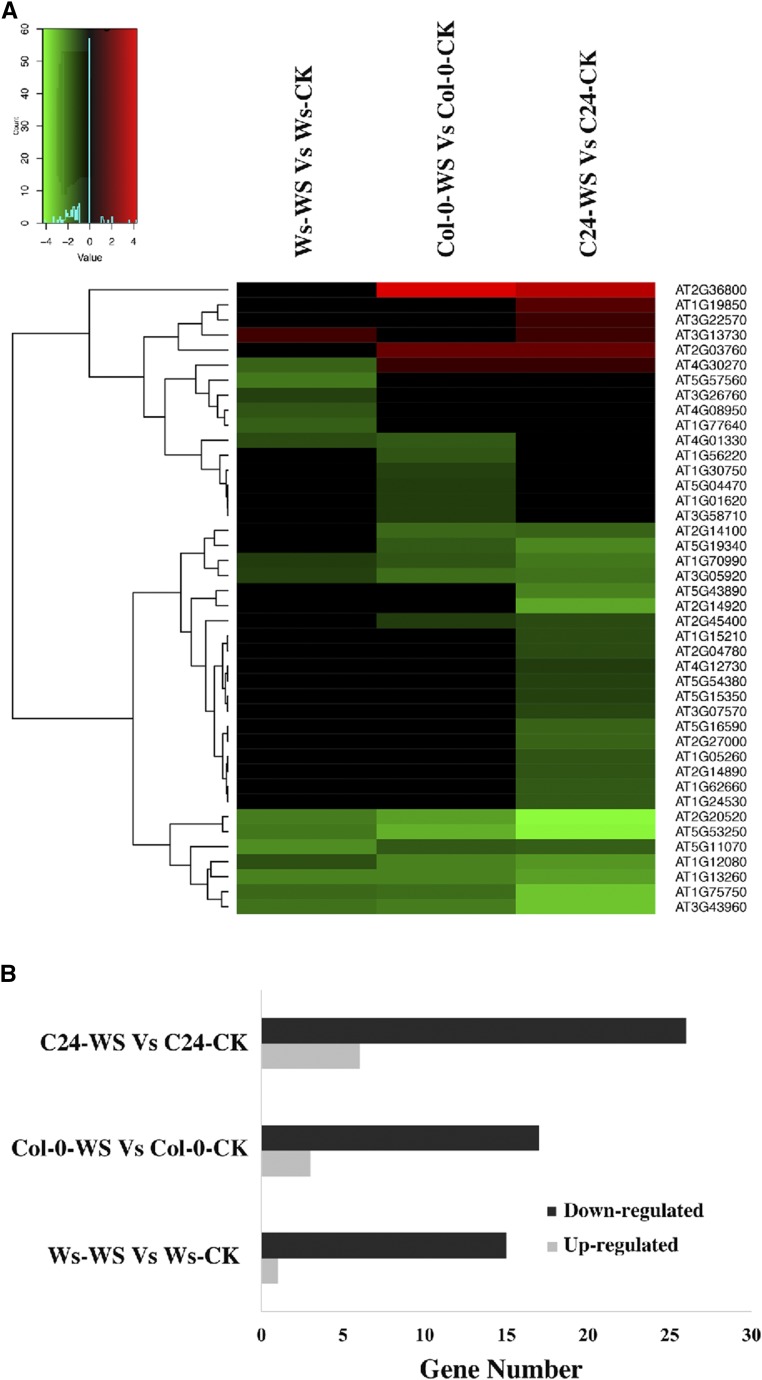
Intriguingly, the KEGG analysis suggests that BRs are essential for the hydrotropic response. A member of the cytochrome P450 family (AT2G14100) involved in BR biosynthesis (Fig. 5A) and a set of kinases similar to BRI1 Associated Receptor Kinase1/Brassinosteroid Insensitive1 (BAK1/BRI1) were differentially transcribed. In addition, DTGs including AtTCH4 (AT5G57560, a xyloglucan endotransglucosylase) and AtCYCD1;1 (AT1G70210, a d-type cyclin that interacts physically with CDC2A) were enriched during the hydrotropic response (Figs. 4 and 5A). These genes encode downstream components of the BR signal transduction pathway for cell elongation and cell division. These results reveal that BRs are an important factor in the root hydrotropic response in Arabidopsis (Figs. 3–5).
Figure 5.
Identification of BR-related genes in root hydrotropism. A, Heat map chart derived from hierarchical cluster analysis of BR-related genes that were differentially regulated in our microarray results. Each row represents a gene, and each column indicates Ws-WS versus Ws-CK, Col-0-WS versus Col-0-CK, and C24-WS versus C24-CK. Red and green indicate up- and down-regulation compared with the control, respectively, while black indicates no change. B, Number of BR-related genes in Ws-WS versus Ws-CK, Col-0-WS versus Col-0-CK, and C24-WS versus C24-CK. Down-regulated and up-regulated genes are shown in black and gray, respectively.
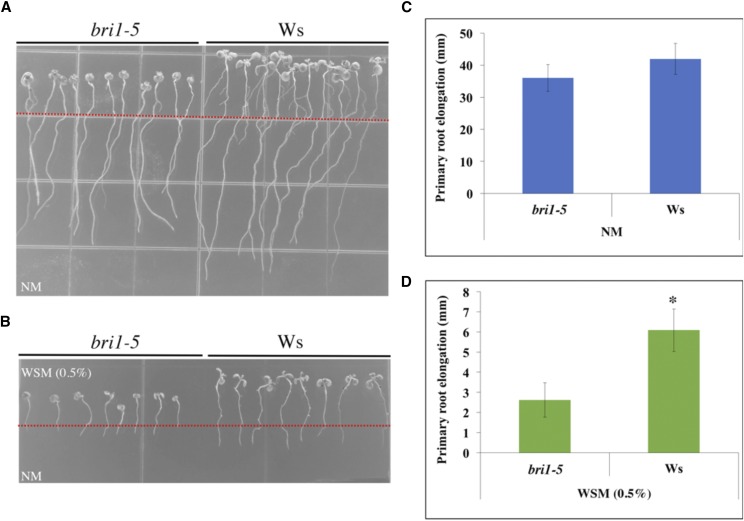
The results of a root growth analysis of a BR-related mutant confirmed the microarray results. BRI1 is a cell-surface receptor in BR signaling and downstream signal transduction in plants. Furthermore, BRI1 plays key roles in the BR-dependent pathway regulating plant growth and stress responses. bri1-5 is a weak mutant allele of the BR receptor gene BRI1. bri1-5 displayed much more pronounced inhibition of primary root elongation than its wild-type Ws when subjected to water stress gradients (Fig. 6). This result indicates that the BR-related signal transduction pathway is involved in the Arabidopsis root hydrotropic response.
Figure 6.
Characterization of wild-type (Ws) and bri1-5 seedlings in the VHES with 0.5% glycerol. A and B, Phenotypes of Ws and bri1-5 grown on normal growth medium (A) and the VHES with 0.5% glycerol (B). C, Measurements of seedling primary root elongation shown in A. D, Measurements of seedling primary root elongation shown in B. Red lines indicate the original positions of root tips when transferring from Murashige and Skoog medium. Error bars represent sd (n = 8 in three independent experiments). *, P < 0.001 when analyzed by Student’s t test.
Specific Genes and Pathways in the Ws Ecotype
As outlined above, 1,288 genes showed significant expression difference between Ws-WS and C24-WS and 1,283 showed significant expression difference between Ws-WS and Col-0-WS. These were designated eDTGs in the Ws ecotype. Subsequently, these eDTGs were subjected to GO and KEGG analysis to obtain a better understanding of the mechanism underpinning the strong hydrotropism observed in Ws. A considerable number of eDTGs were assigned to the term oxidoreductase activity: 178 in Ws-WS versus C24-WS and 132 in Ws-WS versus Col-0-WS (Fig. 7A). In addition, multiple genes encoding enzymes involved in phytohormone modification, including AtGA2OX2 (AT1G30040, a gibberellin 2-oxidase), AtGA4H (AT1G80340, a gibberellin 3β-hydroxylase), and AtCYP707A1 (AT4G19230, an ABA 8′-hydroxylase), were differentially expressed in Ws-WS compared with C24-WS and Col-0-WS (Fig. 7A).
Krieger et al. (2016) suggested that ROS responses play an important role in root hydrotropism. Our results showed that eDTGs related to peroxidase activity and antioxidant activity also were enriched. For example, the expression of AtRBOHB (AT1G09090), AtPER1 (AT1G48130, a thioredoxin peroxidase), and AtPRX52 (AT5G05340) was up-regulated (Fig. 7B). Another category enriched for eDTGs, especially between Ws-WS and C24-WS, was transferase activity. A substantial number of eDTGs involved in glutathione transferase, glycosyltransferase, and sulfotransferase, enzymes that play a role in redox homeostasis and abiotic stress responses, were enriched. Intriguingly, the expression of AtMET2 (AT4G14140, a DNA cytosine-5-methyltransferase), AtSUVH9 (AT4G13460, a histone methyltransferase), AtHDA17 (AT3G44490, a histone deacetylase), and AtHDA10 (AT3G44660, a histone deacetylase) was altered significantly (Fig. 7D). Further analysis revealed that eDTGs also included epigenetic factors, such as AtRDM1 (AT3G22680, involved in RNA-directed DNA methylation), pointing at important differences in epigenetic modification that may contribute to the different hydrotropic responses observed among the three Arabidopsis accessions. Furthermore, eDTGs involved in the antioxidant metabolism pathway, such as AtGSTU8 (AT3G09270, a glutathione transferase) and AtFLS2 (AT5G63580, a flavonol synthase), were uncovered by KEGG analysis (Fig. 7C). These results suggest that a more balanced ROS level and a more dynamic antioxidant metabolism exist in Ws and may be associated with strong hydrotropism.
H+, H2O2, and Ca2+ Fluxes along the Root Tips of Three Arabidopsis Ecotypes
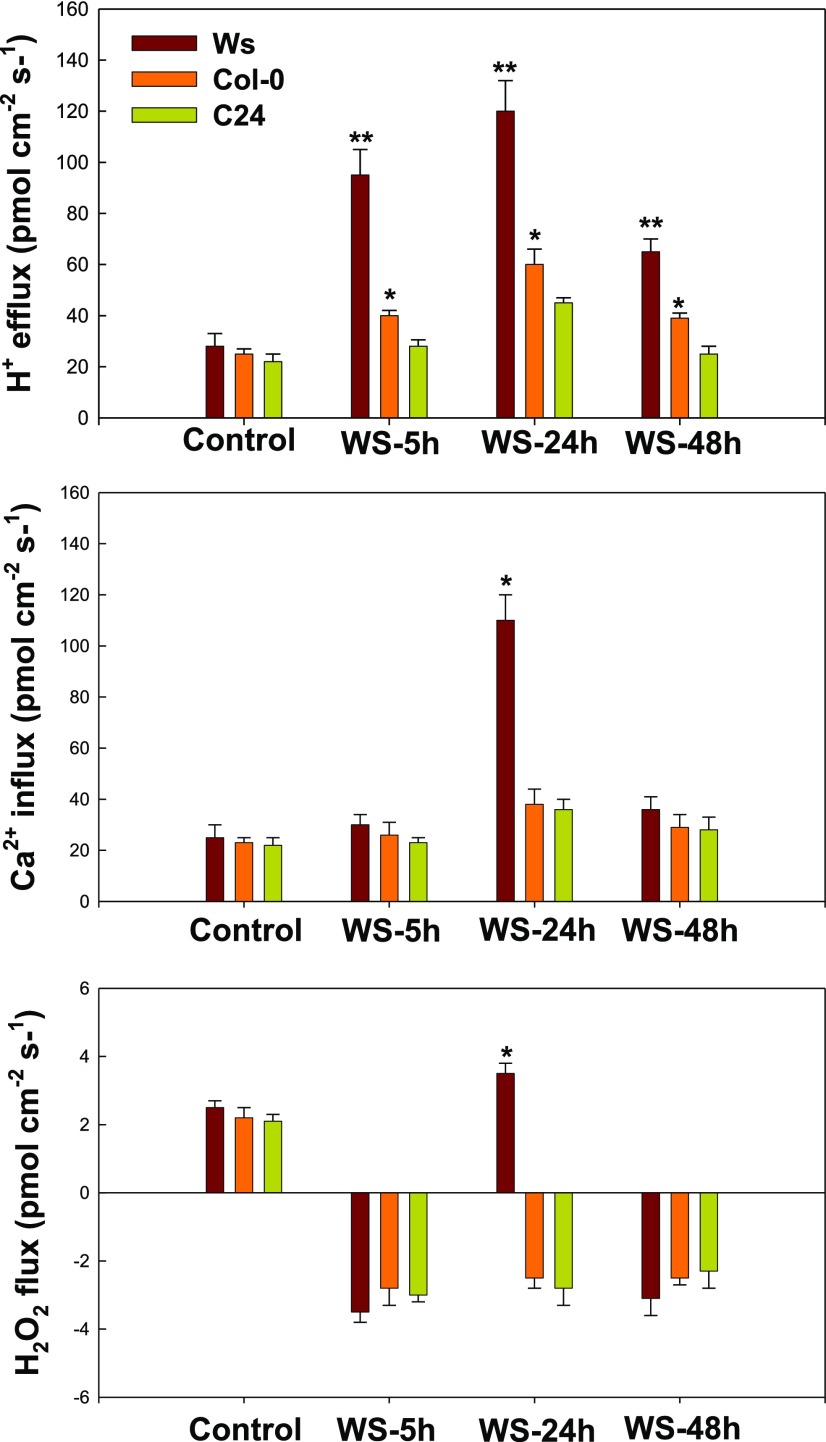
The RNA-seq results suggest that the apoplast, including the extracellular region, cell periphery, and cell wall, may be important in the Arabidopsis hydrotropic response. In addition, genes coding for cation transporters, components of calcium signaling, and oxidoreductases involved in redox homeostasis and ROS scavenging were regulated significantly during the hydrotropic response. Therefore, we measured H+, H2O2 (one of the key factors involved in ROS signaling), and Ca2+ fluxes along the root tips of the three accessions, concentrating on the elongation zone (520–850 μm from the root cap junction) under VHES. There were no significant differences in H+, H2O2, or Ca2+ flux (influx or efflux) among three accessions grown under control conditions (Fig. 8). However, when seedlings of the three accessions were challenged in the hydrotropic experimental system, divergences in fluxes were detected in the elongation zone. H+ efflux was intensified, with the following rank: Ws > Col-0 > C24 (Fig. 8). The influx of Ca2+ in Ws was higher than in Col-0 or C24 (Fig. 8). Regarding H2O2 flux, root tips grown under control conditions excluded H2O2, whereas H2O2 influx was seen in all three accessions when exposed to the hydrotropic experimental system for 5 or 48 h. Moreover, when grown in the hydrotropic experimental system for 24 h, Ws root tips secreted H2O2, whereas influx was seen in C24 and Col-0 (Fig. 8). H+ efflux in Ws was consistently higher than that of Col-0 or C24 under water stress (VHES), whether observed for 5, 24, or 48 h.
Figure 8.
H+, Ca2+, and H2O2 fluxes in the root tip (600–800 μm from the root cap junction) of three Arabidopsis ecotypes under control and WS conditions for 5, 24, and 48 h. Control, The normal system; WS, the VHES with 0.3% glycerol. The values are means, and error bars show sd of six replicates from two independent experiments. Student’s t test was performed (P < 0.001). *P < 0.05 or **P < 0.01 by Student's t-test.
Effect of BR on H+ Efflux-Regulated Primary Root Elongation and Curvature
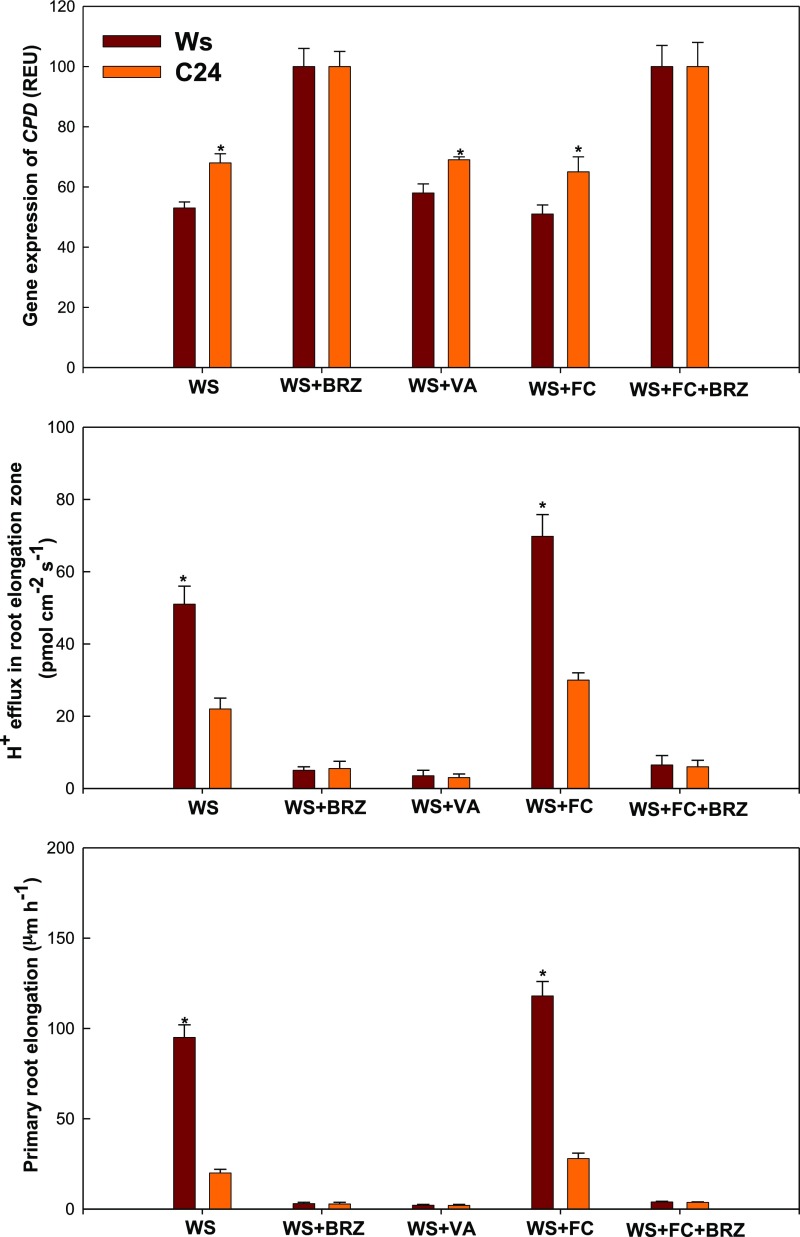
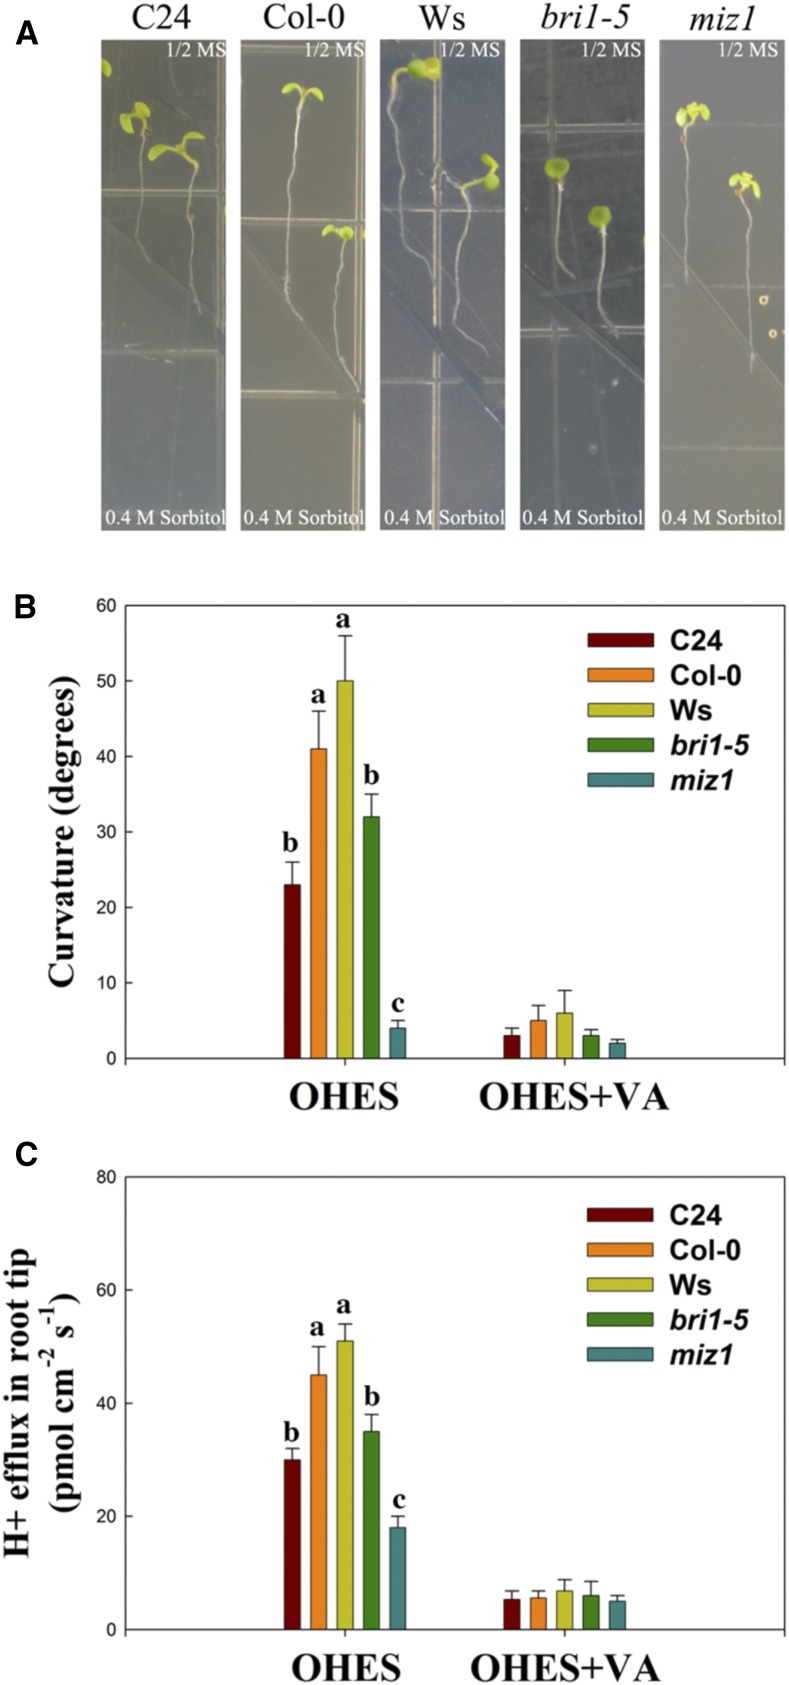
Previous studies (Xu et al., 2013; Wei and Li, 2016) and our results (Figs. 6 and 8) show that BR and H+ efflux play important roles in root growth under environmental stress. Thus, we investigated the effect of BR on H+ efflux-regulated primary root elongation in VHES. Plants were subjected to 0.5% glycerol (water stress) and the following pharmacological treatments: brassinazole (BRZ), an inhibitor of BR biosynthesis; Vanadate (VA; a PM H+-ATPase inhibitor); and Fusicoccin (FC: a PM H+-ATPase activator). In water stress, primary root elongation and H+ efflux in the root elongation zone were higher than in C24 (Fig. 9). CPD is one of the key BR biosynthetic genes, but its transcript level is negatively correlated with BR level (Oh et al., 2012). The expression of CPD in Ws was lower than in C24. Under WS plus BRZ, no significant difference was found in root elongation, H+ efflux, or CPD expression between Ws and C24. Under water stress plus VA, no significant difference was seen in root elongation or H+ efflux between Ws and C24. However, the expression of CPD in Ws was lower than in C24 under water stress plus VA. Under water stress plus FC, primary root elongation and H+ efflux in the root elongation zone in Ws were higher than in C24, and CPD expression in Ws was lower than in C24. Under water stress plus FC and BRZ, no significant difference was found in root elongation, H+ efflux, or CPD expression between Ws and C24. Next, we investigated the effect of H+ efflux on the root curvature of C24, Col-0, Ws, bri1-5, and miz1 plants under an obliquely oriented hydrotropic experimental system (OHES) according to Takahashi et al. (2002). When compared with C24, Col-0, Ws, and bri1-5, the roots of miz1 did not curve under OHES (Fig. 10). The root curvature and H+ efflux of Ws were the strongest among these Arabidopsis accessions (Ws, Col-0, and C24) under OHES. The root curvature and H+ efflux of Col-0 were moderate, and the root curvature and H+ efflux of C24 were the weakest. When compared with its wild-type Ws, the root curvature and H+ efflux of bri1-5 were lower. Furthermore, under OHES with VA, H+ efflux in all Arabidopsis accessions tested was decreased greatly. The decreasing trend in root curvature was consistent with the decrease in H+ efflux. These results show that BRs affect H+ efflux-regulated primary root elongation and curvature in VHES and OHES.
Figure 9.
CPD expression, H+ flux, and primary root elongation in two Arabidopsis ecotypes (Ws and C24) in the VHES with 0.5% glycerol (WS) and pharmacological treatment (BRZ, an inhibitor of BR biosynthesis; VA, a PM H+-ATPase inhibitor; and FC, a PM ATPase stimulator). *, P < 0.001 when analyzed by Student’s t test. REU, Relative expression units.
Figure 10.
Hydrotropic responses and H+ fluxes of C24, Col-0, Ws, bri1-5, and miz1 seedlings. A, Hydrotropic phenotypes of C24, Col-0, Ws, bri1-5, and miz1 seedlings in the OHES for 18 h. 1/2 MS, One-half-strength Murashige and Skoog medium. B and C, The curvature degrees and H+ effluxes in the root tip (600–800 μm from the root cap junction) of these Arabidopsis plants were analyzed under OHES in the presence or absence of VA (a PM H+-ATPase inhibitor). The values shown are means, and error bars represent sd of six replicates from two independent experiments. *, P < 0.001 when analyzed by Student’s t test.Lowercase letters indicate significant differences at (P < 0.05).
Interaction between BRI1 and AHA2
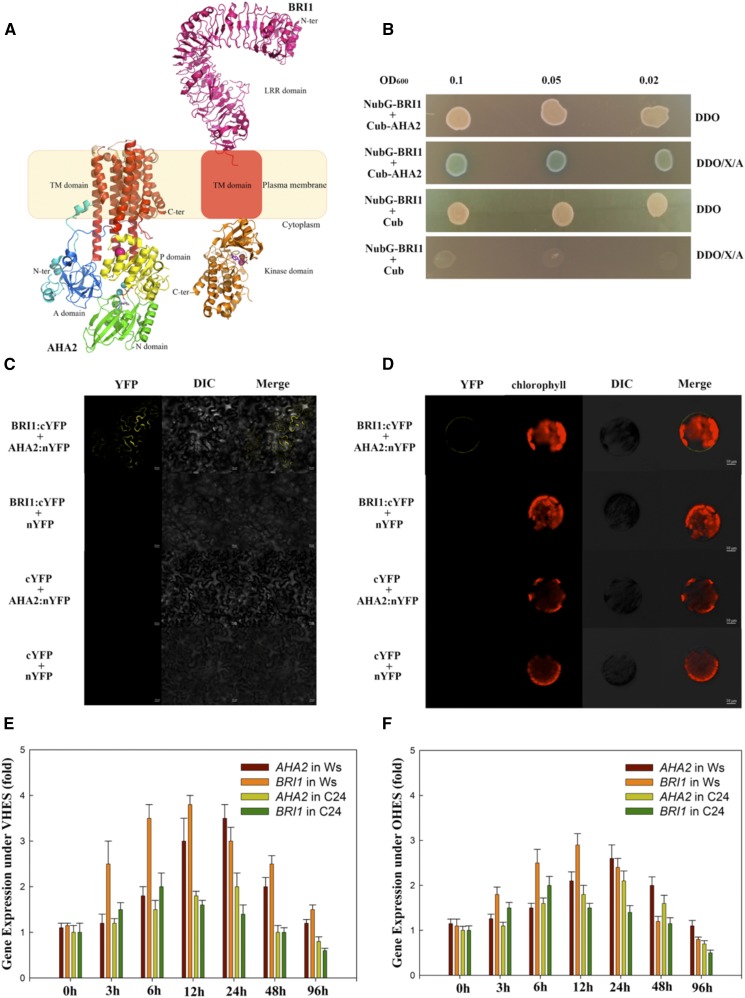
Caesar et al. (2011) showed that BRI1 interacts with AHA1 (Arabidopsis PM H+-ATPase1) in vivo and that activation of the PM H+-ATPase requires BRI1 activity. When compared with other Arabidopsis PM H+-ATPase family members, the expression of AHA2 was increased greatly under VHES and OHES (Supplemental Fig. S4). A phylogenetic analysis of PM H+-ATPase gene family members (AHA1–AHA11) showed that AHA2 and AHA1 belong to the same group (Supplemental Fig. S4). Thus, we investigated the interaction and coordinated expression of BRI1 and AHA2 in Arabidopsis plants. First, crystal structure modeling (Fig. 11A) showed that BRI1 and AHA2 are located in the PM, which is in agreement with Caesar et al. (2011) and Yuan et al. (2017). Second, yeast two-hybrid (Y2H) and bimolecular fluorescence complementation (BiFC; Fig. 11, B–D) analyses showed that BRI1 interacts with AHA2 in vivo. Finally, we checked the expression of BRI1 and AHA2 under VHES or OHES (Fig. 11, E and F). The expression levels of BRI1 and AHA2 were higher in Ws than in C24, and their expression in Ws was more coordinated than that in C24.
Figure 11.
Interactions and synergistic actions of BRI1 (a BR receptor) and AHA2 (a PM H+-ATPase) under VHES and OHES. A, BRI1 and AHA2 were located in the PM. TM, Transmembrane. B, Split-ubiquitin Y2H assay for the interaction between BRI1 and AHA2. DDO, Double Dropouts; X, X-α-Gal; A, Aureobasidin A. C and D, BiFC assays showing in vivo interactions of BRI1 with AHA2 in tobacco (Nicotiana tabacum) leaf epidermal cells (C) and Arabidopsis protoplasts (D). All the images were taken by confocal microscopy. DIC, Differential interference contrast. Bars = 20 μm (C) and 10 μm (D). E and F, Gene relative expression of AHA2 or BRI1 in Arabidopsis root tips (5 mm from the root cap junction) of Ws and C24 under VHES (E) and OHES (F). Relative gene expression of AHA2 or BRI1 in C24 under VHES or OHES, respectively, is considered as 1-fold. The values shown are means, and error bars represent sd of six replicates from two independent experiments. Changes in the relative expression levels of a gene were checked for statistical significance according to Student’s t test (P < 0.05).
DISCUSSION
Studies in root hydrotropism have been carried out not only in setups with vertical orientation but also in setups with oblique orientation (Takahashi et al., 2002; Kobayashi et al., 2007; Miyazawa et al., 2009; Saucedo et al., 2012; Salazar-Blas et al., 2017). Under water stress, root elongation is important for acquiring water in a vertical orientation (Saucedo et al., 2012); on the other hand, root bending also is important for finding water under water stress from an oblique orientation (Takahashi et al., 2002). Gravity affects the growth of most plants, creating an interplay between hydrotropism and gravitropism. However, compared with gravitropism, the tropic response of the root to asymmetric water availability in a vertical or oblique orientation requires a very different physiological mechanism to maintain water uptake (Krieger et al., 2016; Dietrich et al., 2017). Thus, in our study, we investigated root hydrotropism in different Arabidopsis ecotypes and genetically modified Arabidopsis lines in both vertical and oblique orientations and in response to water stress under identical gravitropism conditions.
The Development of Hydrotropic Experimental Systems Promotes the Understanding of Plant Hydrotropism
Several successful hydrotropic experimental systems have been established. Initially, a simple system with agar and salt solution was described by Takahashi and Suge (1991) and Takahashi and Scott (1993) and subsequently developed for a genetic screen (Takahashi et al., 2002). Using this system, a series of hydrotropism mutants of Arabidopsis were isolated, termed miz, whose roots exhibited deficient hydrotropism (Kobayashi et al., 2007; Miyazawa et al., 2009). Another system with plain agar and sorbitol-agar was presented by Takahashi et al. (2002). An improvement of this system was obtained by optimizing the osmolytes that establish water potential gradients, and glycerol combined with sodium alginate (to improve medium solidification) was found to be optimal (Eapen et al., 2003). Utilizing this system, hydrotropic mutants such as nhr1 were identified. However, those hydrotropism screening systems were prone to favor the negative hydrotropic response instead of the positive response. In this study, a modified hydrotropic experimental system, based on Saucedo et al. (2012), was developed. Water gradients were generated by the difference between the upper part of the system, containing a low water potential, and the lower part with a high water potential, analogous to what would be encountered during the drying of soil (Fig. 1). The Arabidopsis mutant ahr1 showed the same hydrotropic phenotype in our hydrotropic experimental system as that of Saucedo et al. (2012), demonstrating the utility of the system (Fig. 1, C and D). We then expanded the use of the system to characterize hydrotropism in 31 Arabidopsis ecotypes, and, as a result of the initial screen, ecotypes with a strong, moderate, or weak hydrotropic response were determined (Fig. 2; Table I). The root gravitropic responses of C24, Col-0, and Ws seedlings in normal and water stress media were analyzed (Supplemental Fig. S5). No significant difference in root gravitropic response was found among these Arabidopsis accessions. These results illustrate the extensive potential of this system for genetic screening of both positively or negatively hydrotropic mutants, which could improve our understanding of plant hydrotropism.
Redox Homeostasis and Epigenetic Regulation Involved in the Strong Hydrotropic Response of the Ws Ecotype
ROS have been acknowledged as key players in the complex signaling network of cells, while a high level of ROS will lead to toxic effects, ultimately triggering cell death (Mittler et al., 2011; Baxter et al., 2014). The dual function of ROS implies that its cellular concentration has to be tightly controlled by redox homeostasis involving various components of the plant antioxidant apparatus (Apel and Hirt, 2004; Liu et al., 2014). When plants were challenged in our hydrotropic experimental system, several genes involved in redox homeostasis and antioxidant metabolism showed differential expression in the Ws ecotype compared with C24 and Col-0 (Fig. 7, A–C). H2O2 efflux was observed in the Ws root system during the hydrotropic response, whereas influx was documented in C24 and Col-0 (Fig. 7C). These results imply that a more balanced ROS level and a more dynamic antioxidant metabolism may be important for the strong hydrotropism observed in Ws.
A notable set of genes related to strong hydrotropism in Ws are epigenetic factors, including genes responsible for DNA methylation and histone modification (Fig. 7D; Supplemental Table S3). In the past decade, epigenetics was shown to be of great significance in modulating gene expression in plant development and stress responses (Zhang, 2008; Chinnusamy and Zhu, 2009; Gutzat and Scheid, 2012; Wang et al., 2014a). Although no evidence has been reported to date on the epigenetic regulation of plant and root tropisms, studies revealed that the maintenance and functioning of the root apical meristem are epigenetic dependent (Kornet and Scheres, 2009). Moreover, epigenetic remodeling is essential for auxin-mediated lateral root initiation (Manzano et al., 2012; Lavenus et al., 2013). An integrated analysis of genomic and epigenomic data across over 200 Arabidopsis accessions indicated that an RNA-directed DNA methylation pathway was involved in ensuring proper expression in the context of specific tissue development in plants (Schmitz et al., 2013). Here, epigenetic regulation emerges as potentially important in the strong phenotype of root hydrotropism found in Ws.
Plant Hormone Pathways and BR-Mediated H+ Efflux Are Involved in the Root Hydrotropic Response of Arabidopsis
To date, only four hydrotropic mutants, namely miz1, miz2, ahr1, and nhr1, have been released and physiologically described in Arabidopsis. The genes underlying two of them, miz1 and miz2, have been cloned using map-based cloning and analyzed at the molecular-genetic level (Eapen et al., 2003; Kobayashi et al., 2007; Miyazawa et al., 2009; Moriwaki et al., 2011; Saucedo et al., 2012). Through investigations of these mutants, the phytohormone auxin was shown to be critical to the differential root growth and regulation of lateral root formation seen during hydrotropism, and ABA was shown to influence the hydrotropic response (Moriwaki et al., 2013). Moreover, in the presence of cytokinins, ahr1 displayed a degree of hydrotropism similar to that of the wild type, indicating that cytokinins play an important role (Saucedo et al., 2012). In this study, we confirm that the signal transduction pathways involving auxin, ABA, and cytokinins were altered significantly by hydrotropism in the three ecotypes (Fig. 4D).
With their predominant role in promoting cell elongation and cell division, BRs mediate diverse biological processes in plants, including root development and abiotic stress responses (Zhu et al., 2013; Wang et al., 2014b). Our transcriptomic data indicated dramatic changes in the expression of multiple genes involved in BR biosynthesis and signal transduction during the hydrotropic response (Fig. 4). Recent studies showed that plant cell wall homeostasis is mediated by BR signaling (Wolf et al., 2012b; Zhu et al., 2013). Likewise, a high proportion of genes involved in cell wall homeostasis (Fig. 4A), such as AtTCH4 (AT5G57560, xyloglucan endotransglucosylase, a cell wall-modifying enzyme) belonging to downstream components of BR signal transduction, were expressed differentially during the hydrotropic response (Fig. 5A). When BRI1 (a cell-surface receptor in the BR pathway) is partially deficient in the Ws background (bri1-5), Ws partly loses its strong hydrotropism on a water stress gradient containing Hoagland medium (Fig. 6). In addition, the PM H+-ATPase is required to mediate transmembrane H+ flux, and it can be activated by BR signaling, resulting in cell wall remodeling via both cytosolic and apoplastic pH oscillations (Caesar et al., 2011; Wolf et al., 2012a). Our results showed that the activity of the PM H+-ATPase in Ws was higher than in C24 under water stress (Supplemental Fig. S3). No significant difference in PM H+-ATPase activity was found between Ws and C24 under water stress when BR biosynthesis was inhibited. An assay of H+ flux in roots of the three ecotypes revealed an increase in H+ efflux during the hydrotropic response (Fig. 8).
CPD, one of the key genes controlling BR biosynthesis, is known to negatively reflect the tissue level of BR via feedback regulation in Arabidopsis plants (Oh et al., 2012). CPD expression in Ws was lower than in C24 under water stress, which indicates that the level of BR in Ws was higher than in C24 in this process (Fig. 9). Furthermore, the H+ flux in the root elongation zone and primary root elongation in Ws were higher than in C24 under water stress. When using BRZ, an inhibitor of BR biosynthesis, the BR tissue level, H+ efflux, and primary root elongation in Ws were similar to those of C24 under water stress. Using VA, a PM H+-ATPase inhibitor, the H+ efflux and primary root elongation of Ws were similar to those of C24 under water stress. Nevertheless, the BR level was still higher in Ws than in C24 (CPD gene expression was lower in C24). Using FC, a PM H+-ATPase stimulator, BR level, H+ efflux, and primary root elongation in Ws were higher than those of C24 under water stress. However, under water stress with FC plus BRZ, the BR level, H+ efflux, and primary root elongation of Ws were similar to those of C24. Our results suggest that H+ efflux and BR also play important roles in root curvature for hydrotropism (Fig. 10). In addition, BRI1 interacts with AHA2, and their coordinated gene expression may contribute to the stronger hydrotropic response (root elongation or root curvature) of Ws when compared with C24 (Fig. 11). Taken together, our results suggest that BR-mediated H+ efflux is required for primary root elongation and curvature in the hydrotropic response of Arabidopsis, and BRI1 may interact with AHA2 (a PM H+-ATPase) to play an important role in this process.
In conclusion, our results indicate that BR-associated H+ efflux is critical in the hydrotropic response (vertical and oblique orientation) of Arabidopsis plants. Our findings not only provide a common molecular framework for hydrotropism in Arabidopsis but also indicate some unique mechanistic components involved in the hydrotropic response in different Arabidopsis ecotypes. Additionally, future genetic screenings of either positively or negatively hydrotropic mutants using this modified hydrotropic experimental system promise to offer important new insights into root hydrotropism in plants.
MATERIALS AND METHODS
Plant Materials and Growth Conditions
A set of 31 Arabidopsis (Arabidopsis thaliana) accessions that originated in diverse regions of the world was used in this study (Table I). In addition, the Arabidopsis mutant miz1 (AT2G41660; Kobayashi et al., 2007) was obtained from the Arabidopsis Biological Resource Center, and nhr1 (Eapen et al., 2003) was donated by the Cassab laboratory. Seeds were surface sterilized and then plated on NM, which comprised solidified one-half-strength Hoagland medium, 0.8% (w/v) agar, and 1% (w/v) Suc, pH 5.8. NM containing seeds was maintained at 4°C in the dark for 48 h and subsequently placed vertically for 5 d in a chamber at 23°C and a photoperiod of 16 h of light (photon flux density of 100 μmol m−2 s−1) and 8 h of dark.
Hydrotropism Response Assay
The VHES was modified based on the method described by Saucedo et al. (2012). The preparation of this system needed two steps (Fig. 1A). First, the WSM, which was composed of NM, glycerol at 0.5% (v/v; for the preliminary hydrotropic response assays) or 0.3% (v/v; for further hydrotropic response assays), and 0.1% (w/v) sodium alginate, was poured onto a plastic square plate. Sodium alginate was added to facilitate WSM solidification. After solidification, one-third of the WSM was cut away vertically and then filled with NM to the same thickness. Therefore, the hydrotropic experimental system consisted of two media with differing water potentials. The top part consisted of WSM with lower water potential and the bottom part consisted of NM with higher water potential to trigger the hydrotropic response (Fig. 1). Plates were stored at 4°C for 24 h to establish a water potential gradient prior to use. Then, the water potential of the hydrotropic experimental system containing 0.5% (v/v) glycerol and 0.1% (w/v) sodium alginate was measured at various distances along the plate, from WSM to NM, using an Osmomat 030 cryoscopy osmometer (Gonotec) as described by Saucedo et al. (2012). Five-day-old seedlings germinated on NM were transferred to the WSM portion of the hydrotropic experimental system. The root tips of the seedlings were placed 1 cm above the interphase of both media. As a control, other seedlings were placed on square plates with two-thirds NM and one-third NM (Fig. 1). All the plates were oriented vertically and maintained in the chamber described above for 5 d. The length of primary roots was measured using ImageJ software, version 1.49 (http://rsb.info.nih.gov/ij/). The inhibition ratio of root growth was calculated using the following formula:
 |
where H represents the inhibition ratio of root growth, C is the primary root length developed on NM, and W is the primary root length grown in the hydrotropic experimental system. The OHES was set up according to Takahashi et al. (2002). Briefly, one-half-strength Murashige and Skoog medium was poured onto square plates. After solidification of the agar, one-half of the medium was cut at a 54° angle using a scalpel. The lower part of the plate was removed and replaced with Murashige and Skoog medium supplemented with 400 mm sorbitol. Root tips of 5-d-old seedlings germinated on one-half-strength Murashige and Skoog medium were transferred and placed on the border between these two media, and the plates were positioned vertically. After 18 h, the root curvature angle was measured. Each of the three biological replicates was represented by three technical replicates.
cDNA Library Preparation and Sequencing
For RNA sequencing, seeds of C24, Col-0, and Ws were germinated on NM for 5 d and transferred to a hydrotropic experimental system (0.3%) or a control system for 2 d as described above. Approximately 0.3 g of root tissue of each accession was harvested. The harvested tissue was immediately frozen in liquid nitrogen and stored at −80°C. Samples were collected in three biological replicates.
Total RNA was extracted from root samples using TRIzol reagent (Invitrogen). Total RNA quality and concentration were determined using an Agilent 2100 Bioanalyzer (Agilent Technologies; Supplemental Table S1). First-strand cDNA was generated using reverse transcriptase and random hexamers, then sequenced using an Illumina HiSeq 2000 platform located at the Beijing Genomics Institute. Six kinds of treatment processing, C24-CK (seedlings grown in the control system), C24-WS (seedlings grown in the hydrotropic experimental system), Col-0-CK, Col-0-WS, Ws-CK, and Ws-WS were constructed.
Assessment of Differential Gene Transcription
Clean reads were determined by quality control of raw reads using FastQC software (version 0.10.1). The remaining set of reads was assigned to the Arabidopsis reference genome (TAIR 10) and 1,001 genome data (http://1001genomes.org/) by SOAP 2.21 software. The RPKM method (for reads per kb per million reads) was performed to define transcript abundance. Differential gene expression across samples was deemed significant when expression differences reached 2-fold or higher at P < 0.001. Gene annotations and GO classifications were obtained from TAIR and GO (http://www.geneontology.org/). Pathway enrichment analysis used KEGG (http://www.genome.jp/kegg/) databases, with P < 0.05 as a threshold. For the new transcript and alternative splice survey, Coding Potential Calculator (http://cpc.cbi.pku.edu.cn/) and TopHat software were used. Transcription patterns were clustered utilizing Cluster 3.0 with Euclidean distances, and resulting tree figures were displayed by Java Treeview (http://jtreeview.sourceforge.net/).
RT-qPCR
To validate the RNA-seq results, two sets of RT-qPCRs were carried out. The first set of 10 genes was selected randomly among those with the GO classifications of interest. A second set of seven genes included AtMIZ1 (AT2G41660), AtMIZ2 (AT1G13980), and five genes related to H+ efflux. Total RNA was extracted as above, and first-strand cDNA was synthesized using the First Strand cDNA Synthesis kit (Roche) according to the manufacturer’s instructions. RT-qPCR was performed using the Bio-Rad Real-Time PCR Detection System based on the FastStart Universal SYBR Green Master mix (Roche), following the manufacturer’s instructions. The results were normalized using AtActin12 (AT3G46520) as an endogenous control. Primers are listed in Supplemental Table S2. Each of the three biological replicates was represented by four technical replicates.
H+, Ca2+, and H2O2 Flux Assays in the Root Cap
Plant materials were collected after seedlings were exposed to the hydrotropic experimental system or control system for 5, 24, and 48 h. The H+, Ca2+, and H2O2 fluxes in root caps were measured noninvasively using the scanning ion-selective electrode technique (SIET system BIO-003A; Younger USA Science and Technology) according to Xu et al. (2012).
Split-Ubiquitin Y2H Assay
The amplified PCR products of BRI1 and AHA2 coding DNA sequences were subcloned into pPR3-N NubG (including the N-terminal half of ubiquitin) and pBT-3N Cub (including the C-terminal half of ubiquitin) vectors to yield fusion constructs, respectively. Primers are listed in Supplemental Table S2. The split-ubiquitin Y2H assay was performed as described previously (Grefen et al., 2009).
BiFC Assay
The coding regions of BRI1 and AHA2 were subcloned into pCAMBIA1300-N1-YFPN and pCAMBIA1300-N1-YFPC vectors to yield nYFP and cYFP fusion constructs, respectively. The primers used are listed in Supplemental Table S2. The experiments were performed as described previously (Ma et al., 2014). The YFP fluorescence images were obtained using the Olympus Confocal Laser Scanning Microscope FV1000.
Phylogenetic Analysis and Structure Modeling
A phylogenetic tree was constructed using MEGA version 4.1 software (www.megasoftware.net/). Cartoon representations of BRI1 and AHA2 crystal structures were drawn using Pymol software (www.pymol.org). The x-ray crystal structures of BRI1 (Protein Data Bank codes 3RGX and 5LPZ) and AHA2 (Protein Data Bank code 1RT8) served as the templates.
Accession Numbers
Accession numbers are as follows: AT3G48520, AT1G09750, AT5G49630, AT5G59520, AT1G76650, AT5G37770, AT1G45249, AT1G30135, AT2G21210, AT1G70210, AT2G14100, AT1G30040, AT1G80340, AT1G09090, AT1G48130, AT2G41660, AT1G13980, AT3G46520, AT3G44490, AT3G44660, AT3G22680, AT3G09270, AT5G60660, and AT3G16240.
Supplemental Data
The following supplemental materials are available.
Supplemental Figure S1. Measurements of primary root elongation of Arabidopsis seedlings grown in the hydrotropic experimental system with 0.5% glycerol or 0.3% glycerol for 5 d.
Supplemental Figure S2. RT-qPCR validation of differential transcription identified by RNA-seq.
Supplemental Figure S3. Activity of PM H+-ATPase in two Arabidopsis ecotypes in the hydrotropic experimental system with 0.5% glycerol and with pharmacological treatment.
Supplemental Figure S4. Characteristics of PM H+-ATPase gene family members in Arabidopsis Col-0.
Supplemental Figure S5. Root gravitropic responses of C24, Col-0, and Ws seedlings in normal and water stress media.
Supplemental Table S1. Summary of RNA-seq data.
Supplemental Table S2. Primers used in the study.
Supplemental Table S3. DTGs in C24 and Ws on a water stress gradient (log2 ratio > 1).
Acknowledgments
We thank Dr. Qianfeng Li (Yang Zhou University) for bri1-5 seeds.
Footnotes
This work was supported by the National Natural Science Foundation of China (nos. 31761130073, 31422047, and 31600209), National Basic Research Program of China (nos. 2013CB127402 and 2012CB114300), Hong Kong Research Grant Council (14122415, 14160516, 14177617, AoE/M-05/12, and AoE/M-403/16), and Research Grant of Fujian Agriculture and Forestry University (KXGH17005).
Articles can be viewed without a subscription.
References
- Apel K, Hirt H (2004) Reactive oxygen species: metabolism, oxidative stress, and signal transduction. Annu Rev Plant Biol 55: 373–399 [DOI] [PubMed] [Google Scholar]
- Baxter A, Mittler R, Suzuki N (2014) ROS as key players in plant stress signalling. J Exp Bot 65: 1229–1240 [DOI] [PubMed] [Google Scholar]
- Caesar K, Elgass K, Chen Z, Huppenberger P, Witthöft J, Schleifenbaum F, Blatt MR, Oecking C, Harter K (2011) A fast brassinolide-regulated response pathway in the plasma membrane of Arabidopsis thaliana. Plant J 66: 528–540 [DOI] [PubMed] [Google Scholar]
- Chinnusamy V, Zhu JK (2009) Epigenetic regulation of stress responses in plants. Curr Opin Plant Biol 12: 133–139 [DOI] [PMC free article] [PubMed] [Google Scholar]
- Dietrich D, Pang L, Kobayashi A, Fozard JA, Boudolf V, Bhosale R, Antoni R, Nguyen T, Hiratsuka S, Fujii N, et al. (2017) Root hydrotropism is controlled via a cortex-specific growth mechanism. Nat Plants 3: 17057. [DOI] [PubMed] [Google Scholar]
- Eapen D, Barroso ML, Campos ME, Ponce G, Corkidi G, Dubrovsky JG, Cassab GI (2003) A no hydrotropic response root mutant that responds positively to gravitropism in Arabidopsis. Plant Physiol 131: 536–546 [DOI] [PMC free article] [PubMed] [Google Scholar]
- Eapen D, Barroso ML, Ponce G, Campos ME, Cassab GI (2005) Hydrotropism: root growth responses to water. Trends Plant Sci 10: 44–50 [DOI] [PubMed] [Google Scholar]
- Gilroy S. (2008) Plant tropisms. Curr Biol 18: R275–R277 [DOI] [PubMed] [Google Scholar]
- Gutzat R, Scheid OM (2012) Epigenetic responses to stress: triple defense? Curr Opin Plant Biol 15: 568–573 [DOI] [PMC free article] [PubMed] [Google Scholar]
- Hart JW. (1990) Plant Tropism and Growth Movement. Unwin Hyman, London [Google Scholar]
- Kaneyasu T, Kobayashi A, Nakayama M, Fujii N, Takahashi H, Miyazawa Y (2007) Auxin response, but not its polar transport, plays a role in hydrotropism of Arabidopsis roots. J Exp Bot 58: 1143–1150 [DOI] [PubMed] [Google Scholar]
- Kobayashi A, Takahashi A, Kakimoto Y, Miyazawa Y, Fujii N, Higashitani A, Takahashi H (2007) A gene essential for hydrotropism in roots. Proc Natl Acad Sci USA 104: 4724–4729 [DOI] [PMC free article] [PubMed] [Google Scholar]
- Kornet N, Scheres B (2009) Members of the GCN5 histone acetyltransferase complex regulate PLETHORA-mediated root stem cell niche maintenance and transit amplifying cell proliferation in Arabidopsis. Plant Cell 21: 1070–1079 [DOI] [PMC free article] [PubMed] [Google Scholar]
- Krieger G, Shkolnik D, Miller G, Fromm H (2016) Reactive oxygen species tune root tropic responses. Plant Physiol 172: 1209–1220 [DOI] [PMC free article] [PubMed] [Google Scholar]
- Lavenus J, Goh T, Roberts I, Guyomarc’h S, Lucas M, De Smet I, Fukaki H, Beeckman T, Bennett M, Laplaze L (2013) Lateral root development in Arabidopsis: fifty shades of auxin. Trends Plant Sci 18: 450–458 [DOI] [PubMed] [Google Scholar]
- Liscum E, Askinosie SK, Leuchtman DL, Morrow J, Willenburg KT, Coats DR (2014) Phototropism: growing towards an understanding of plant movement. Plant Cell 26: 38–55 [DOI] [PMC free article] [PubMed] [Google Scholar]
- Liu S, Liu S, Wang M, Wei T, Meng C, Wang M, Xia G (2014) A wheat SIMILAR TO RCD-ONE gene enhances seedling growth and abiotic stress resistance by modulating redox homeostasis and maintaining genomic integrity. Plant Cell 26: 164–180 [DOI] [PMC free article] [PubMed] [Google Scholar]
- Ma Z, Hu X, Cai W, Huang W, Zhou X, Luo Q, Yang H, Wang J, Huang J (2014) Arabidopsis miR171-targeted scarecrow-like proteins bind to GT cis-elements and mediate gibberellin-regulated chlorophyll biosynthesis under light conditions PLoS Genet 10: e1004519. [DOI] [PMC free article] [PubMed] [Google Scholar]
- Manzano C, Ramirez-Parra E, Casimiro I, Otero S, Desvoyes B, De Rybel B, Beeckman T, Casero P, Gutierrez C, Del Pozo JC (2012) Auxin and epigenetic regulation of SKP2B, an F-box that represses lateral root formation. Plant Physiol 160: 749–762 [DOI] [PMC free article] [PubMed] [Google Scholar]
- Mittler R, Vanderauwera S, Suzuki N, Miller G, Tognetti VB, Vandepoele K, Gollery M, Shulaev V, Van Breusegem F (2011) ROS signaling: the new wave? Trends Plant Sci 16: 300–309 [DOI] [PubMed] [Google Scholar]
- Miyazawa Y, Takahashi A, Kobayashi A, Kaneyasu T, Fujii N, Takahashi H (2009) GNOM-mediated vesicular trafficking plays an essential role in hydrotropism of Arabidopsis roots. Plant Physiol 149: 835–840 [DOI] [PMC free article] [PubMed] [Google Scholar]
- Monshausen GB, Swanson SJ, Gilroy S (2008) Touch sensing and thigmotropism. In Gilroy S, Masson PH, eds, Plant Tropisms. Blackwell Publishing, Oxford, UK, [Google Scholar]
- Morita MT. (2010) Directional gravity sensing in gravitropism. Annu Rev Plant Biol 61: 705–720 [DOI] [PubMed] [Google Scholar]
- Moriwaki T, Miyazawa Y, Kobayashi A, Takahashi H (2013) Molecular mechanisms of hydrotropism in seedling roots of Arabidopsis thaliana (Brassicaceae). Am J Bot 100: 25–34 [DOI] [PubMed] [Google Scholar]
- Moriwaki T, Miyazawa Y, Kobayashi A, Uchida M, Watanabe C, Fujii N, Takahashi H (2011) Hormonal regulation of lateral root development in Arabidopsis modulated by MIZ1 and requirement of GNOM activity for MIZ1 function. Plant Physiol 157: 1209–1220 [DOI] [PMC free article] [PubMed] [Google Scholar]
- Moriwaki T, Miyazawa Y, Takahashi H (2010) Transcriptome analysis of gene expression during the hydrotropic response in Arabidopsis seedlings. Environ Exp Bot 69: 148–157 [Google Scholar]
- Oh E, Zhu JY, Wang ZY (2012) Interaction between BZR1 and PIF4 integrates brassinosteroid and environmental responses. Nat Cell Biol 14: 802–809 [DOI] [PMC free article] [PubMed] [Google Scholar]
- Salazar-Blas A, Noriega-Calixto L, Campos ME, Eapen D, Cruz-Vázquez T, Castillo-Olamendi L, Sepulveda-Jiménez G, Porta H, Dubrovsky JG, Cassab GI (2017) Robust root growth in altered hydrotropic response1 (ahr1) mutant of Arabidopsis is maintained by high rate of cell production at low water potential gradient. J Plant Physiol 208: 102–114 [DOI] [PubMed] [Google Scholar]
- Saucedo M, Ponce G, Campos ME, Eapen D, García E, Luján R, Sánchez Y, Cassab GI (2012) An altered hydrotropic response (ahr1) mutant of Arabidopsis recovers root hydrotropism with cytokinin. J Exp Bot 63: 3587–3601 [DOI] [PMC free article] [PubMed] [Google Scholar]
- Schmitz RJ, Schultz MD, Urich MA, Nery JR, Pelizzola M, Libiger O, Alix A, McCosh RB, Chen H, Schork NJ, et al. (2013) Patterns of population epigenomic diversity. Nature 495: 193–198 [DOI] [PMC free article] [PubMed] [Google Scholar]
- Takahashi H, Scott TK (1993) Intensity of hydrostimulation for the induction of root hydrotropism and its sensing by the root cap. Plant Cell Environ 16: 99–103 [DOI] [PubMed] [Google Scholar]
- Takahashi H, Suge H (1991) Root hydrotropism of an agravitropic pea mutant, ageotropum. Physiol Plant 82: 24–31 [DOI] [PubMed] [Google Scholar]
- Takahashi N, Goto N, Okada K, Takahashi H (2002) Hydrotropism in abscisic acid, wavy, and gravitropic mutants of Arabidopsis thaliana. Planta 216: 203–211 [DOI] [PubMed] [Google Scholar]
- Wang M, Qin L, Xie C, Li W, Yuan J, Kong L, Yu W, Xia G, Liu S (2014a) Induced and constitutive DNA methylation in a salinity-tolerant wheat introgression line. Plant Cell Physiol 55: 1354–1365 [DOI] [PubMed] [Google Scholar]
- Wang W, Bai MY, Wang ZY (2014b) The brassinosteroid signaling network: a paradigm of signal integration. Curr Opin Plant Biol 21: 147–153 [DOI] [PMC free article] [PubMed] [Google Scholar]
- Wei Z, Li J (2016) Brassinosteroids regulate root growth, development, and symbiosis. Mol Plant 9: 86–100 [DOI] [PubMed] [Google Scholar]
- Wolf S, Hématy K, Höfte H (2012a) Growth control and cell wall signaling in plants. Annu Rev Plant Biol 63: 381–407 [DOI] [PubMed] [Google Scholar]
- Wolf S, Mravec J, Greiner S, Mouille G, Höfte H (2012b) Plant cell wall homeostasis is mediated by brassinosteroid feedback signaling. Curr Biol 22: 1732–1737 [DOI] [PubMed] [Google Scholar]
- Xu W, Jia L, Baluška F, Ding G, Shi W, Ye N, Zhang J (2012) PIN2 is required for the adaptation of Arabidopsis roots to alkaline stress by modulating proton secretion. J Exp Bot 63: 6105–6114 [DOI] [PMC free article] [PubMed] [Google Scholar]
- Xu W, Jia L, Shi W, Liang J, Zhou F, Li Q, Zhang J (2013) Abscisic acid accumulation modulates auxin transport in the root tip to enhance proton secretion for maintaining root growth under moderate water stress. New Phytol 197: 139–150 [DOI] [PubMed] [Google Scholar]
- Yuan W, Zhang D, Song T, Xu F, Lin S, Xu W, Li Q, Zhu Y, Liang J, Zhang J (2017) Arabidopsis plasma membrane H+-ATPase genes AHA2 and AHA7 have distinct and overlapping roles in the modulation of root tip H+ efflux in response to low-phosphorus stress. J Exp Bot 68: 1731–1741 [DOI] [PMC free article] [PubMed] [Google Scholar]
- Zhang X. (2008) The epigenetic landscape of plants. Science 320: 489–492 [DOI] [PubMed] [Google Scholar]
- Zhu JY, Sae-Seaw J, Wang ZY (2013) Brassinosteroid signalling. Development 140: 1615–1620 [DOI] [PMC free article] [PubMed] [Google Scholar]


