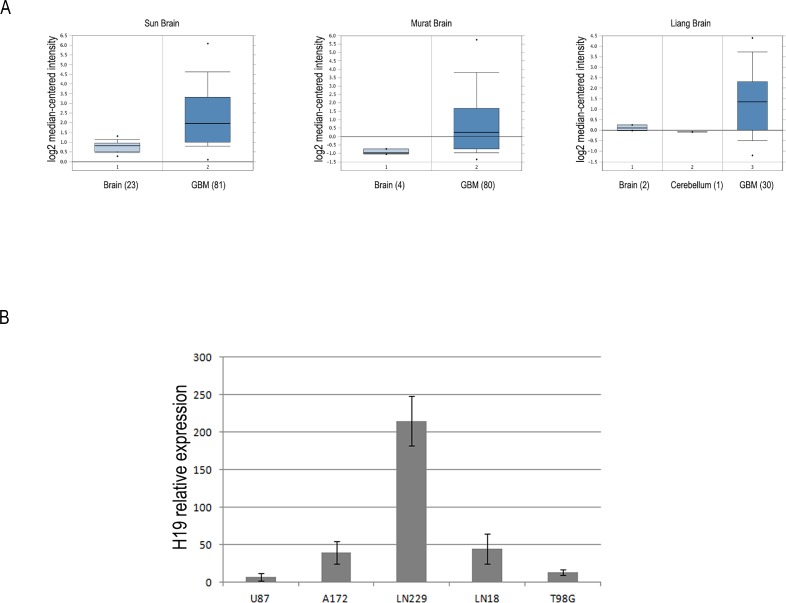
Figure 1. The lncRNA H19 is overexpressed in glioblastoma tissues and cell lines compared to heathy white matter.
(A) Box-plots of relative H19 expression in glioblastoma and normal brain samples in three distinct datasets from Oncomine database (https://www.oncomine.org/). For each group of samples, the number in brackets represents the number of subjects analyzed. The horizontal lines represent the median values and the bottom and the top of the boxes correspond to the 25th and 75th percentiles, respectively. A non-parametric t test was performed to calculate p values as indicated in the text. (B) RT-qPCR analysis of relative H19 expression in five human glioblastoma cell lines. All data are expressed as compared to H19 expression levels measured in a healthy white matter sample, set as = 1.

