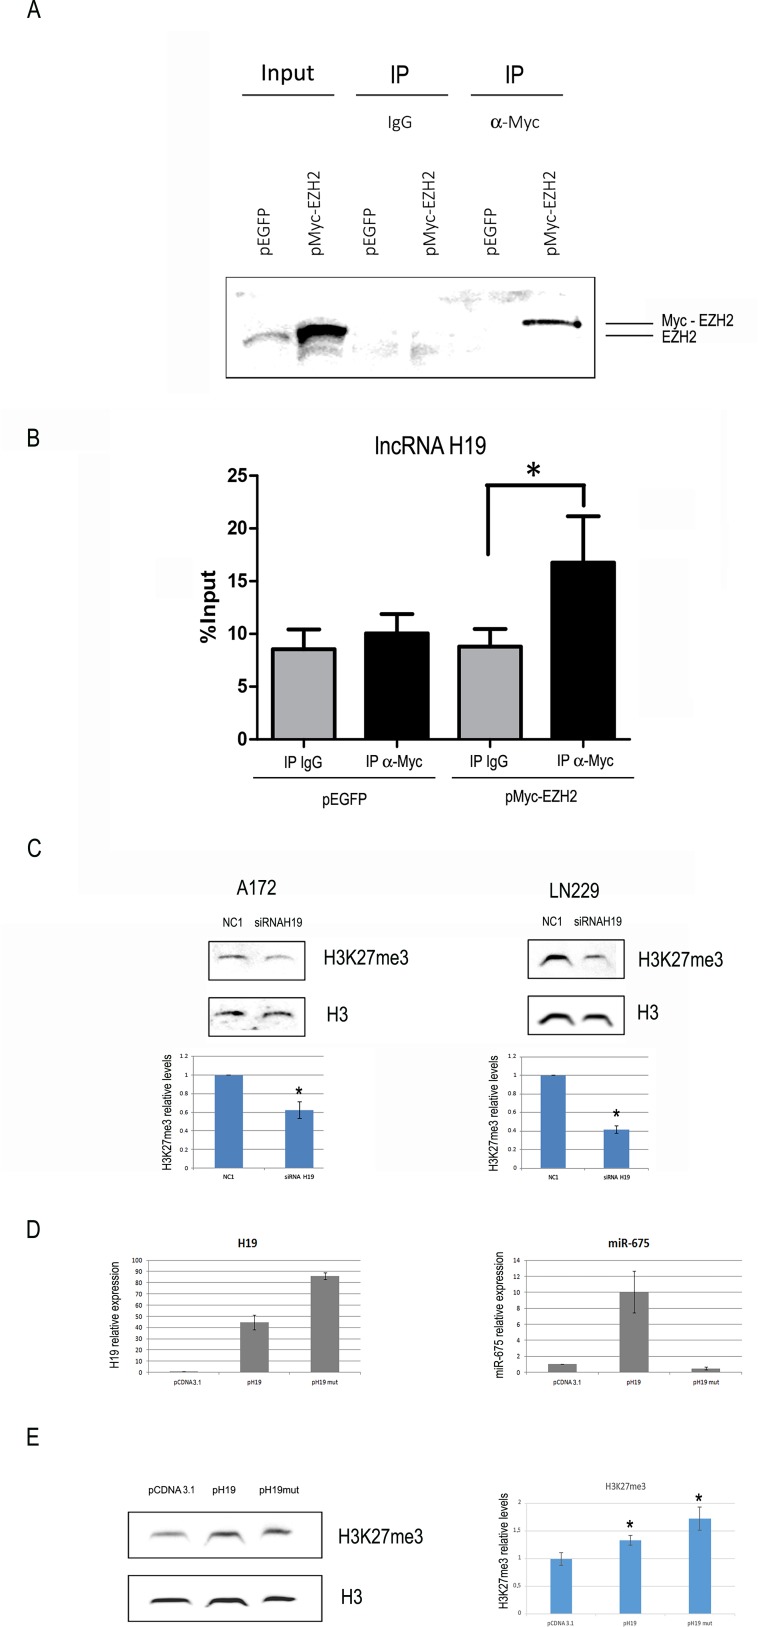
Figure 4. H19 is coimmunoprecipitated with EZH2 and its modulation affects global H3K27 trimethylation in glioblastoma cells.
(A) Cells were transfected with either the negative control vector pEGFP or pMyc-EZH2, a vector encoding a Myc-tagged form of EZH2. Western blot analysis was performed with an antibody against EZH2. The first two lanes (input) show the results of EZH2 WB on total extracts, revealing both endogenous and ectopic EZH2. The remaining lanes, labelled as “IP”, represent proteins immunoprecipitated with either negative control IgGs (third and fourth lanes) or an anti-Myc antibody (fifth and sixth lanes). (B) H19 measurement by RT-qPCR on RNA extracted from the IP samples as in (A). Values derived from three independent experiments are reported as means ± s.e.m. and expressed as the percentage of the Input (% Input). Statistically significant differences are reported (*P < 0.05). (C) Representative western blot analysis (top) and quantification (bottom) of total H3 and H3K27me3 levels in A172 (left) or LN229 (right) cells at 48 h after transfection with either a negative control oligonucleotide (NC1) or an anti-H19 siRNA. Total H3 levels are used as loading controls. (D) H19 (left panel) or miR-675-5p (right panel) expression in A172 cells transfected with either the empty vector pCDNA3, or the H19-expressing vector pH19, or the vector pH19mut, encoding for a full length H19 mutated in the miR-675 region. In both panels, data are expressed as compared to pCDNA3-transfected cells, where H19 and miR-675-5p levels are set as = 1. (E) Representative western blot analysis (left) and quantification (right) of H3K27me3 and total H3 (loading control) in the same A172 cells as in D. Results in (C–E) are shown as the mean ± S.D. and represent the average of three experiments performed independently. Data were analyzed by a two-tailed unpaired Student’s t-test. *P < 0.05.

